What are resistance and support, and how to use them in trading
Written by Mariyam Sara
Published on October 13, 2025 | 4 min read

Profitable trading essentially boils down to entering and exiting a trade at the right time. But to spot those profitable entry and exit points, you need to be well-versed in analysing the stock charts.
Let’s begin with resistance and support levels, the basics of technical analysis that will help you understand when to enter or exit a trade.
What is the resistance level in a stock chart?
When you open a stock chart, you will notice the share price generally declines after hitting a certain price point or range, which is the resistance level. You can think of a resistance level as a glass ceiling, after which the share prices decline.
A stock’s resistance point is where investors and traders tend to sell the stock and book profits as they view the stock as overpriced. Due to this, the resistance range is also called the ‘supply zone’.
If the share price breaks the resistance and continues to rise, it is called a breakout of resistance, signaling a bullish trend. After this price breakout, the stock’s previous resistance level becomes the new support level.
In the following chart, you will see the price movement of TCS shares from July 2021 to July 2025.
TCS Price Chart
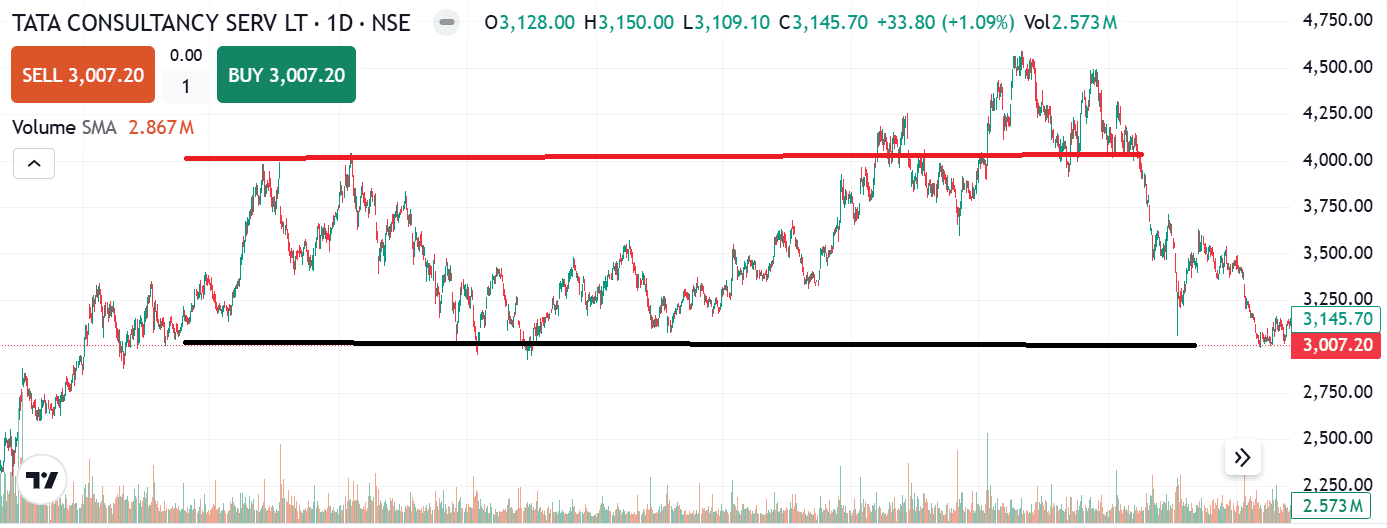
You will observe the TCS share’s price hitting a price of around ₹4000 and then declining, which is the TCS share’s resistance range.
What is a support level in a stock chart?
A support is the lowest price a share frequently hits before it bounces back up. The price or the price range at which the share frequently falls to and rises from is called the support point or range.
A stock’s support range is determined by the market. Once a stock hits its support point, the bulls start buying the shares, thereby causing an uptrend. The support price range is also called the ‘demand zone’.
When the share price breaks the support and falls further, that event is called ‘breakdown of support’, signalling a bearish trend. Once a price breakdown occurs, the stock’s previous support level becomes the new resistance level.
In the following chart, you will see the price movement of TCS shares from July 2021 to July 2025.
TCS Resistance & Support Level
Can you spot the support range of this stock?
You will observe TCS shares repeatedly falling to around ₹3000 and then rising. This is the stock’s support range at which the bulls buy the stock, causing an uptrend.
How to use resistance and support in trading?
For a successful trade, you need to know how to enter or exit a trade by spotting the resistance and support points.
Typically, a stock price doesn’t move up or down in a linear fashion. After it moves above the resistance level, it will come down again to the earlier resistance level. This is called retesting of resistance.
When you observe a breakout of resistance, don’t rush to enter the trade out of FOMO (fear of missing out). The share price will likely fall to the previous resistance range and start rising, making a higher high. This is a better time to enter the trade. This is called “buy on retesting”.
Similarly, when you observe a breakdown of support, don’t panic and sell the stock. Instead, exit only when the share price hits the previous support level. This is called “sell on retesting”.

To strengthen your trading skills, practice spotting the resistance and support levels by opening the chart of any listed company stock on tv.upstox.com and identifying price breakouts or breakdowns, if any.
To learn in-depth technical analysis by experienced traders, sign up on UpLearn and become a skilled trader!
About Author
Mariyam Sara
Sub-Editor
holds an MBA in Finance and is a true Finance Fanatic. She writes extensively on all things finance whether it’s stock trading, personal finance, or insurance, chances are she’s covered it. When she’s not writing, she’s busy pursuing NISM certifications, experimenting with new baking recipes.
Read more from Mariyam


Upstox is a leading Indian financial services company that offers online trading and investment services in stocks, commodities, currencies, mutual funds, and more. Founded in 2009 and headquartered in Mumbai, Upstox is backed by prominent investors including Ratan Tata, Tiger Global, and Kalaari Capital. It operates under RKSV Securities and is registered with SEBI, NSE, BSE, and other regulatory bodies, ensuring secure and compliant trading experiences.
Related articles
Share Market
What is the Difference Between Small Gain & Capital Gain?4 min read | Written by Dev Sethia

Share Market
Types of Stocks: Large Cap, Mid Cap, Small Cap Explained5 min read | Written by Pradnya Surana


Share Market
How Dividends Help You Earn Passive Income From the Stock Market3 min read | Written by Pradnya Surana

Share Market
Growth Stocks in India – Their Meaning, How to Find & Examples4 min read | Written by Pradnya Surana