What is the Awesome Oscillator? How Does It Work in Trading?
Written by Subhasish Mandal
Published on January 07, 2026 | 3 min read


In the world of trading, traders often rely on a variety of technical indicators to make decisions about buying and selling of securities. One such indicator is the Awesome Oscillator. Developed by a trader and author, Bill Williams, the Awesome Oscillator is a technical analysis tool that is used to identify market trends, reversal and potential trade opportunities.
Understanding Awesome Oscillator
The Awesome Oscillator (AO) is a technical indicator used to measure the market momentum. It calculates the difference between a 34-period and a 5-period simple moving average (SMA). In this, the simple moving average is not calculated using the closing price, but rather it is calculated using the mid-points of each candlestick's bar.
AO also uses a zero line in the centre, either side of which price movements are plotted according to a comparison of 34-period and 5-period moving averages.
Here is the image of the Nifty price chart with an Awesome Oscillator placed in it.
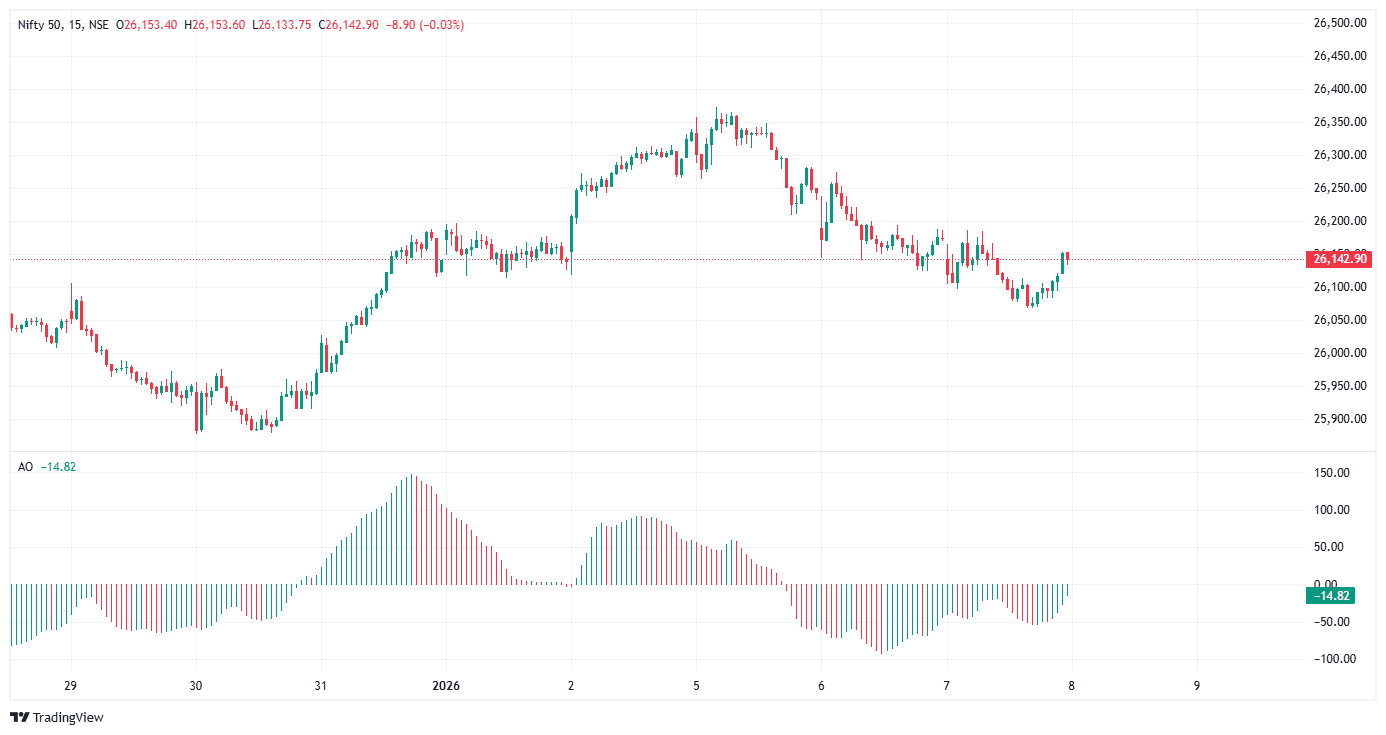
Source: Upstox, TradingView
Formula of Awesome Oscillator
The Awesome Oscillator involves calculating two moving averages, which are subtracted from different period SMA to get the final figure. Follow the steps below.
Step 1: Calculate the 5-period SMA using the midpoint of each candlestick's bar.
- Midpoint price of a candle = (High + Low) / 2
- Take the midpoint price of the last 5 candlesticks.
Step 2: Calculate the 5-period SMA using the midpoint of each candlestick's bar.
- Midpoint price of a candle = (High + Low) / 2
- Take the midpoint price of the last 34 candlesticks.
Step 3: Subtract the 34-period SMA from the 5-period SMA.
- Awesome Oscillator formula = 5-period SMA - 34-period SMA.
How Does the Awesome Oscillator Work?
The Oscillator fluctuates above or below zero, indicating changes in the momentum of securities.
When the histogram bar is above the zero line (centre line), signals market momentum is bullish, and prices are expected to rise. Here, the numerical figure of the oscillator is positive.
However, when the histogram bar is below the zero line, signals market momentum is bearish, and prices are expected to fall. Here, the numerical figure of the oscillator is negative.
Awesome Oscillator Trading Strategies
Traders use signals generated by the Awesome Oscillator to plan their entry and exit points. Some of the common AO trading strategies you can use to improve your trading.
Zero-line Cross Strategy
Awesome Oscillator, generate a zero-line cross. It means that when the AO value crosses above or below the zero line, it indicates a shift in the momentum of the stock prices.
- When the AO crosses above the zero line, the short-term trend is expected to shift upward, and prices may form a bullish reversal pattern.
- When the AO crosses below the zero line, the short-term trend is expected to shift downward, and prices may form a bearish reversal pattern.
Twin Peaks
It is a method which considers the difference between two peaks on the same side of the zero line.
- A bullish twin peaks setup occurs when two peaks of the histogram bars are below the zero line.
- A bearish twin peaks setup occurs when two peaks of the histogram are above the zero line.
Saucer
A saucer setup looks for more rapid changes in momentum. This setup is visible when three consecutive histogram bars are formed on the same side of the zero line.
- A bullish saucer setup occurs when the value of the Awesome Oscillator is above the zero line, and it engulfs the two consecutive red bars with a single green bar.
- A bullish saucer setup occurs when the value of the Awesome Oscillator is below the zero line, and it engulfs the two consecutive green bars with a single red bar.

An Awesome Oscillator can be a very valuable tool for traders who look to identify the price points of shifting momentum. AO can be used as an indicator which generates buy/sell signals based on advanced statistical calculations using simple moving averages. Understanding AO trading strategies can help traders to make informed decisions during the live market.
About Author
Subhasish Mandal
Sub-Editor
finance professional with strong expertise in stock market and personal finance writing, he excels at breaking down complex financial concepts into simple, actionable insights. Holding a Master’s degree in Commerce, he combines academic depth with practical knowledge of technical analysis and derivatives.
Read more from Subhasish


Upstox is a leading Indian financial services company that offers online trading and investment services in stocks, commodities, currencies, mutual funds, and more. Founded in 2009 and headquartered in Mumbai, Upstox is backed by prominent investors including Ratan Tata, Tiger Global, and Kalaari Capital. It operates under RKSV Securities and is registered with SEBI, NSE, BSE, and other regulatory bodies, ensuring secure and compliant trading experiences.
Related articles


Share Market
What is the Difference Between Small Gain & Capital Gain?4 min read | Written by Dev Sethia

Share Market
Types of Stocks: Large Cap, Mid Cap, Small Cap Explained5 min read | Written by Pradnya Surana


Share Market
How Dividends Help You Earn Passive Income From the Stock Market3 min read | Written by Pradnya Surana

Share Market
Growth Stocks in India – Their Meaning, How to Find & Examples4 min read | Written by Pradnya Surana