Switching screens to analyse & trade?
Not anymore!


ONE SCREEN. SEAMLESS TRADING
Introducing Chart
A single interface for convenient Options Trading on mobile or desktop
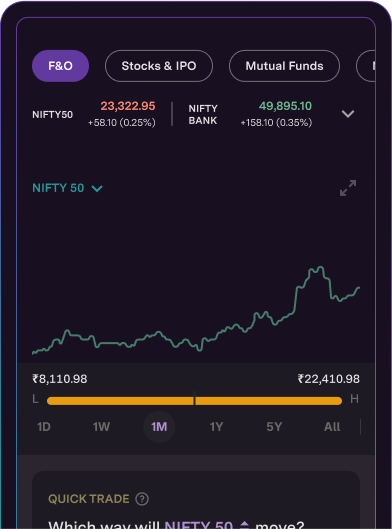
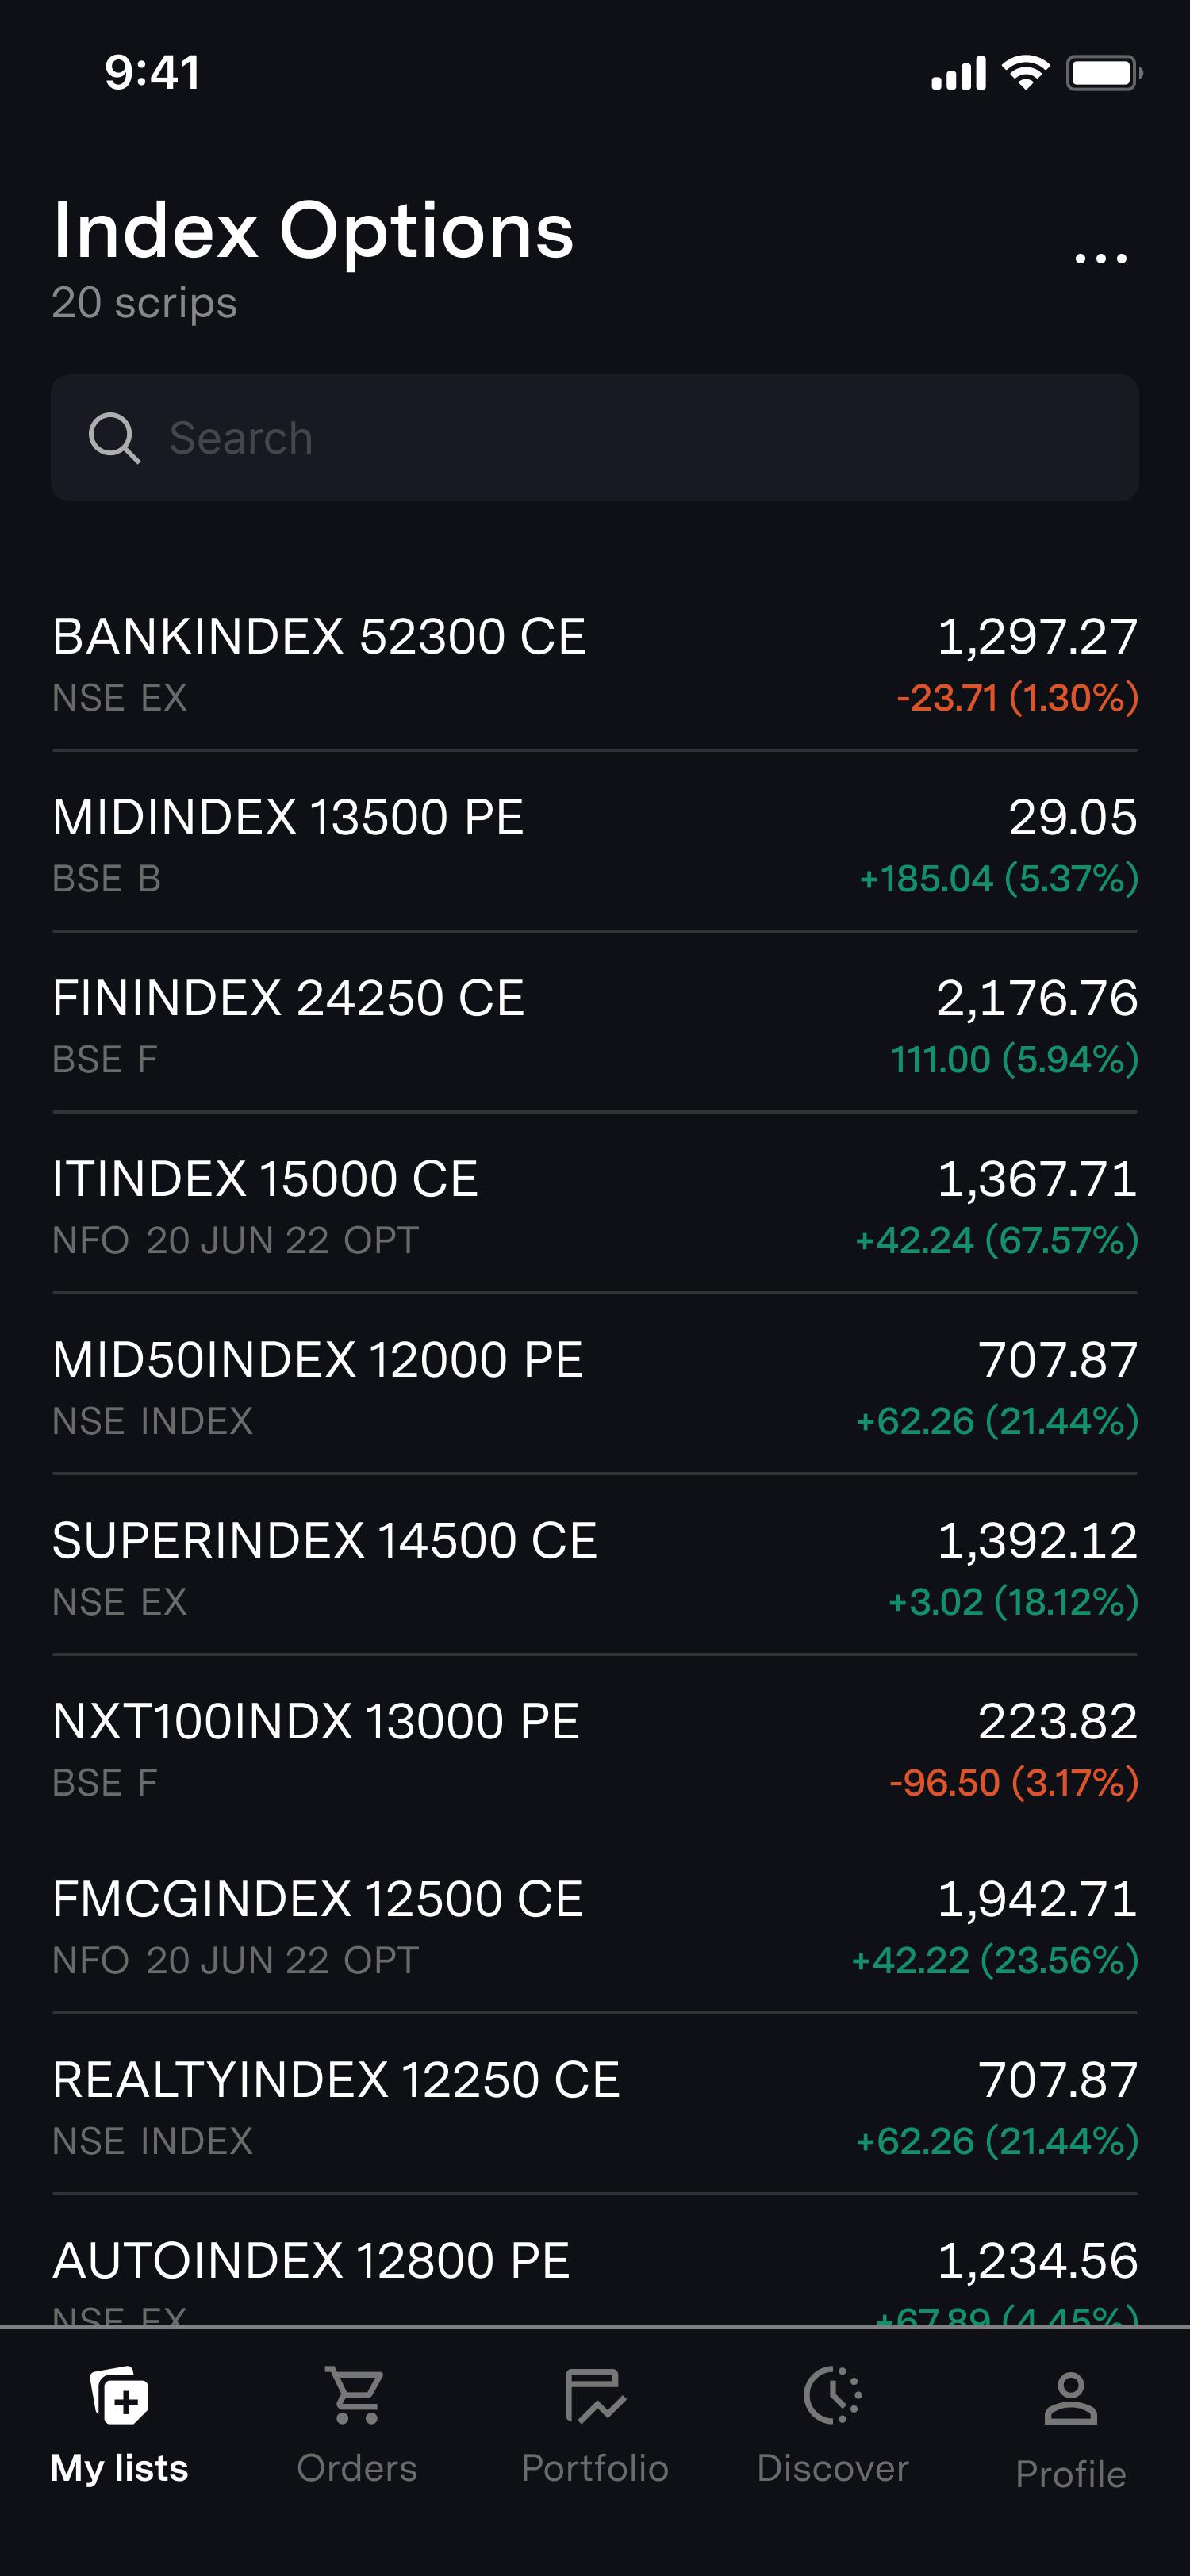
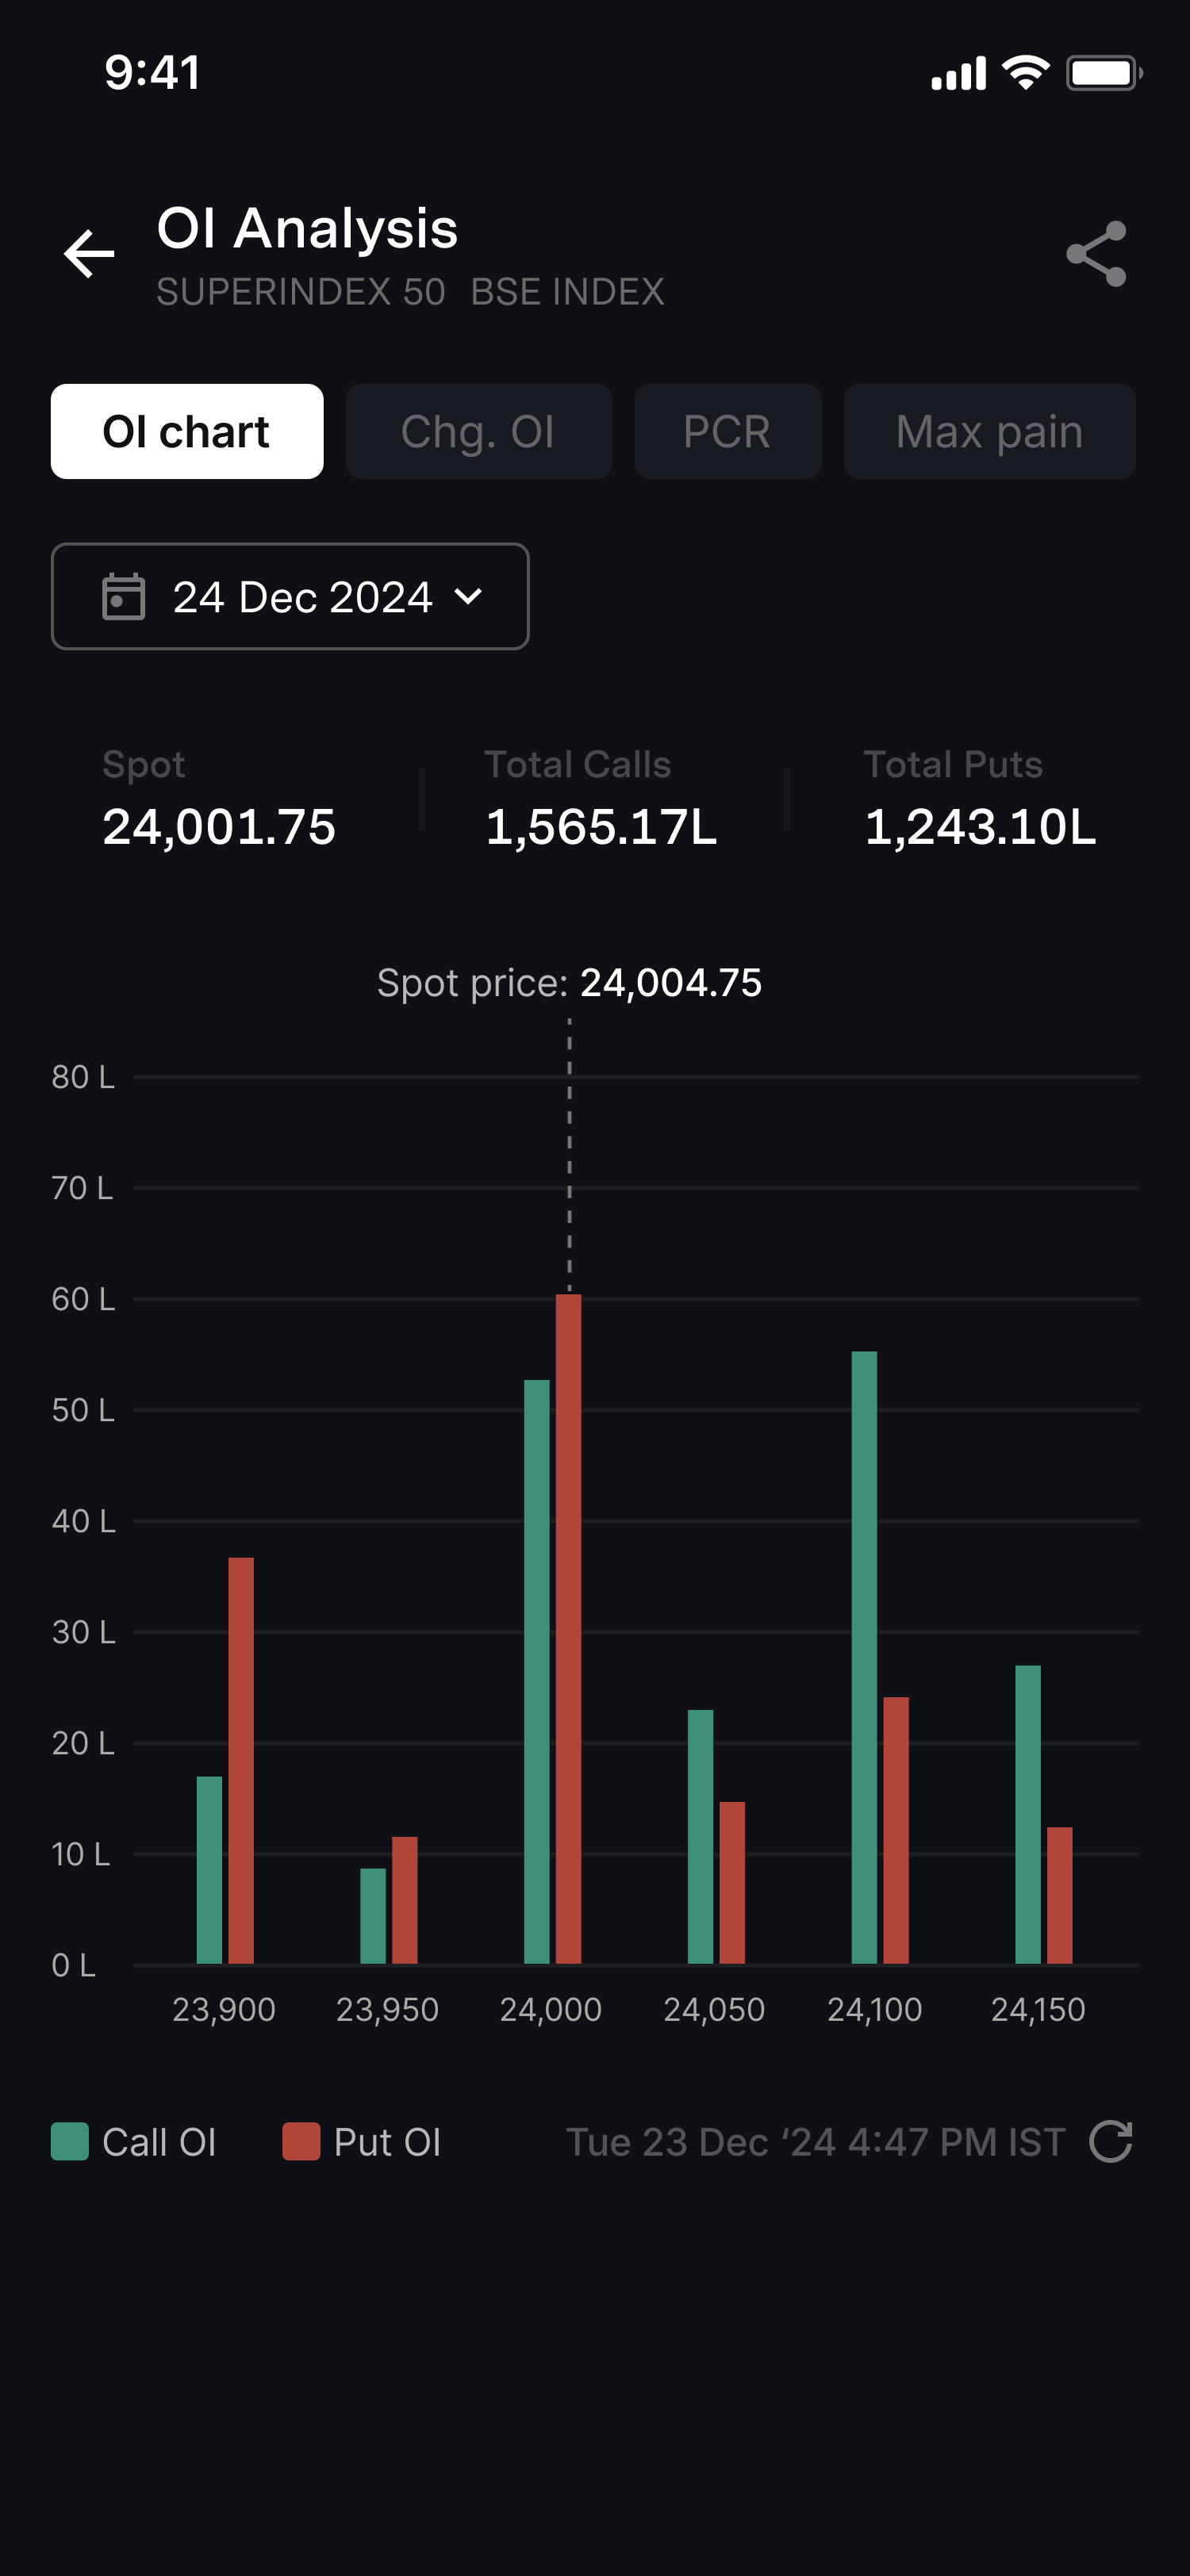
Analyse Smarter
Find opportunities by analysing CE/PE + index charts on a single screen
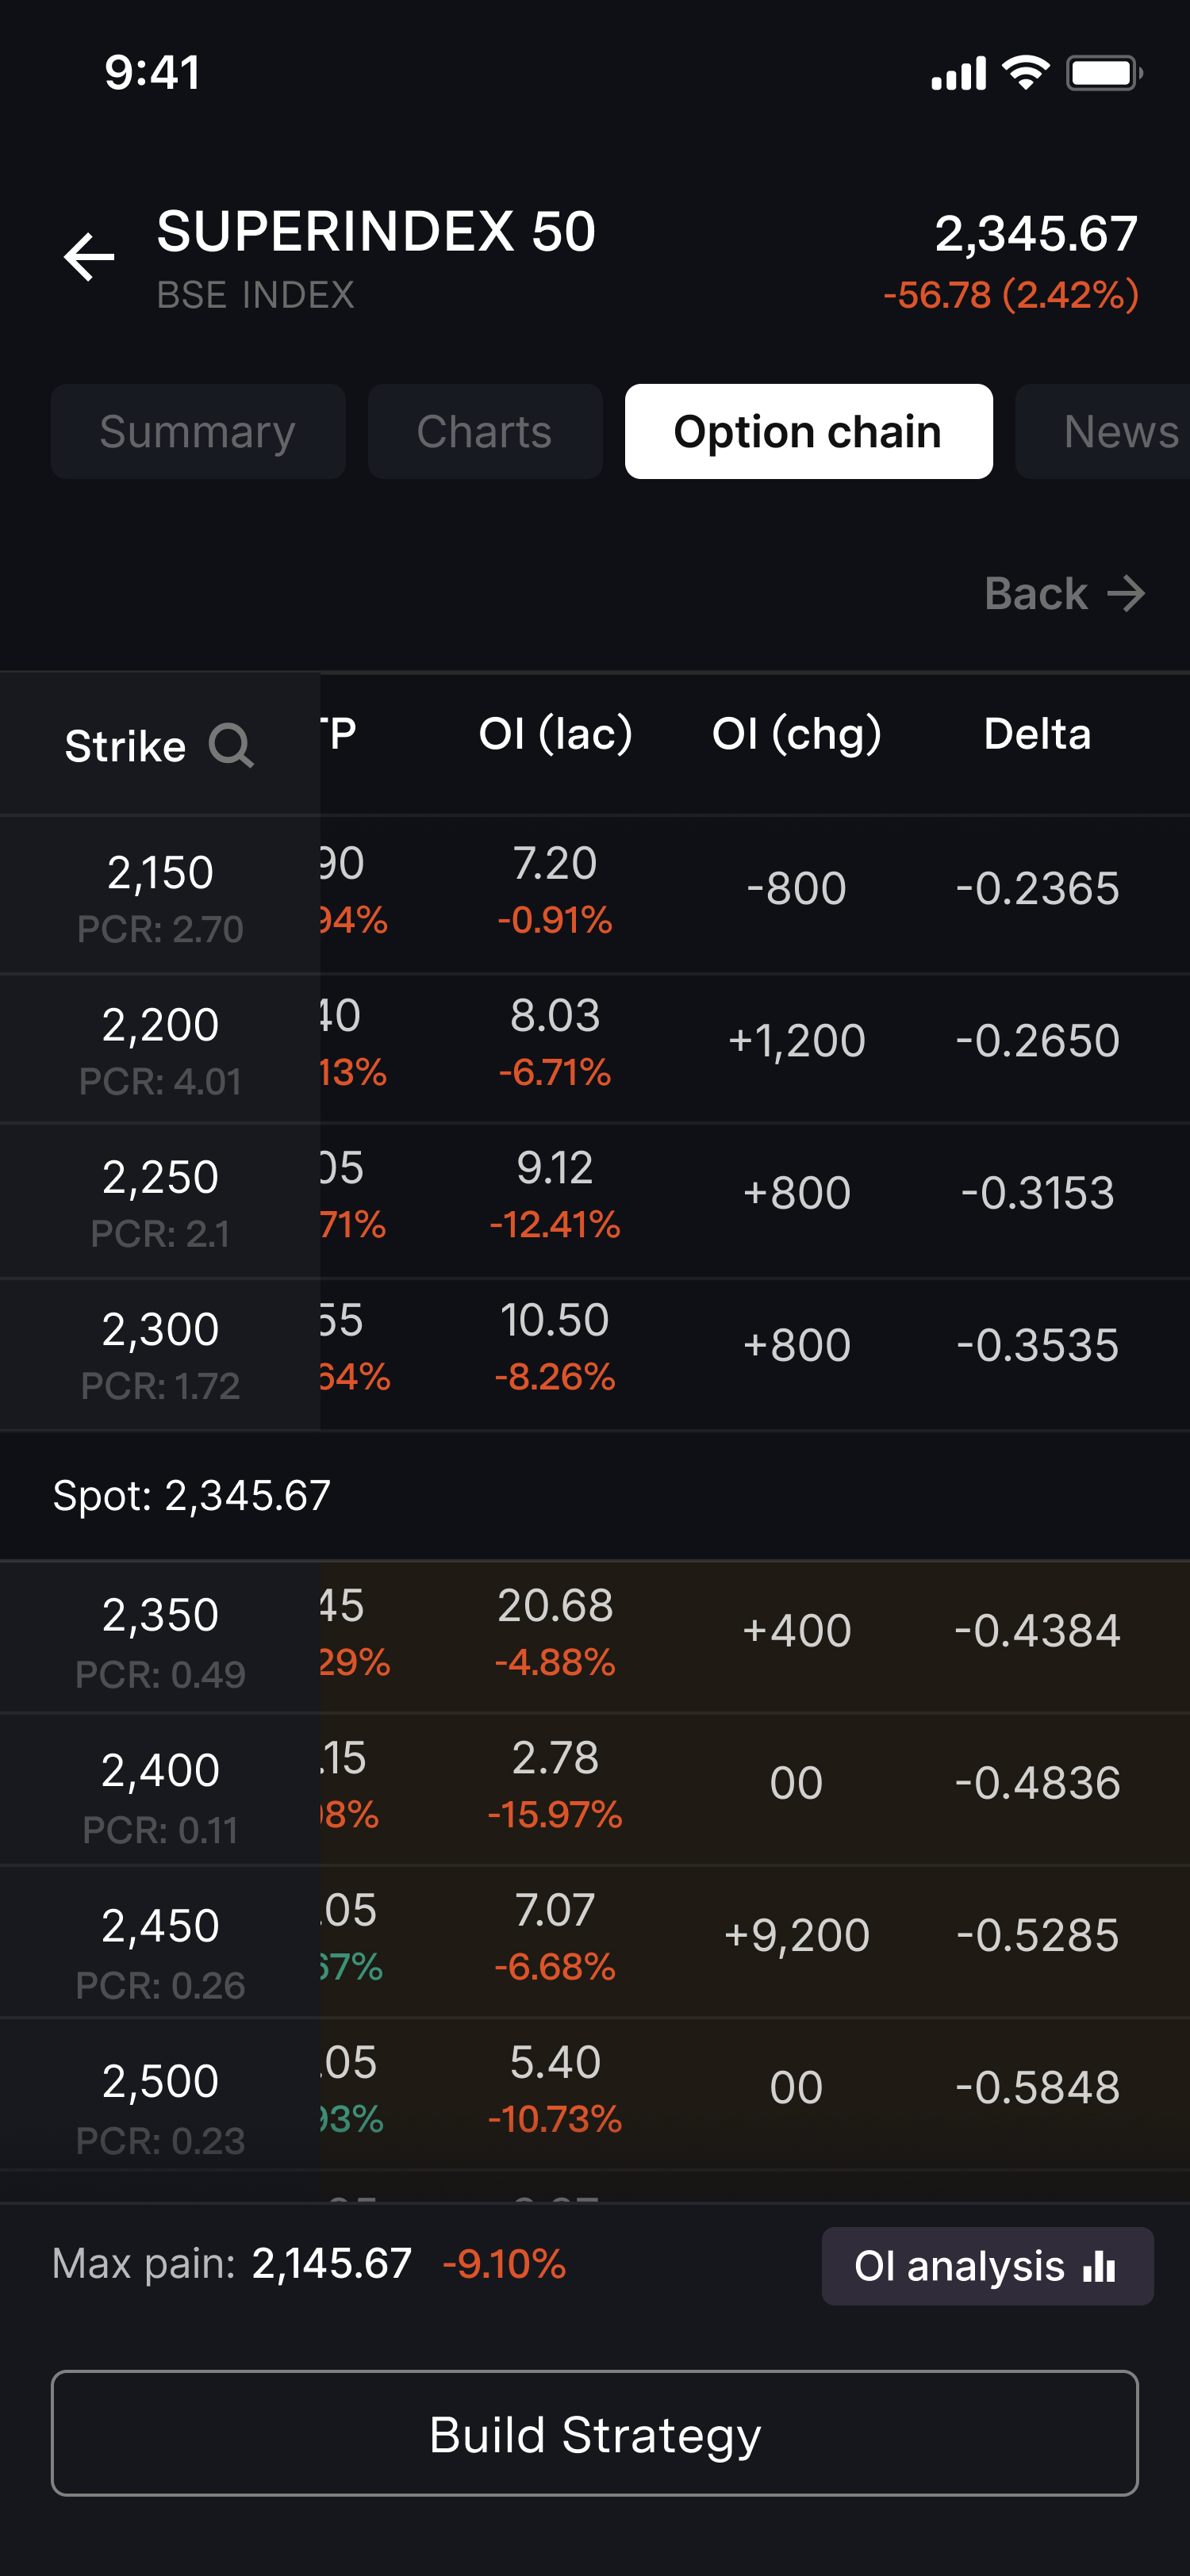
Strategise Better
Build up to 8-leg strategies with Option Chain and pre-defined Target/Stop-loss
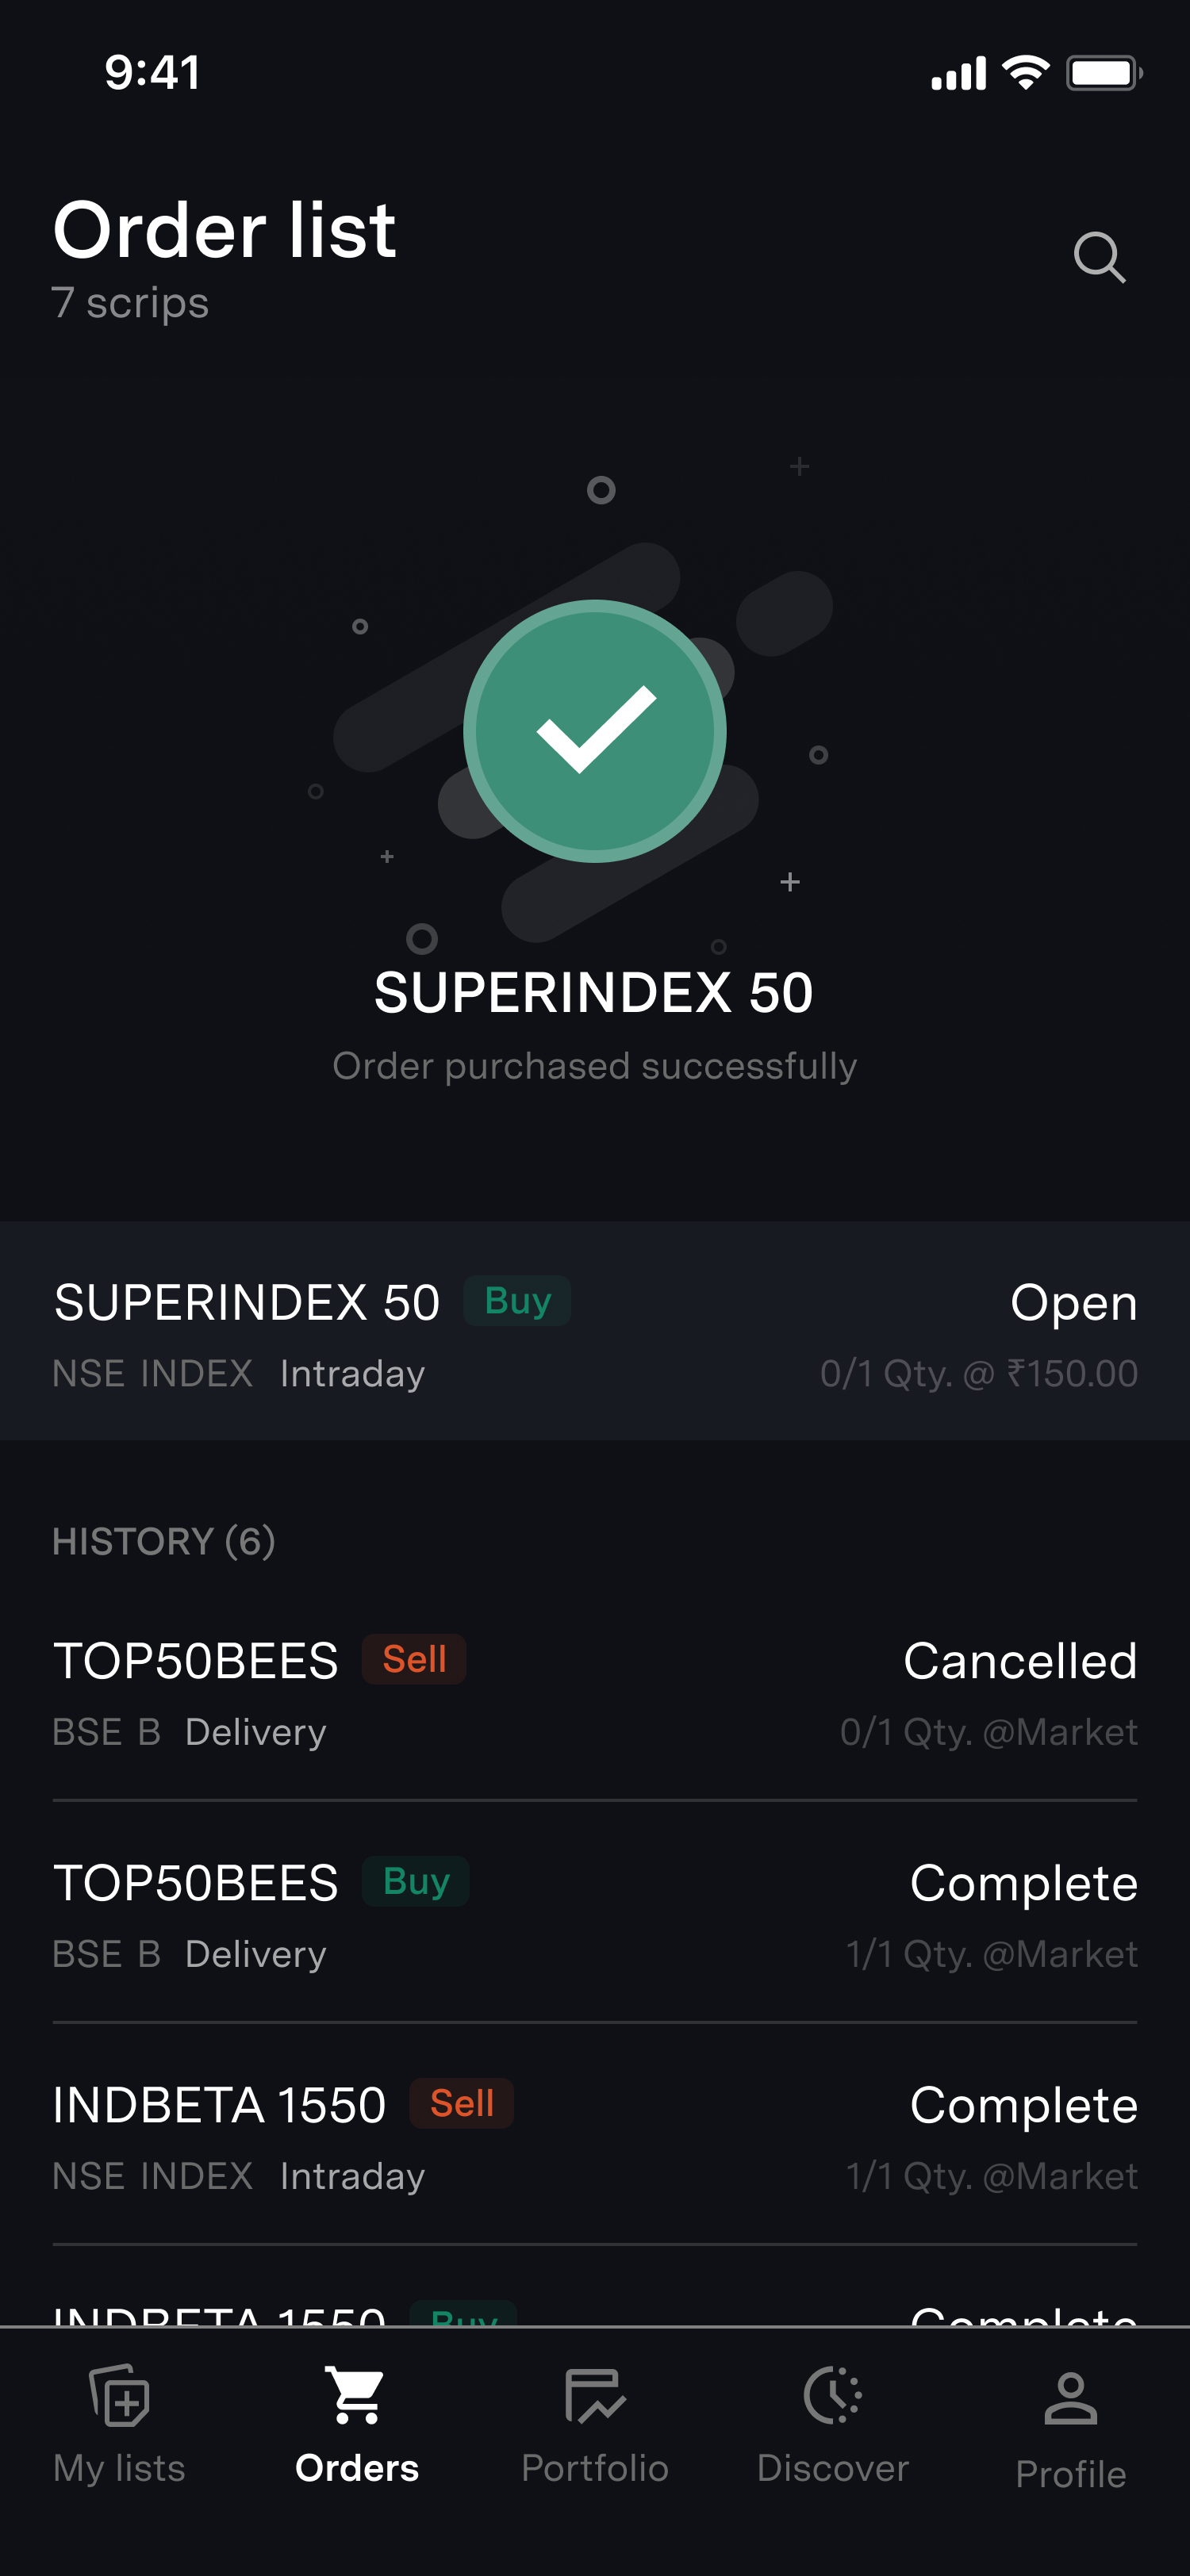
Execute Faster
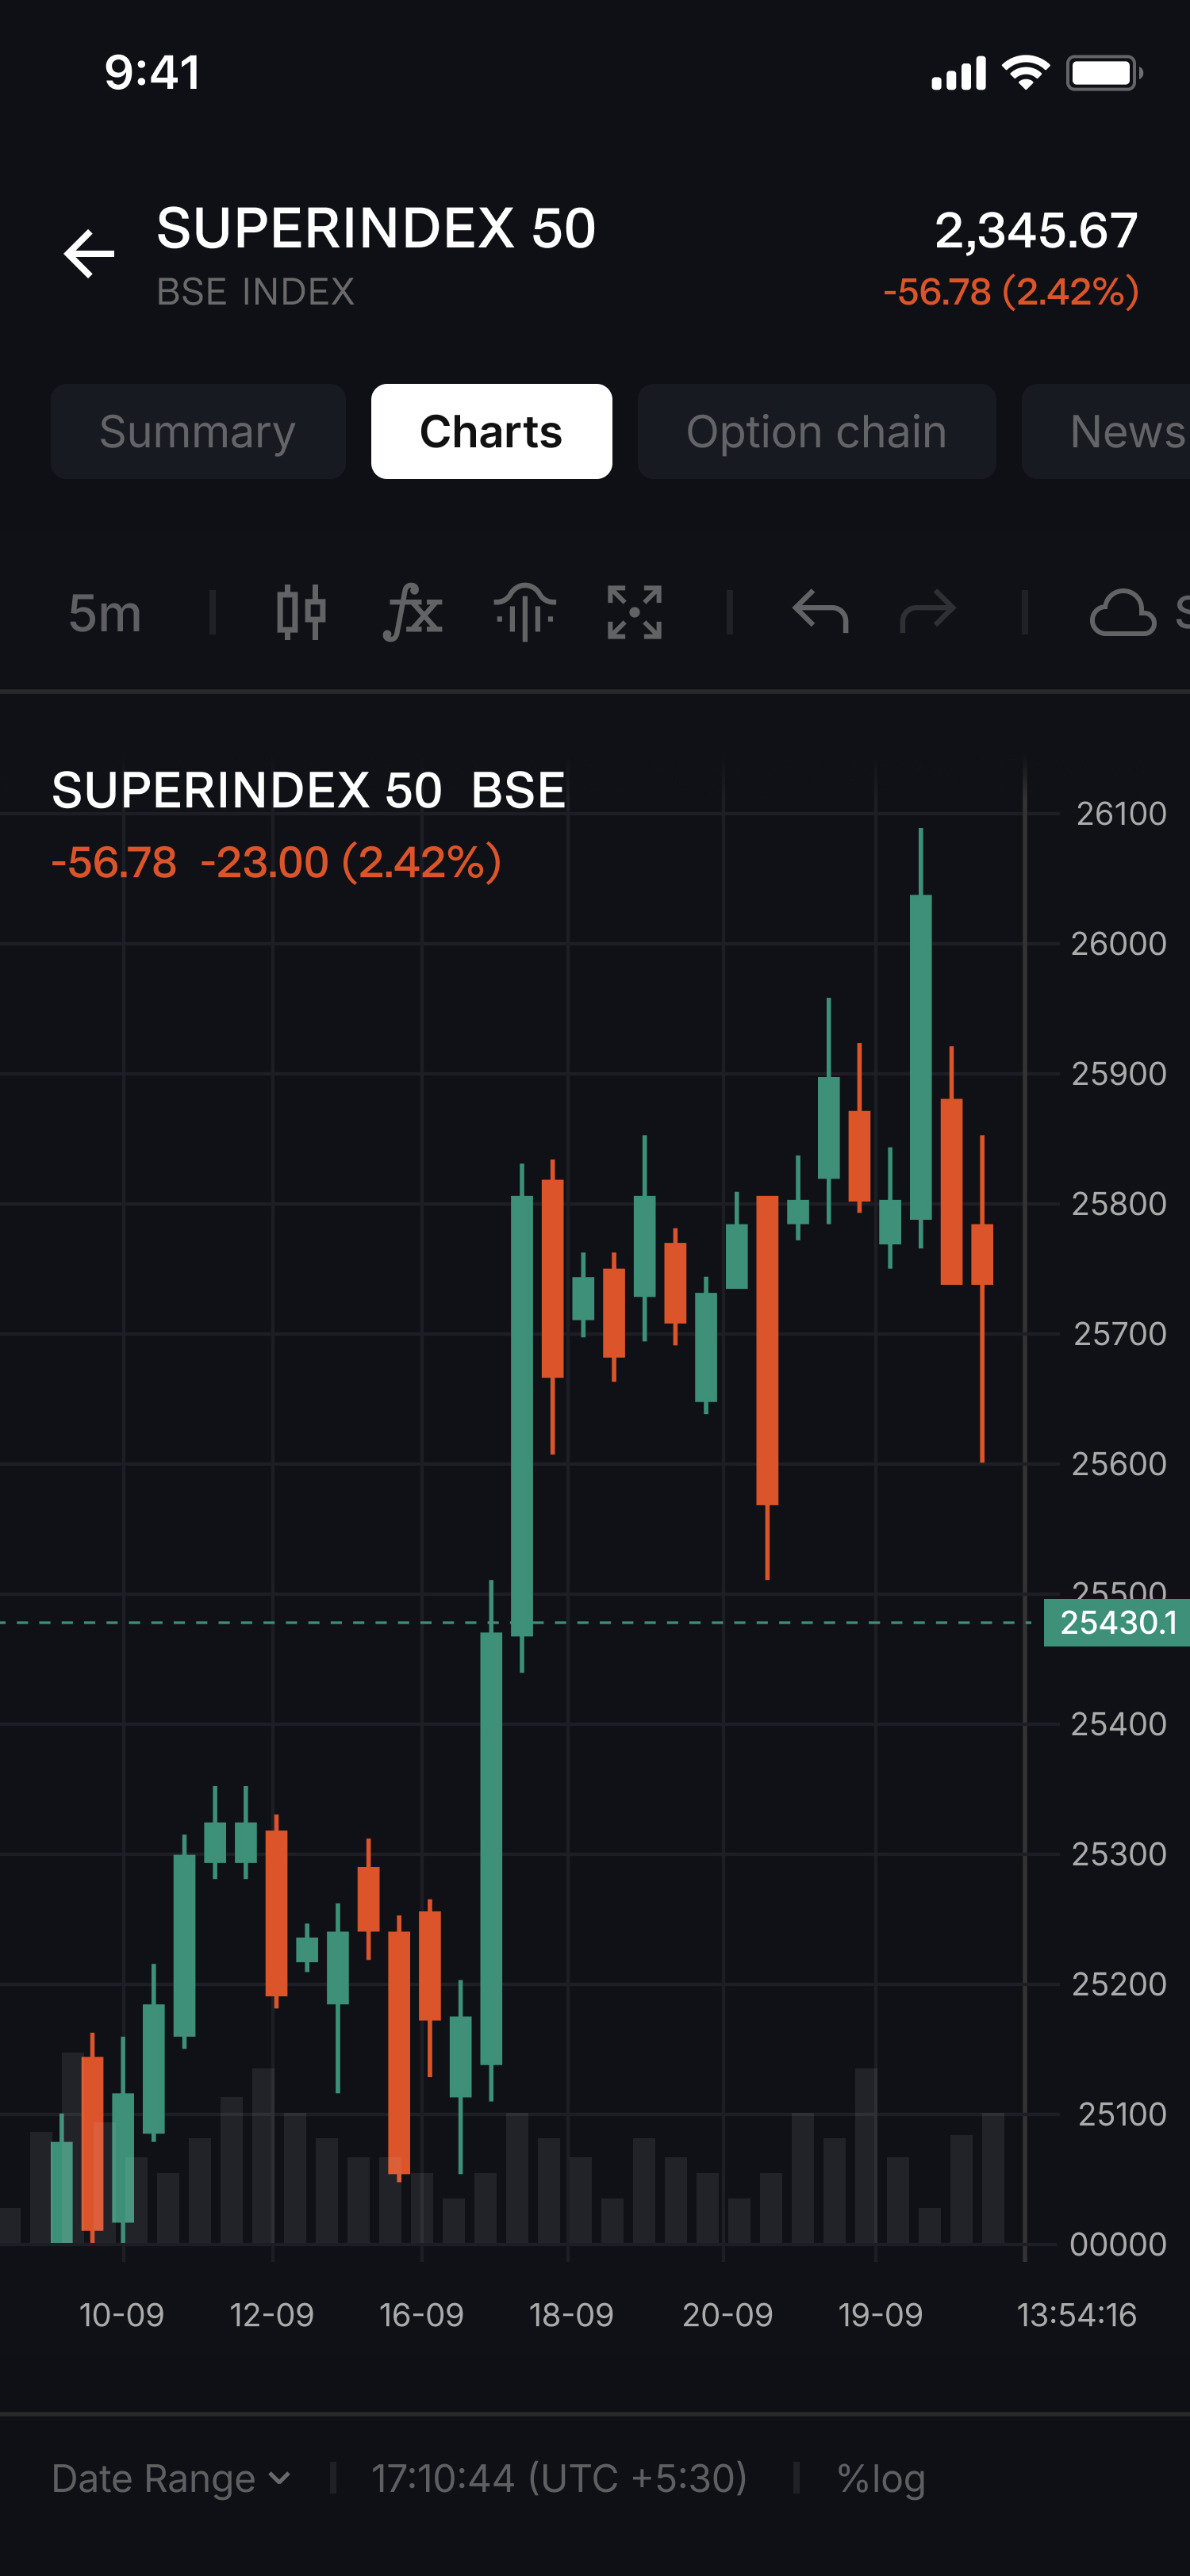
Spot key support/resistance levels using 100+ indicators, OI on charts, & 1-30s timeframes
BUILT FOR SUPERIOR CONTROL
Chart 360  is for both mobile & desktop
From big-screen analysis to on-the-go execution, Chart 360 keeps your trades and charts in-sync across devices


Walkthrough
Watch it in action

Testimonials
What our users
have to say

FAQs
How do I trade directly from the charts?
On the index chart, tap on the chart's Y-axis to select different strike prices. The Call and Put Options will pop up for that strike price. Choose the one you want to trade and whether to buy or sell. Enter the desired quantity and choose between Market/Limit order. The CE/PE chart will pop up to set the limit price, target, and stop-loss at your desired levels.
How do you open the Call/Put Option chart from the underlying chart?
Select the strike price on the Y-axis of the underlying chart. You will see the Call and Put buttons. Once you tap on any one of these, you will see the ‘chart icon’ to open the respective chart.
What tools are available to analyse the charts?
Apart from the usual indicators like SuperTrend, RSI, Net Volume, etc, we have added Open Interest for different strike prices directly on Chart360. This gives you clarity about buying and selling interest directly on the charts. You can also visualise your trading strategies with advanced drawing tools like lines, shapes and Fibonacci retracement levels.
How to set or modify Target and Stop Loss levels?
Once you select the Put or Call Option you want to trade in, tap the ‘add TG’ and ‘add SL’ buttons to add Target and Stop-loss. The CE/PE chart will pop up and you can scroll to set the desired levels or enter it manually. These are placed as GTT orders. To make edits to your Target/Stop-loss levels, tap on your positions on the charts. You can then make adjustments as required.
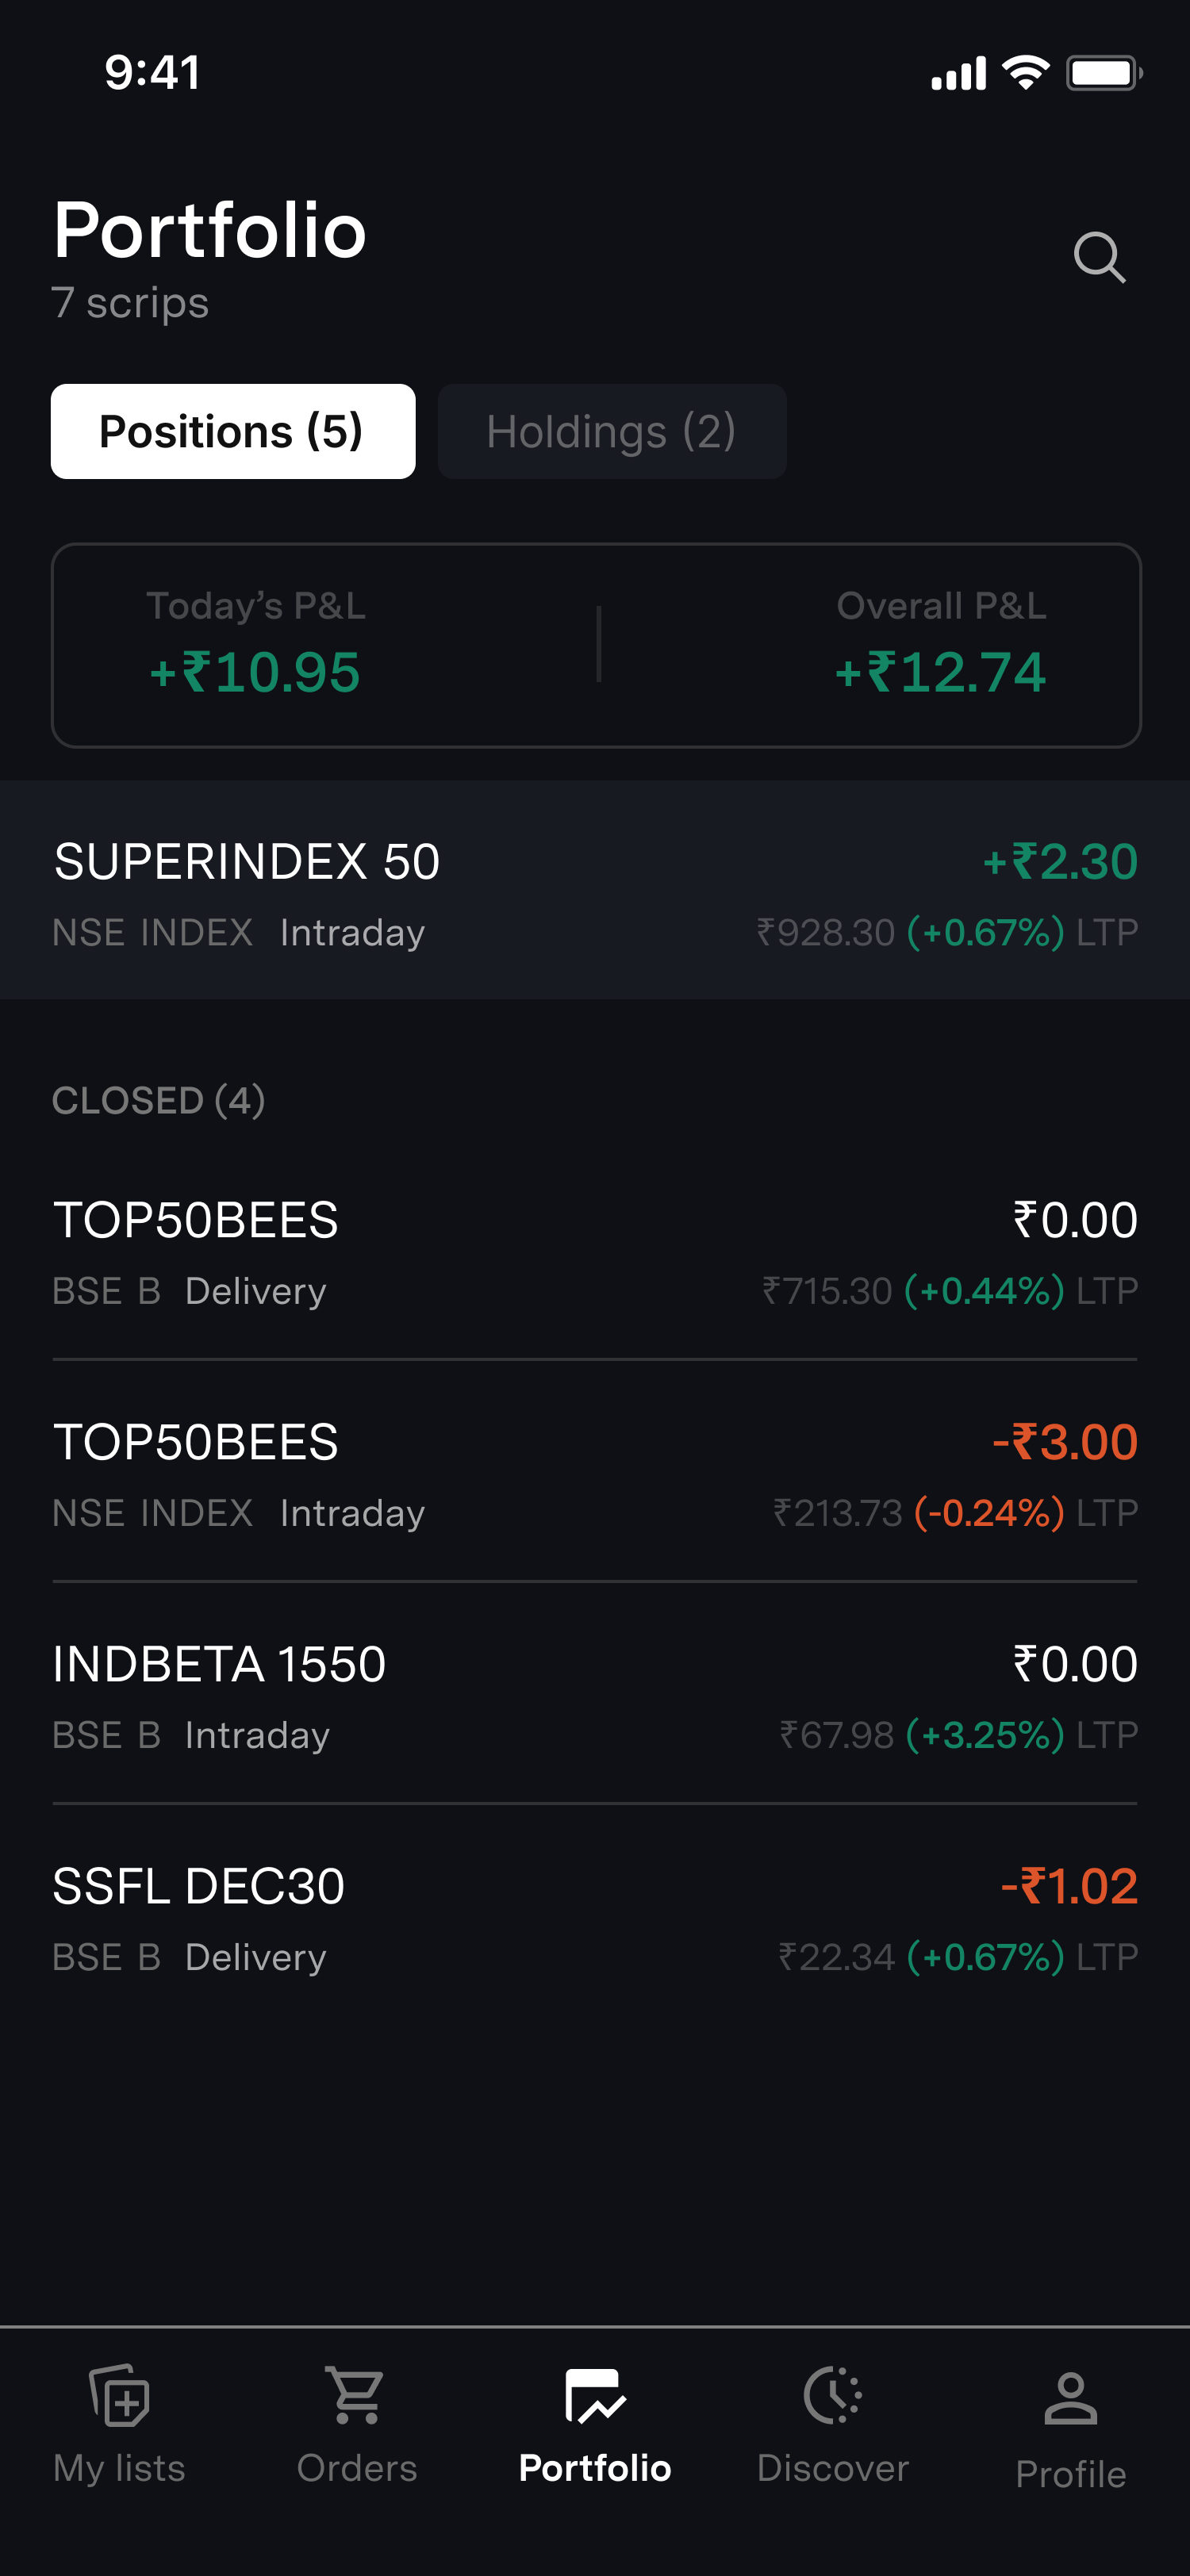
How to monitor real-time Profit & Loss in Chart360?
You can monitor your P&L in real time in 3 ways: - On the Underlying chart: Select the strike price and the P&L will be visible on the Y-axis. - On the CE/PE chart: You can view the number of open lots and the P&L here too. - Under the positions tab: You can view the full summary of your P&L here.
How do I exit a trade in Chart360?
Exiting trades can be done from multiple places in Chart360. You can either exit from the underlying chart, Strike price chart or the position summary tab. You can either exit the whole position or partially as well. To exit from the charts, click on the P&L level on the Y-axis and swipe up/down to exit partially or completely. To exit from the summary tab, swipe left to open the options for partial or complete exit.

Start trading with Upstox Pro
By signing up, you agree to receive transaction updates from Upstox.