Upstox Originals
Themes of tomorrow: AI, Data centres, semiconductors, renewables, and EVs
.png)
11 min read | Updated on December 26, 2024, 17:38 IST
SUMMARY
As 2024 draws to a close, we discuss the theme of tomorrow, which will take centre stage in the next decade. The coming years hold immense potential as key themes of technological innovation drive transformation across industries. Let us explore the factors shaping the growth of five critical domains: Artificial Intelligence, Data centres, Semiconductors, Electric vehicles (EVs), and Renewables, which could collectively form the foundation of a smarter and more sustainable future.

Exploring some of the key themes of the future which investors should monitor
Next time, you ask ChatGPT to make your life simpler, realise that you are using:
- AI technology of course, which helps ChatGPT answer your questions like an expert.
- GPU chips (semiconductors) which are the brains behind this AI.
- Data centres that store your chats, helping ChatGPT learn and improve
- A ton of processing power that consumes massive amounts of energy
As we charge ahead, these breakthroughs aren’t just game-changers for humanity—they’re also must-watch themes for investors. Ready to explore them?
Artificial Intelligence: The next frontier
Imagine telling your home, "I'm feeling cold," and your AI-controlled thermostat automatically adjusts the temperature. This is AI in action—seamlessly integrating into our daily lives.
According to the EY Report, AI would contribute $1.2-1.5 trillion to India’s GDP between FY24-30, increasing India’s GDP growth rate by 1%.
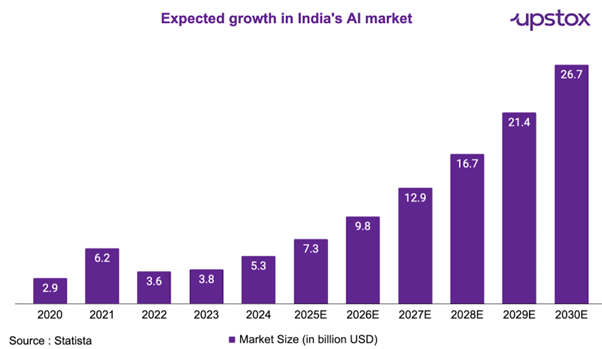
Factors driving AI growth:
- Increased budget allocations: According to Freshworks' AI Workplace report, 79% of organizations plan to increase AI budgets from 2024, with an anticipated 41% rise in spending.
- Increasing adoption: Nearly 70% of companies in India adopted AI in their various operations which is higher than the global average of 49% as per Nasscom.
- Government support: The government launched a ₹10,000 crore India AI mission to build infrastructure and democratise AI.
Key risk: Technologies encompassing and backing AI are fast changing, if companies are not able to adopt these technologies, their products and offerings may become unviable for customers.
The table below lists select opportunities to participate in this growth. Please note, this is not an exhaustive list or a recommendation.
| Particulars | Infosys | HCL Technologies | KPIT Technologies | Tata Elxsi | E2E Networks |
|---|---|---|---|---|---|
| Revenue (₹ crore) | 153,670.0 | 109,913.0 | 4,872.0 | 3,552.0 | 94.4 |
| EBITDA Margin | 24% | 22% | 20% | 29% | 51% |
| ROE | 32% | 23% | 31% | 35% | 36% |
| Debt to Equity | 0.1 | 0.01 | 0.1 | 0.1 | 0.4 |
| PE Ratio | 29.4 | 30.5 | 54.0 | 52.3 | 212.0 |
| 3 Year Sales CAGR % | 15% | 13% | 34% | 25% | 39% |
| 3 Year Profit CAGR % | 10% | 12% | 61% | 29% | 153% |
| 3 Year Stock Price CAGR % | 1% | 15% | 38% | 8% | 273% |
Source: Screener
Data centres: The pillars of digital transformation
Have you ever wondered how Facebook pops up your old memories of years ago or how Google Drive saved your data for the years without any interruption? That is because digital hard disks, called data centres, store data.
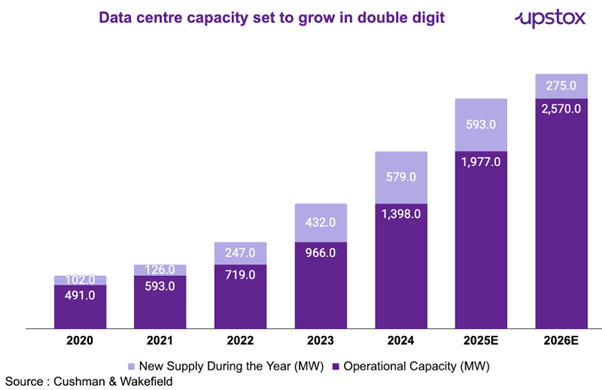
Factors driving data centre growth:
- Government incentives: Programs like the Data Centre Incentivisation Scheme (DCIS) and the establishment of Data Centre Economic Zones (DCEZs) aim to attract investments exceeding $10 billion by 2027.
- Localised data mandates: RBI regulation to store financial data domestically will cause a demand surge
- India accounts for only 3% of global data centre capacity even though it produces 20% of the world's data. Additionally, as per the CareEdge Report, India has the highest mobile data usage worldwide. The 5G rollout demands more DC capacity for increased data and infrastructure needs.
Key risk - The data centre is a heavy capex business. Each MW capacity requires an investment of ~₹50 crore. This is also prone to technological risk as technology is constantly changing. As competition increases, there is also the risk of rental yields falling.
The table below lists select opportunities to participate in this growth. Please note, this is not an exhaustive list or a recommendation.
| Particulars | ABB India | Blue Star | Anant Raj | TCC Concept |
|---|---|---|---|---|
| Revenue (₹ crore) | 10,447.5 | 9,685.8 | 1,483.1 | 77.4 |
| EBITDA Margin % | 14% | 7% | 23% | 44% |
| ROE % | 23% | 22% | 9% | 21% |
| Debt to Equity | 0.0 | 0.1 | 0.1 | 0.0 |
| PE Ratio | 86.0 | 77.7 | 81.4 | 76.0 |
| 3 Year Sales CAGR % | 22% | 31% | 81% | NA |
| 3 Year Profit CAGR % | 93% | 78% | 213% | NA |
| 3 Year Stock Price CAGR % | 46% | 60% | 127% | NA |
Source: Screener
Semiconductors: The digital era’s keystone
Semiconductors power almost every aspect of our digital lives, from smartphones to EVs. India, traditionally a consumer of chips, is striving to become a global player in semiconductor manufacturing.
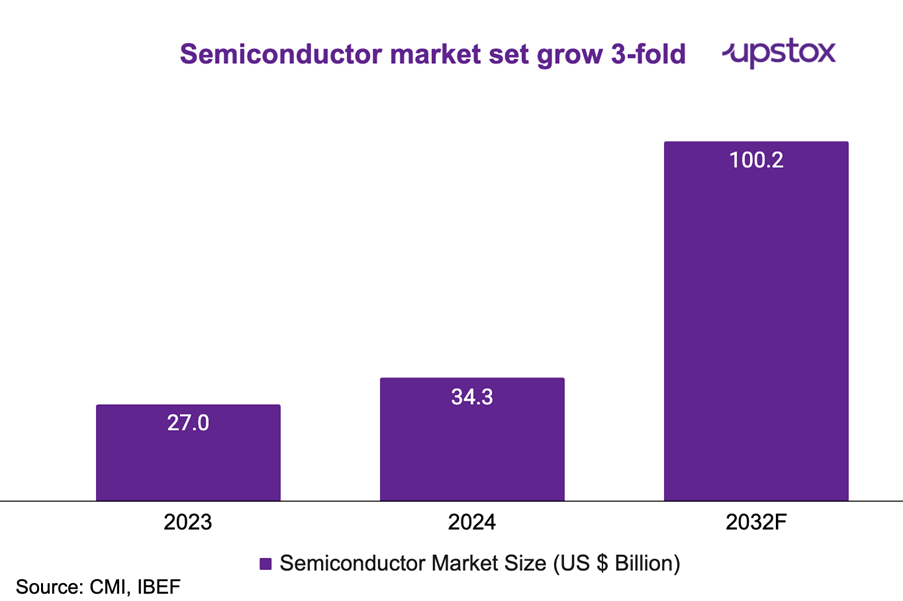
Factors driving semiconductor growth:
- Increasing demand across applications: The Indian semiconductor market is projected to reach $100 billion by 2030, with India’s share growing from 3% to 10%. IoT devices, AI systems, and 5G communication technologies are key drivers.
- Government push: India’s $10 billion Semiconductor Mission aims to establish fabrication facilities.
- Rising consumer electronics market: By 2025, India is expected to be the world’s second-largest smartphone market, driving demand for chips as per IBEF.
- The semiconductor demand will also be driven by aerospace, defence, automobiles, and AI adoption, as these sectors build strong manufacturing capabilities in India.
Key risk - Semiconductor is a complex manufacturing process and is yet to commence in India on a large scale. Any failure of semiconductor chips made in India due to quality issues or technological changes can hamper India’s semiconductor success.
The table below lists select opportunities to participate in this growth. Please note, this is not an exhaustive list or a recommendation.
| Particulars | ABB India | Blue Star | |||
|---|---|---|---|---|---|
| Particulars | Vedanta | HCL Technologies | CG Power & Industries | Moschip Technologies | E2E Networks |
| Revenue (₹ crore) | 143,727.2 | 109,913.4 | 8,046.6 | 294.2 | 94.4 |
| EBITDA Margin | 25% | 22% | 14% | 12% | 51% |
| ROE | 10% | 23% | 58% | 5% | 36% |
| Debt to Equity | 2.1 | 0.0 | 0.0 | 0.3 | 0.4 |
| PE Ratio | 17.4 | 30.5 | 112.0 | 245.0 | 212.0 |
| 3 Year Sales CAGR % | 18% | 13% | 40% | 41% | 39% |
| 3 Year Profit CAGR % | -33% | 12% | 141% | 45% | 153% |
| 3 Year Stock Price CAGR % | 11% | 15% | 60% | 37% | 273% |
Source: Screener
Renewables
What if we tell you that EV, data centres are going to contribute almost 30% of India’s energy demand by FY25, as per Crisil. Now, to keep running these future technologies, India needs energy capacities, from which renewables will derive the most demand. In Chasing the sun, we highlighted India’s aspiration in the solar energy sector, which is expected to be one of the most critical sources of renewable energy source in the future.
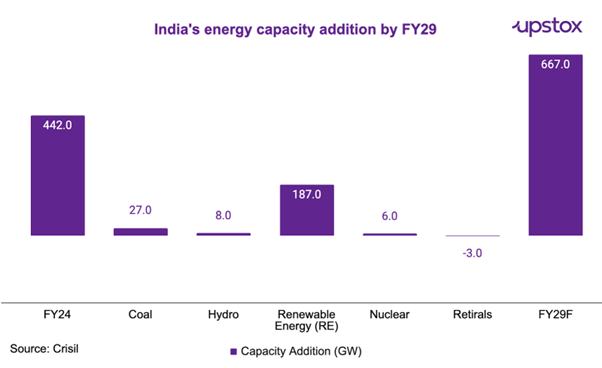
Factors driving growth:
- The government has launched various schemes like PLI for Green Hydrogen, PM Kusum, the development of solar parks, etc. to further foster renewable energy development.
- Renewable capacity is set to double even after aggressive capacity expansion, as the government has set a vision of scaling renewable energy from 200GW to 500GW by 2030.
- Declining solar module prices along with financial support through green bonds (lower interest rates) will make it more viable.
Key risk: Renewable energy projects are capital-intensive with a long gestation period. Besides that, the approval process can be long and tedious, which can further deter interest in this sector.
The table below lists select opportunities to participate in this growth. Please note, this is not an exhaustive list or a recommendation.
| Particulars | |||||
|---|---|---|---|---|---|
| Particulars | Waaree Energies | Premier Energies | NTPC Green | KPI Green | Inox Green Energy |
| Revenue (₹ crore) | 11,398.2 | 3,144.2 | 1,963.5 | 1,024.5 | 224.7 |
| EBITDA Margin | 14% | 15% | 89% | 33% | 33% |
| ROE | 34% | 44% | 6% | 30% | 3% |
| Debt to Equity | 0.2 | 0.0 | 2.2 | 0.0 | 0.1 |
| PE Ratio | 83.6 | 258.0 | 325.0 | 44.5 | 212.0 |
| 3 Year Sales CAGR % | 80% | 65% | NA | 116% | 9% |
| 3 Year Profit CAGR % | 180% | 119% | NA | 94% | 30% |
| 3 Year Stock Price CAGR % | NA | NA | NA | 147% | NA |
Source: Screener
Electric vehicles: Steering the future
Reports indicate that EV owners spend upto 60% less in running costs compared to conventional fuel vehicles! Imagine the savings! Not only are EVs good for the environment, they are great for your wallet too. That’s why EV demand is increasing and set to grow multifold in the coming years.
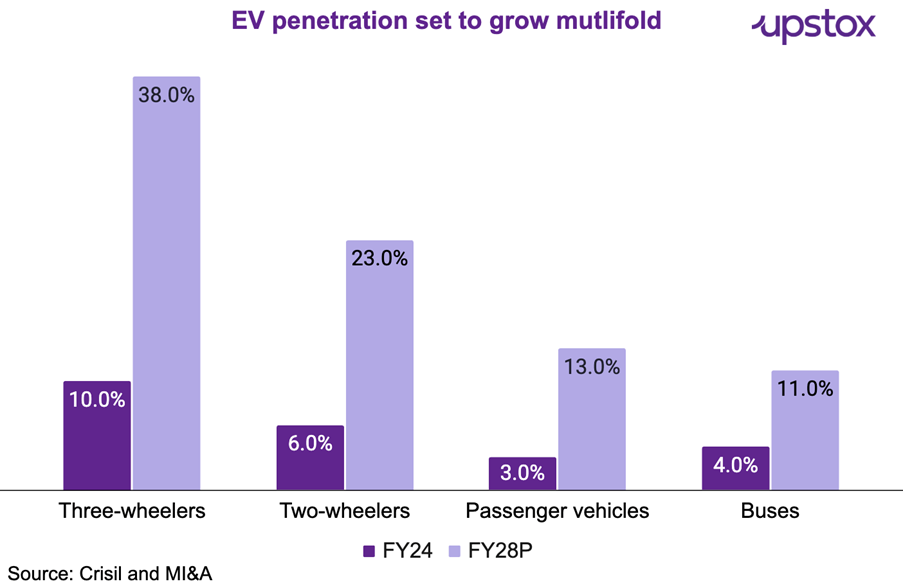
Factors driving EV growth:
-
Economic incentives: Tax on EVs has been kept in the lower bracket of 5% (with no cess) as against the 28% GST rate with cess up to 22% for ICE vehicles.
-
Government boost: The PLI scheme of advanced batteries (₹18,100 crore) and automobile components (₹25,100 crore) is set to fuel the demand for EVs in coming years as battery costs are set to decrease significantly.
Risk: EV manufacturing is also capex heavy, which also faces the risk of falling margins if subsidies of govt are withdrawn along with competition risk.
The table below lists select opportunities to participate in this growth. Please note, this is not an exhaustive list or a recommendation.
| Particulars | ||||||
|---|---|---|---|---|---|---|
| Particulars | Tata Motors | M&M | Motherson Sumi | Ola Electric | JBM Auto | Greaves Cotton |
| Revenue (₹ crore) | 437,928 | 1,01,219 | 8,328.3 | 5,010.0 | 5,009.2 | 2,633.0 |
| EBITDA Margin | 14% | 15% | 12% | -25% | 12% | 3% |
| ROE | 49% | 18% | 42% | NA | 16% | 2% |
| Debt to Equity | 1.1 | 0.0 | 0.2 | 0.5 | 2.1 | 0.1 |
| PE Ratio | 8.0 | 31.2 | 39.4 | NA | 102.0 | NA |
| 3 Year Sales CAGR % | 21% | 23% | 28% | 1,699% | 36% | 21% |
| 3 Year Profit CAGR % | 128% | 80% | 17% | NA | 52% | -11% |
| 3 Year Stock Price CAGR % | 16% | 53% | NA | NA | 57% | 19% |
Source: Screener
What does this mean for investors?
These five themes are not just technological trends but catalysts for a profound transformation of our world. Governments, businesses, and individuals must collaborate to harness their full potential, ensuring a future where innovation drives growth and sustainability.
By signing up you agree to Upstox’s Terms & Conditions
About The Author
Next Story
