Upstox Originals
Correction chaos: Should you continue to SIP or put the cup down?
.png)
8 min read | Updated on February 22, 2025, 11:01 IST


SUMMARY
Markets have been correcting consistently since October 2024, and retail investors are unsure about their next move. We’ve got your back. In this article, we: 1) go back 10 years to analyse returns from 3 major indices - large, mid and small cap to assess chances of losing capital; 2) put the current market fall in perspective versus past correction; and 3) anlayse what it would mean to stop SIP investing at times like these.

Stopping your SIP returns intermittently can impact your overall returns
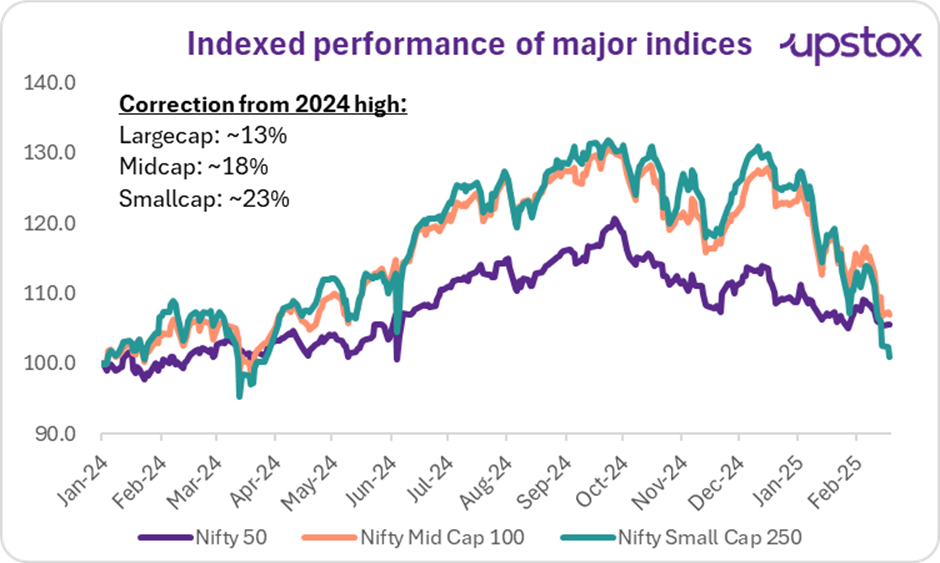
Source: NSE; *Data as of Feb 18, 2025
Don't worry, we've got your back. This article dives into what happens to your returns if you stop your SIP during a market downturn by looking at past market trends.
First, case for long-term investing
Let us put your minds to the rest. We have calculated the daily rolling returns in three major indices - Nifty 50, Nifty Midcap 100 and Nifty Smallcap 250. The table below shows the for 5 or 10 year time horizons going back to February 2015.
As seen below, if you had an investment horizon of 10 years, in any of these indices, you have seldom lost money. To emphasise this further, our analysis includes the periods of December 2019 - April 2020, when the broader markets corrected between 20% - 40% due to COVID-19.
That said, investments with a 5-year horizon do face some risk of capital loss. However, it is important to note that equity markets are not well suited for short-term horizons. To generate adequate risk adjusted returns in equities, regardless of market capitalisation, an investor must have a long-term horizon.
Daily rolling returns across market indices - 10 years
| Nifty 50 | Nifty midcap 100 | Nifty small cap 250 | |
|---|---|---|---|
| # Times returns were < 0% (% of total) | 0.0% | 0.0% | 0.0% |
| # Times returns were < 5% (% of total) | 0.4% | 1.2% | 6.4% |
| # Times returns were < 10% (% of total) | 39.0% | 15.7% | 33.8% |
Source: NSE, Internal research; Data till Feb 14, 2025
Daily rolling returns across market indices - 5 years
| Nifty 50 | Nifty midcap 100 | Nifty small cap 250 | |
|---|---|---|---|
| # Times returns were < 0% (% of total) | 0.4% | 1.3% | 3.3% |
| # Times returns were < 5% (% of total) | 3.8% | 5.3% | 14.3% |
| # Times returns were < 10% (% of total) | 27.7% | 26.8% | 36.8% |
Source: NSE, Internal research; Data till Feb 14, 2025
So, now that we have provided some comfort, let us provide some more larger picture view to put the current correction into context.
In the three tables below, we show corrections across each of these indices. For the largecap Nifty 50 index, we look at corrections equal to or more than 10% and for the mid and smallcap index, both of whoem are more volatile, we look at corrections of 15% or more
Here is what we note, the recent correction in each of these indices, is currently in line with the past average (ex COVID-19). The current drawdown is nothing we have not seen or overcome in the past.
- Nifty50 correction: In the past 10 years, we have had at least 9 corrections of 10% or more, basically an average of 1 correction per year.
| Period | Correction |
|---|---|
| Mar 15- Feb 16 | -22.0% |
| Sep 16 - Dec 16 | -10.0% |
| Sep 18- Oct 18 | -12.0% |
| Jun 19 - Sep 19 | -10.0% |
| Jan 20- Apr 20 | -29.5% |
| Oct 21- Dec 21 | -10.8% |
| Jan 22 - Mar 22 | -12.4% |
| Apr 22 - Jun 22 | -14.5% |
| Oct 24-Feb 25 | -13.0% |
| Average | -14.9% |
| Average ex COVID-19 | -13.1% |
Source: NSE, Internal research; Data till Feb 18, 2025
- Nifty Midcap 100 corrections: Over the past 10 years, markets have seen atleast 7 such corrections.
| Period | Correction |
|---|---|
| Aug 15-Feb 16 | -16.2% |
| Jan 18 - Oct 18 | -25.6% |
| Apr 19 - Aug 19 | -16.1% |
| Feb 20 - Apr 20 | -39.5% |
| Nov 21 - Mar 22 | -16.5% |
| Apr 22 - Jun 22 | -19.5% |
| Oct 24-Feb 25 | -18.0% |
| Average | -21.6% |
| Average ex COVID-19 | -18.7% |
Source: NSE, Internal research; Data till Feb 18, 2025
- Nifty Smallcap 250 corrections: Similar to the midcap index, the smallcap index has also seen atleast 7 such corrections.
| Period | Correction |
|---|---|
| Dec 15-Feb 16 | -20.7% |
| Jan 18- Oct 18 | -35.9% |
| May 19 - Aug 19 | -21.0% |
| Feb 20 - Apr 20 | -42.8% |
| Jan 22- Feb 22 | -19.3% |
| Apr 22 - Jun 22 | -22.3% |
| Oct 24-Feb 25 | -23.0% |
| Average | -26.4% |
| Average ex COVID-19 | -23.7% |
Source: NSE, Internal research; Data till Feb 18, 2025
SIP returns outcome
Finally, coming to SIPs. In the last 10 years, if you had invested ₹10,000 on the 5th of every month, your total investment would be around ₹12.2 lakh. In the table below, we look at 3 cases - what are the returns (XIRR) you would have generated if:
- You continued your SIP throughout with no interruptions
- Stopped your SIP during the (worst) 12 months prior to the COVID-19 fall
- Stopped your SIP in the year post the COVID-19 fall, basically for the (best) 12 months from May 2020, when each of these indices rallied significantly.
Scenario Analysis: SIP XIRR performance over the past 10 years
| SIP Scenarios | Nifty 50 | Nifty midcap 100 | Nifty small cap 250 |
|---|---|---|---|
| Case 1 (consistent SIP) | 13.0% | 18.7% | 17.8% |
| Case 2 (stopped during worst period) | 12.8% | 18.0% | 17.0% |
| Case 3 (stopped during best year) | 12.7% | 17.9% | 16.9% |
Source: NSE, internal research; Note: worst period for all indices: Apr 19-Mar 20; best period for all indices: May 20-Apr 21
As seen in the table above, returns across each of these indices do not meaningfully change in either of the cases. Returns are the highest when the investment is consistent.
One could argue that, if returns dont change meaningfully, why not stop your SIPs during challenging times?
The key reason is that stopping SIPs reduces the total investment amount. As a result, even if the return percentage remains similar, the absolute gains will be lower. Staying invested ensures you maximise both your investment and overall returns.
How have SIPs performed in other major corrections
WhiteOak Capital conducted a study to understand the effects of investing at the peak and trough of market cycles. Their approach was:
Imagine you started a monthly SIP of ₹10,000 in BSE Sensex TRI in January 2008, right at the market peak. By December 31, 2024, you would have invested ₹20.4 lakh, and your investment would be worth ₹72.1 lakh, yielding an XIRR of 13.5%. Now, if someone else began the same SIP in March 2009, at the market bottom, they would have invested ₹19 lakh by the end of 2024 (₹1.4 lakh less than you). Their investment would be valued at ₹61.7 lakh (₹10.5 lakh less than yours), with an XIRR of 13.6%.
Similarly, analysis for other major falls can also be seen below.
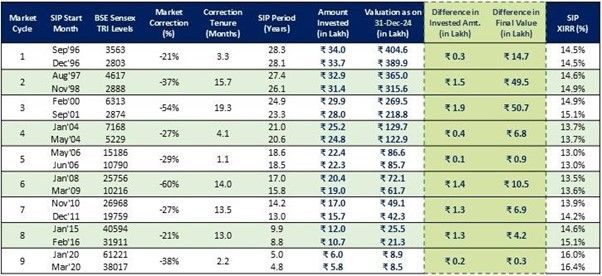
Source: Whiteoakamc
Their findings confirm what we've already discussed—staying invested is the best strategy. They analysed various time periods and discovered that, despite market fluctuations, SIP investments consistently yield steady returns over the long term.
A key takeaway from their study is that SIP returns tend to converge over time, regardless of when you start investing. Even if you begin at market highs, the long-term compounding effect smoothens out volatility. Waiting for the 'perfect' time to invest is far costlier than any potential gains from timing the market correctly.
In summary
The most important lesson is that staying invested in the markets for longer will increase returns more than trying to strategise the best time to invest. It all goes back to the popular quote ‘Time in the market is more important than timing the market’.
About The Author
Next Story


