Upstox Originals
IPO 2024 flashback: India’s 2024 wins and 2025 concerns
.png)
7 min read | Updated on January 02, 2025, 16:09 IST
SUMMARY
2024 was one of the strongest years for IPOs in India. India accounted for ~25% of all global IPOs. In this article, we take a closer look at the IPO trends of 2024 and India’s position on the global stage. As we transition into 2025, is the market narrative shifting? While 2024 brought a wave of opportunities, could 2025 might demand a more cautious approach? Let’s dive in!

India accounted for more than 25% of all global IPOs in 2024
Despite challenges such as economic uncertainties and geopolitical tensions in 2024, the IPO market regained momentum. Among global players, India emerged as a dominant force in 2024, showcasing resilience, diversity, and growth. Let’s analyse how India’s IPO market compares to the global market trends in volume, value, returns, and other key factors.
IPO volume: India takes the lead
India stood out as a global leader in IPO activity by volume, launching 327 IPOs in 2024 (as of December 9, 2024). This achievement placed India ahead of the United States, which saw 183 IPOs, and far above Europe. India accounted for over 25% of all IPOs globally, reflecting its dynamic market and strong economic growth.
IPO data by country in 2024
| Country | IPO number | % of total | IPO value ($ billion) | % of total |
|---|---|---|---|---|
| India | 327 | 26.9 | 19.9 | 16.4 |
| United States | 183 | 15.1 | 32.8 | 27.1 |
| Europe excl. UK | 115 | 9.5 | 18.2 | 15.0 |
| China | 98 | 8.1 | 8.9 | 7.3 |
| Japan | 84 | 6.9 | 6.2 | 5.1 |
| South Korea | 75 | 6.2 | 2.9 | 2.4 |
| Hong Kong | 64 | 5.3 | 10.7 | 8.8 |
| Malaysia | 49 | 4.0 | 1.7 | 1.4 |
| Saudi Arabia | 42 | 3.5 | 4.3 | 3.5 |
| United Kingdom | 10 | 0.8 | 0.9 | 0.7 |
| Others | 168 | 13.8 | 14.7 | 12.1 |
| Total | 1,215 | 100.0 | 121.2 | 100.0 |
Source: EY. Data as of December 9, 2024.
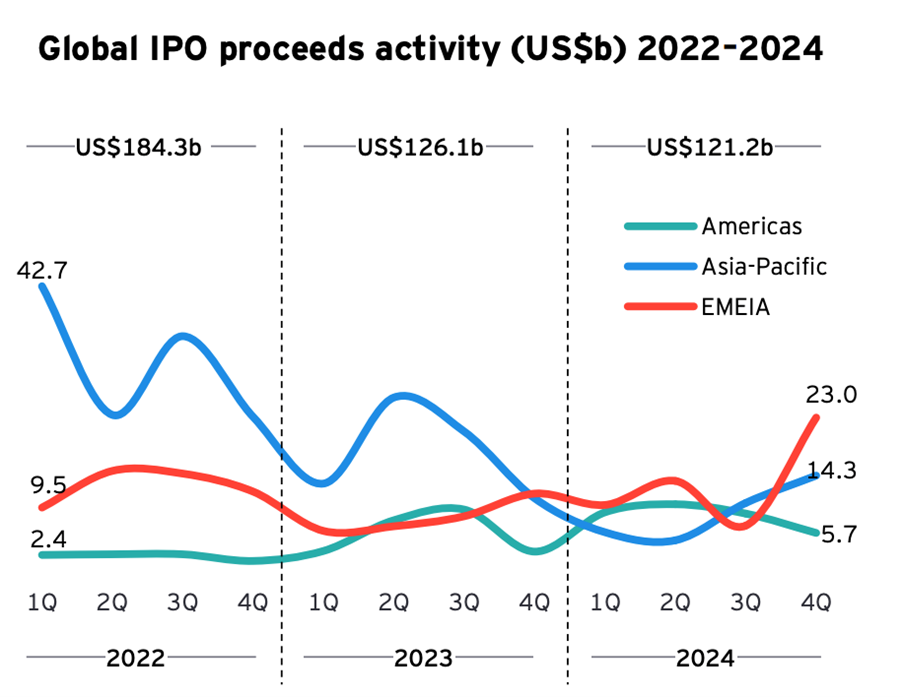
Globally, IPO activity declined, with the total number of IPOs dropping 10% to 1,215. While regions like the Americas and EMEIA (Europe, Middle East, India, and Africa) contributed to the recovery, the Asia-Pacific region experienced a slowdown in early 2024, with some recovery in the latter half.

Source: EY. Data as of December 9, 2024
IPO proceeds: India’s steady contribution
Breaking down India's fundraising activity, we note that it is at an all-time high historically.
Fund mobilisation through public markets (in ₹ billions)
| Year | IPOs | FPOs | OFS | QIPs | Total equity raise |
|---|---|---|---|---|---|
| CY14 | 15 | 5 | 47 | 321 | 388 |
| CY15 | 139 | 0 | 355 | 189 | 683 |
| CY16 | 270 | 0 | 125 | 48 | 443 |
| CY17 | 760 | 0 | 193 | 587 | 1,540 |
| CY18 | 335 | 0 | 132 | 165 | 632 |
| CY19 | 178 | 0 | 264 | 352 | 794 |
| CY20 | 313 | 150 | 215 | 805 | 1,483 |
| CY21 | 1,314 | 0 | 240 | 420 | 1,974 |
| CY22 | 613 | 43 | 112 | 117 | 886 |
| CY23 | 576 | 0 | 189 | 523 | 1,289 |
| CY24YTD | 1,575 | 182 | 304 | 1,292 | 3,353 |
Source: NSE, Bloomberg. Data as of December 9, 2024.
IPO returns: A rewarding year for Indian investors
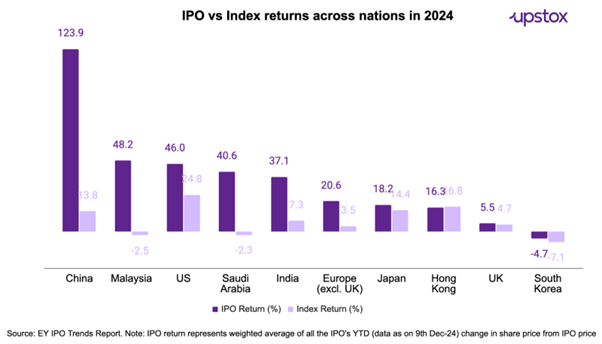
India’s IPO market delivered an average return of 37.1%, outperforming many emerging markets, including Europe (20.6%). These returns were significantly higher than the BSE Sensex, which posted a 7.3% gain in 2024.
Globally, IPO returns varied, with markets like Hong Kong and South Korea underperforming due to local economic challenges. China has been another outlier with strong IPO activity because of various economic and capital market measures which we have discussed in What’s going on in China

Sectoral insights: India’s broad-based rally
India’s IPOs spanned a wide array of sectors, with notable activity in auto, technology, industrials, and consumer goods. The country also saw a rise in IPOs from the steel and infrastructure sectors, driven by domestic demand and policy incentives.
Sectoral contribution in IPO value (in %)
| Sector | CY20 | CY21 | CY22 | CY23 | CY24 YTD |
|---|---|---|---|---|---|
| Automobiles | 0.0 | 6.4 | 1.3 | 4.1 | 20.2 |
| Telecom | 0.0 | 1.1 | 0.1 | 0.1 | 12.8 |
| Retail | 1.7 | 5.3 | 7.1 | 5.1 | 9.4 |
| Capital Goods | 1.0 | 1.5 | 2.2 | 8.9 | 8.5 |
| E-Commerce | 0.0 | 27.9 | 0.1 | 1.6 | 8.2 |
| NBFCs | 33.1 | 9.1 | 7.7 | 11.2 | 6.3 |
| Healthcare | 14.0 | 6.7 | 6.0 | 16.3 | 5.9 |
| Infrastructure | 0.2 | 0.8 | 0.1 | 1.2 | 5.8 |
| Utilities | 0.0 | 5.9 | 0.0 | 0.0 | 5.7 |
| Insurance | 0.0 | 4.9 | 31.3 | 0.0 | 3.4 |
| Consumer | 1.2 | 1.3 | 2.9 | 1.2 | 1.6 |
| Hotels | 0.0 | 0.0 | 0.0 | 2.4 | 1.6 |
| Metals | 0.1 | 0.7 | 0.7 | 1.4 | 1.5 |
| Logistics | 0.0 | 0.0 | 8.0 | 6.6 | 1.1 |
| Technology | 2.9 | 6.6 | 2.4 | 9.0 | 0.7 |
| Chemicals | 1.8 | 6.7 | 18.4 | 0.5 | 0.7 |
| Banks - Private | 33.5 | 1.4 | 1.2 | 1.7 | 0.6 |
| Consumer Durables | 0.0 | 0.3 | 3.4 | 2.7 | 0.6 |
| Real Estate | 9.8 | 5.3 | 1.1 | 7.6 | 0.5 |
| Textiles | 0.0 | 0.8 | 0.0 | 0.2 | 0.2 |
| Media | 0.0 | 0.0 | 0.0 | 0.4 | 0.1 |
| Cement | 0.0 | 3.8 | 0.0 | 0.0 | 0.0 |
| Oil & Gas | 0.0 | 0.0 | 0.0 | 1.9 | 0.0 |
| Others | 0.7 | 3.6 | 5.7 | 16.0 | 4.8 |
Source: NSE, Bloomberg. Data as of 9th Dec-24.
Investor insight: Beware of the boom-bust cycle
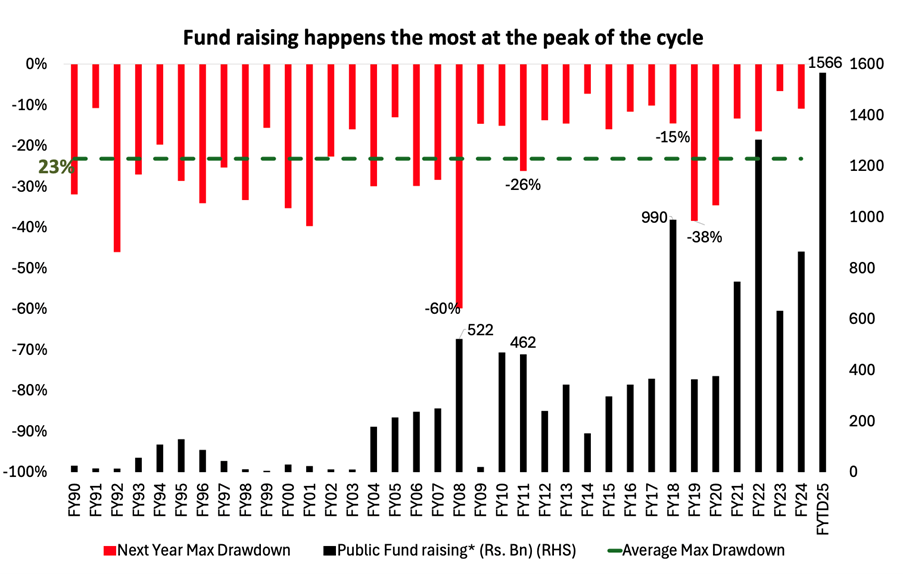
History shows that aggressive fundraising often precedes major market declines, as seen after FY08, FY11, and FY18. Here are some potential reasons:
-
End of market cycles: When markets thrive, investor optimism soars, and IPO activity surges. But this is often a late-cycle phenomenon, with "easy money" chasing companies that may lack strong fundamentals, setting the stage for corrections.
-
Quality concerns: In such periods, Offers for Sale (OFS) dominate, signalling that promoters are cashing out rather than reinvesting, which can be a red flag for investors. Stay vigilant—high fundraising years often mask the risks lurking beneath market euphoria.

Source: DSP MF. Data as of November 2024.
By signing up you agree to Upstox’s Terms & Conditions
About The Author
Next Story
