Upstox Originals
Charting 2024: A year of market resilience

5 min read | Updated on December 31, 2024, 14:54 IST
SUMMARY
After a secular uptrend for most of the year, the Nifty50 has seen resisitnace in the past few months. But what does this mean? Are we on the verge of seeing a sustained downtrend or is this just a temporary fall? What are indicators like the RSI pointing to? Our analysis reveals that the market has some support with signs of a potential intermediate top formation. Read on to find out what is in the charts.

The technical setup indicates the Nifty is confined within a narrow congestion zone, with resistance near 23,860 and support around 23,500
The equity markets have had varied and divergent performances in the past year. Though the Indian Nifty 50 Index has returned a decently positive return on a YTD basis, it has returned a negative return of (-1.0% as of December 30, 2024) over the past six months.
Year-to-date return of global indices
Source: Optuma
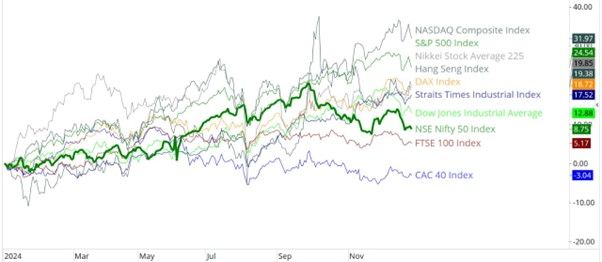
The year-to-date performance of several major global equity indices offers insights into their relative trends and regional market dynamics. The NASDAQ Composite Index leads with a substantial gain of 33.6%, reflecting robust growth in the technology sector and its significant contribution to market leadership. The S&P 500 Index follows with a strong return of 25.9%, showcasing broad-based strength in the U.S. equity market.
Asian markets, represented by the Nikkei Stock Average 225 (21.0%) and Hang Seng Index (19.7%), display a solid performance, highlighting resilience and recovery despite ongoing macroeconomic challenges. The DAX Index and Straits Times Industrial Index report gains of 19.2% and 16.8%, respectively, suggesting selective regional outperformance in Europe and Southeast Asia.
In comparison, the NSE Nifty 50 Index, delivered a modest gain of 9.5%, underperforming many of its global counterparts. This result suggests a more conservative growth trajectory, potentially due to domestic economic factors or sectoral imbalances. The Shanghai Composite Index (14.8%) outpaces the Nifty, reflecting steadier growth in the Chinese market.
Conversely, the FTSE 100 (-5.5%) and CAC 40 (-2.7%) indices exhibit notable underperformance, underscoring challenges in the European region influenced by geopolitical and economic pressures. Overall, the chart highlights diverse equity market outcomes driven by sectoral trends, regional economic environments, and investor sentiment. The comparison with the Nifty underscores the varying pace of equity growth across regions, with Indian markets exhibiting more tempered performance relative to global peers.
Sectoral performance in the domestic markets
Source: Optuma
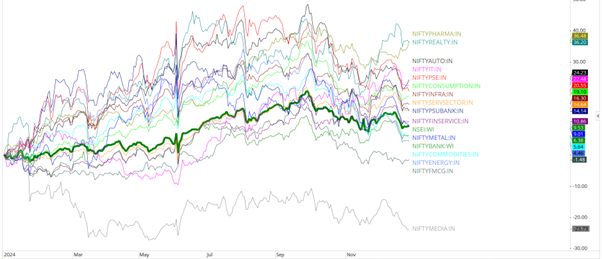
The chart highlights the year-to-date performance of various NSE sectoral indices, illustrating diverse sectoral trends within the Indian equity market. NIFTY Pharma (+36.5%) and NIFTY Realty (+36.2%) emerge as the top-performing sectors, signaling strong momentum in healthcare and real estate. NIFTY Auto (+24.2%) and NIFTY IT (+22.5%) also report notable gains, reflecting growth in the automobile and technology sectors.
In contrast, NIFTY Media (-23.7%) is the significant underperformer, indicating challenges in the media sector. Mid-performing indices like NIFTY Consumption (+20.6%) and NIFTY Infra (+19.1%) indicate stable growth in consumer demand and infrastructure investments. The broader NIFTY 50 index recorded a modest 9.5% gain, showcasing balanced performance.
Important technical developments on the Nifty50 charts
Source: Optuma
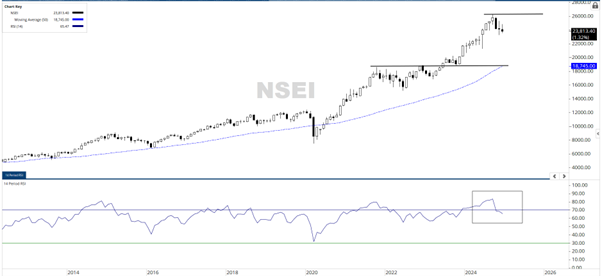
The Nifty charts have exhibited notable technical developments that could influence market behavior in the coming year. The Nifty has maintained a secular uptrend on the long-term monthly chart since the March 2020 lows. Over the 18-month period from March 2023 to September 2024, the index experienced only three negative monthly closings.
However, following the peak at 26,277.35 in September 2024, the Nifty has shown early signs of a potential intermediate top formation.
Additionally, the RSI (Relative Strength Index) has displayed a bearish failure swing. After rising above the overbought 70 level, it fell below, attempted to recover but failed to reclaim the 70 mark, and subsequently declined further, breaching its previous low. This behavior adds weight to the potential emergence of an intermediate top.
Nifty 50 daily candlestick chart
Source: Optuma
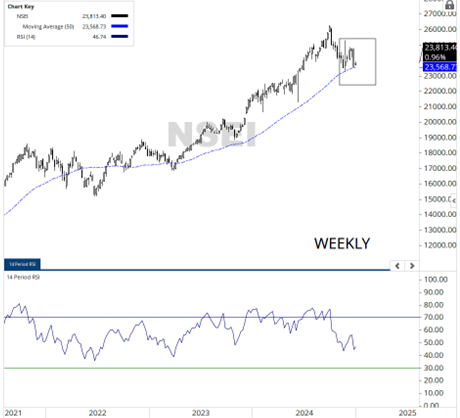
Nifty 50 weekly candlestick chart
Source: Optuma
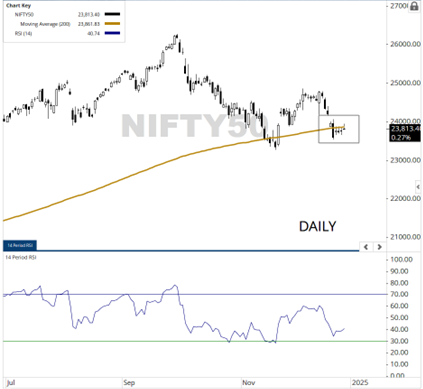
As 2024 nears its close, notable technical developments have been observed on the daily and weekly charts of the Nifty. Following a significant mean reversion between October and November, the Nifty tested its 50-week moving average (MA) at 23,568. It subsequently staged a robust rebound of 1,200 points over the next four weeks, only to lose those gains within a single week. This decline led to a retest of the 50-week MA, highlighting its critical role as a support level.
On the daily chart, the Nifty has closed marginally below the key 200-day moving average (DMA), currently positioned at 23,861. The technical setup indicates that the Nifty is confined within a narrow congestion zone, with resistance near 23,860 and support around 23,500. A decisive trending move is likely to emerge only if the Nifty breaks above the 200-DMA or falls below the 50-week MA.
Conclusion: A Year of resilience and caution
The year 2024 has been marked by a mix of resilience and caution in global and domestic markets. While major indices like the NASDAQ and S&P 500 showcased strong gains, driven by robust sectoral performances, domestic markets like the Nifty demonstrated moderate growth amidst heightened volatility.
Technical developments, such as the emergence of intermediate tops and critical mean reversion phases, highlighted the evolving market dynamics. Key support and resistance levels, coupled with bearish signals from indicators like the RSI, emphasized the need for vigilant market monitoring.
As the year closes, markets remain poised at crucial junctures, with significant levels dictating the trajectory for 2025.
By signing up you agree to Upstox’s Terms & Conditions
About The Author
Next Story
