Upstox Originals
A rough coat: Analysing Q2 performance struggles in India's paint sector
.png)
7 min read | Updated on November 18, 2024, 16:06 IST
SUMMARY
The Q2FY25 results of major paint players highlight the impact of increased competition, reflected in weak volume growth and even weaker value growth. Most of these companies are fundamentally strong but have underperformed the broader markets in the past few years. Does this present an investment opportunity or is the industry still going through some tribulations?
Stock list

The paint industry has reported weak performance in Q2FY25
For the recent Q2FY25, the Indian paint company’s performance was weak. As we show in the table below, revenue growth for most companies has been modest in this quarter, driven by:
-
Demand weakness
-
Increased competition
-
Modest volume growth
-
Inability to take necessary price hikes which has led to weak value growth
-
Unusually extended monsoons and flooding in many key markets
Major paint companies: Trend in revenue performance
| Company (₹ cr) | Q2FY24 | Q1FY25 | Q2FY25 | QoQ(%) | YoY(%) |
|---|---|---|---|---|---|
| Asian Paints | 8,452 | 8,943 | 8,003 | -10.5% | -5.3% |
| Berger | 2,767 | 2,806 | 2,775 | -1.1% | 0.3% |
| Kansai Nerolac Paints | 1,957 | 2,050 | 1,951 | -4.8% | -0.3% |
| Akzo Nobel India | 965 | 1,036 | 991 | -4.3% | 2.7% |
| Indigo Paints | 279 | 294 | 300 | 1.9% | 7.3% |
| Total | 14,420 | 15,130 | 14,020 | -7.3% | -2.8% |
Source: Company filings
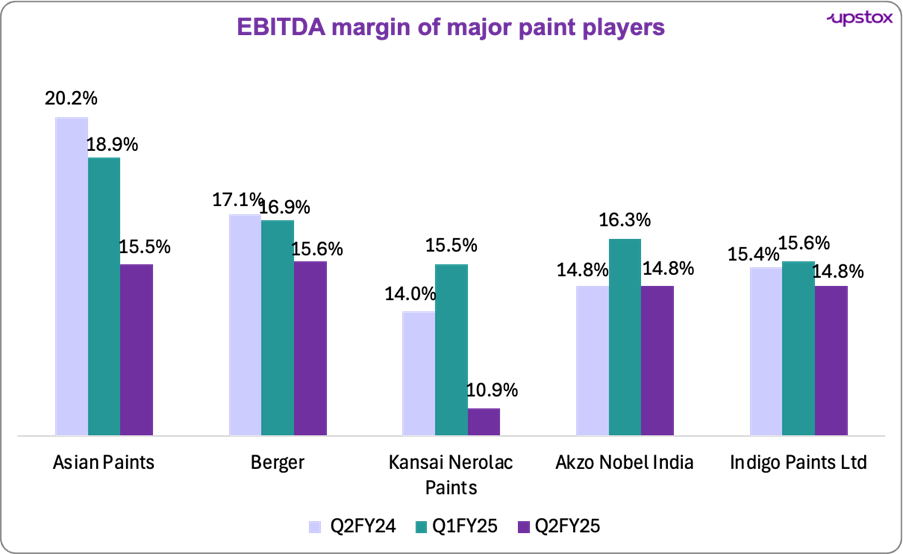
Most companies experienced a decline in their EBITDA both QoQ and YoY. Along with price cuts and weak demand, the increased manpower costs associated with expansion activities, also hurt performance.
Trend in EBITDA performance
| Company (₹ cr) | Q2FY24 | Q1FY25 | Q2FY25 | QoQ(%) | YoY(%) |
|---|---|---|---|---|---|
| Asian Paints | 1,716 | 1,694 | 1,240 | -26.8% | -27.7% |
| Berger | 474 | 522 | 434 | -16.9% | -8.3% |
| Kansai Nerolac Paints | 273 | 330 | 212 | -35.7% | -22.4% |
| Akzo Nobel India | 142 | 169 | 146 | -13.3% | 3.2% |
| Indigo Paints | 42 | 47 | 42 | -12.4% | -1.4% |
| Total | 2,647 | 2,762 | 2,074 | -24.9% | -21.6% |
Source: Company filings

Source: Company filings
The decline contributed heavily to the overall industry trend, where total PAT also saw a sharp decrease. Asian Paints saw the most significant decline in profitability among the paint companies, with a marked reduction in both QoQ and YoY basis.
Profitability trend (PAT)
| Company (₹ cr) | Q2FY24 | Q1FY25 | Q2FY25 | QoQ(%) | YoY(%) |
|---|---|---|---|---|---|
| Asian Paints | 1,232 | 1,187 | 694 | -41.5% | -43.7% |
| Berger | 292 | 354 | 270 | -23.8% | -7.6% |
| Kansai Nerolac Paints | 180 | 225 | 130 | -42.1% | -27.6% |
| Akzo Nobel India | 94 | 115 | 98 | -14.6% | 3.9% |
| Indigo Paints Ltd | 25.3 | 27 | 22 | -15.8% | -11.9% |
| Total | 1,824 | 1,907 | 1,214 | -36.3% | -33.4% |
Source: Company filings
Results - Expectations versus actuals
| Company | Expectation | Actuals |
|---|---|---|
| Asian paints | Expected weak near-term growth demand remains sluggish | Underperformed as per the expectations |
| Berger Paints | An increase in competitive pressures is expected to impact profitability | In line with expectations |
| Indigo Paints | Expected to see a sharp uptick in revenue and PAT | Underperformed as per the expectations |
Source: Press release, news articles
What does the future hold: Management guidance
Asian Paints
- Demand was impacted due to excessive rainfall and a slowdown in consumption
- Expects a double-digit volume growth in FY25, buoyed by the long festive season and rural recovery.
- Launched interior emulsions in the luxury/economy range
Berger Paints
- Expects near-double digit volume growth in Q3FY25 (7-10%) AND Q4FY25 (10%+) aided by urban growth initiatives
- Manpower addition is in place to increase focus in the urban markets
- Management team focused exclusively on urban (Metro, large cities) markets, where it now wants to grow its market share from current 10% to 15% in 2-3 years.
Akzo Nobel India
- Optimistic about achieving high single-digit to double-digit growth in H2FY25 despite external challenges.
- Conducting strategic reviews to strengthen long-term positioning amid competitive pressures.
- Plans to increase advertising and promotional expenditures to enhance market share and brand visibility.
Indigo paints
Cautiously optimistic about industry demand recovery, with expectations of improved rural demand due to favourable monsoon and harvest. Q3FY25 is projected to see margin recovery driven by recent price hikes (~1.5%), favorable raw material prices, and festive/wedding season demand.
Challenges faced due to new players in the industry
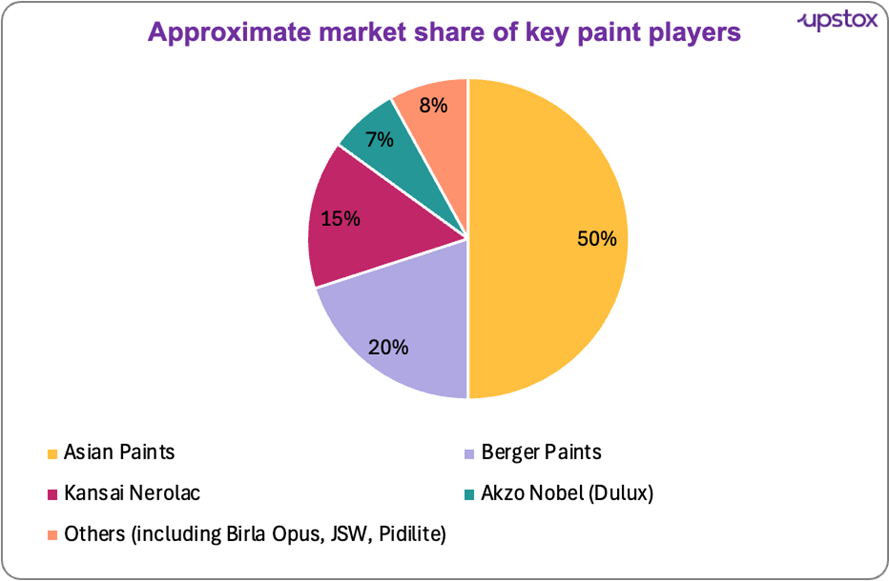
In the chart below, we look at the current approximate market share of the key players.

Source: Press release, news articles
However, this is expected to be impacted by the increased competitive intensity.
JSW Paints, which debuted in 2019, has established itself as a competitor, generating revenue of ₹2,000 crore in FY24. The company expects to grow this to ₹5,000 crore by FY26 by expanding its retailer network and strengthening its presence in both decorative paints and industrial coatings.
The Aditya Birla Group launched Birla Opus in April 2024, with over 80% of its planned 145 products already available. Opus, with over 50,000+ dealers in its first year of operation, is close to pip Berger's 55,000 outlets as it aims to catch up with Asian Paints' extensive network of 160,000 dealers.
Market performance
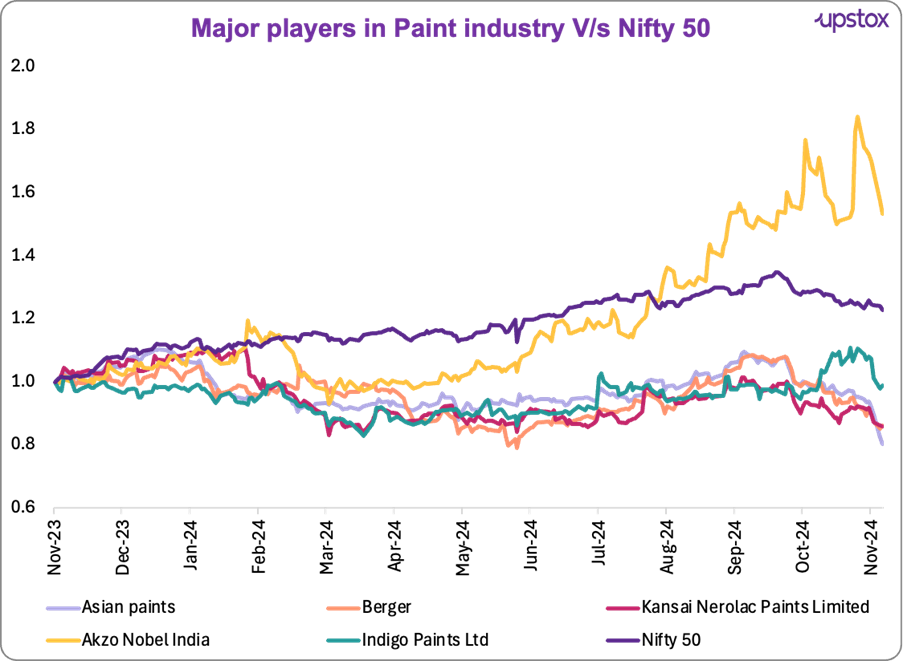
If you exclude the current quarter, most paint players have healthy financials - good profit growth, and strong ROEs. That said, the performance of the majority of the players has been disappointing in the past couple of years. An increase in competitive intensity has adversely impacted the pricing power of most players and impacted margins.
Besides that, relatively high valuations have left little ‘margin of safety’ which has further impacted performance.
With competitive intensity expected to remain high in the medium term, product innovation, and cost measures are some of the key levers to deliver growth. An overall demand recovery will also of course help.

Source: NSE
The table below summarizes the performance of some of the key stocks in the sector over the past 3 years.
| Name | Market Cap (₹ Cr)* | 3Y profit growth (%) (FY21-24) | 3Y stock return (%) (FY21-24) | EV / EBITDA | ROE (%) |
|---|---|---|---|---|---|
| Asian Paints | 2,37,267 | 20 | -8 | 32 | 31 |
| Berger Paints | 57,031 | 18 | -10 | 30 | 24 |
| Kansai Nerolac | 21,168 | 8 | -14 | 20 | 13 |
| Akzo Nobel | 16,772 | 27 | 21 | 24 | 32 |
| Indigo Paints | 7,144 | 28 | -13 | 29 | 18 |
| Shalimar Paints | 867 | -21 | 2 | -18 | -21 |
| Average | 56,708 | 13 | -4 | 19 | 16 |
Source: Screener; *Data as on November 15, 2024
Conclusion
For Q2FY25, revenue and profitability fell across the board. Operating profit margins also dropped, with all companies showing lower growth. Newer players like JSW Paints and Birla Opus are aggressively expanding and capturing market share.
Looking ahead, management teams are optimistic about recovery, especially through urban growth strategies, cost adjustments, and increased marketing efforts. They anticipate some demand growth in the next quarters, especially driven by urban initiatives and rural demand recovery.
By signing up you agree to Upstox’s Terms & Conditions
About The Author
Next Story
