Personal Finance News
Why this is the time to drink stocks SIP by SIP
 (1) (3).jpg)
6 min read | Updated on January 15, 2025, 15:42 IST
SUMMARY
The basic idea behind using the SIP route to invest in stocks is to bring cost averaging into play. It ensures that an investor keeps purchasing units of equity MFs even when stock prices drop, allowing them to acquire more MF units at lower prices, which can prove advantageous when stock prices eventually recover.

Investors who have been stopping their SIPs in the last few months are missing out on cost averaging. Representational image
Over the last few years, the systematic investment plans (SIPs) of mutual funds (MFs) have been a genuine success story. SIP is a way of investing a fixed amount of money into an MF at regular intervals, usually a month. This money is typically invested in an equity MF which in turn largely buys stocks.
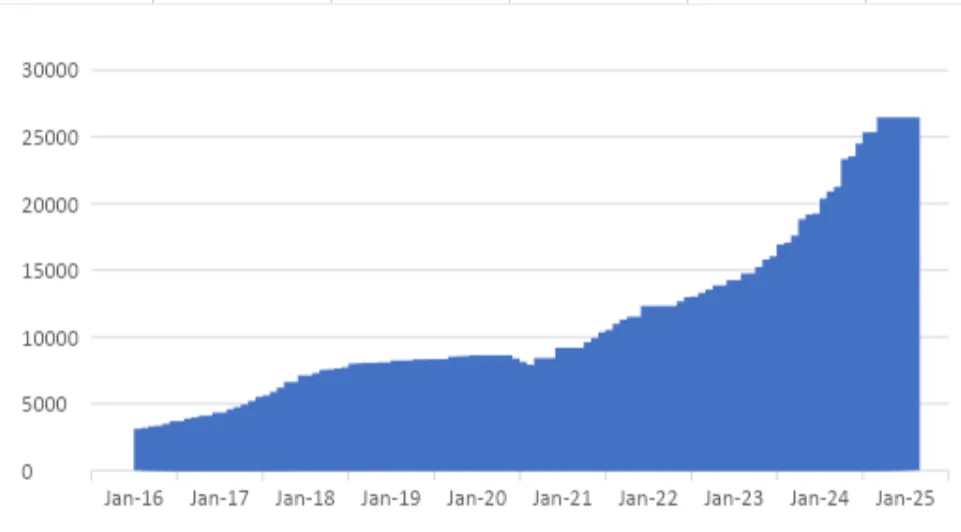
Take a look at the following chart which plots the amount of money invested through the SIP route into MFs since April 2016.
 Source: Association of Mutual Funds in India (AMFI).
In April 2016, the total amount of money invested into MFs through the SIP route stood at ₹3,122 crore. In December 2024, it stood at ₹26,459 crore, the highest level ever. And this isn’t a one-off. In October 2024 and November 2024, the money invested through the SIP route had stood at greater than ₹25,000 crore. Estimates suggest that close to 90% of this money is invested into equity MFs, and hence, largely into stocks.
Those working in and with the MF industry like to highlight this data to point out that the Indian retail investors have matured, given that they continue to invest in stocks indirectly even when the stock market has seen some turmoil in recent months.
So, the simplistic inference being drawn is that retail investors are buying more stocks through the indirect route of SIPs and equity MFs as stock prices are falling. The trouble is that like many simplistic inferences, which sound right and make sense to the human mind, it tends to ignore other important points. Like any other crisp and confident inference, the nuance has gone missing in this one as well.
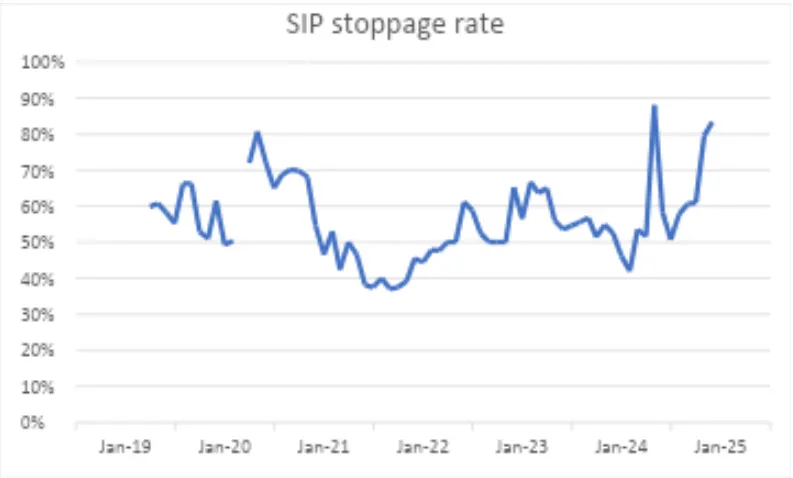
Now, take a look at the following chart. It plots the stoppage rate of SIPs since April 2019.
 Source: Author’s calculations on AMFI data
*The curve is broken because data for March 2020 is missing.
Source: Author’s calculations on AMFI data
*The curve is broken because data for March 2020 is missing.The SIP stoppage rate in December 2024 was at 83%, the second highest level since April 2019, the period for which I could find data. In November 2024, the stoppage rate had stood at around 80%. In May 2024, the stoppage rate had stood at greater than 88%, the highest level ever.
Now, what is the SIP stoppage rate? The SIP stoppage rate is the number of SIPs that have been discontinued or their tenure has been completed during a month divided by the number of new SIPs registered during the same month.
In December 2024, 44.90 lakh SIPs were discontinued or completed their tenure. In the same month, 54.27 lakh new SIPs were registered. This implies a stoppage rate of around 83% (44.9 divided by 54.27). Or to put it simply, for every 100 new SIPs registered during December, 83 SIPs were shut or their tenure got completed.
So, what does this mean in broader terms? Many investors seem to be stopping their SIPs as markets have fallen or haven’t really given the kind of returns that investors have gotten used to in the last few years. A good chunk of retail investors does look at investing in stocks as a route to quick riches.
If we look at the data from May onwards to December, nearly a third of the outstanding SIPs during the period have been shut or their tenure has been completed. For 2024, this figure stands at an even higher 45%.
Why does this hurt? The basic idea behind using the SIP route to invest in stocks is to bring cost averaging into play.
It ensures that an investor keeps purchasing units of equity MFs even when stock prices drop, allowing them to acquire more MF units at lower prices, which can prove advantageous when stock prices eventually recover. Psychologically it’s difficult to buy when stock prices are falling. A SIP helps investors buy stocks when prices have been falling.
Let’s say an investor sets up an SIP of ₹20,000 and buys units of an equity MF priced at ₹20 per unit in the first period. This allows to purchase 1,000 units. In the next period, stock prices drop, and the price per unit falls to ₹16. The investor now acquires 1,250 units, increasing the total to 2,250 units. In the third period, the price rebounds to ₹20 per unit, making the total value of the 2,250 units ₹45,000. This exceeds the ₹40,000 invested, demonstrating the benefits of cost averaging, where buying more units at lower prices enhances returns when prices recover. (The example is only for explanation purposes)
Of course, this comes with the disclaimer that some investors might be stopping SIP in one MF scheme and starting another one. The data does not capture this possibility. Neither does it capture for investors whose SIP tenure in one scheme might have come to an end and they might be starting a new SIP in another scheme. It needs to be stated here that changing SIPs too frequently comes with its own share of costs.
Indeed, now is the time to drink stocks SIP by SIP because cost averaging will come into the picture and that will benefit in the time to come.
By signing up you agree to Upstox’s Terms & Conditions
About The Author
Next Story

