Market News
Week ahead: US election results, Swiggy IPO, Q2 earnings among key market triggers to watch
.png)
5 min read | Updated on November 04, 2024, 09:04 IST


SUMMARY
This week, market trends will be influenced by the US election results, second-quarter earnings, Federal Reserve policy, and foreign fund flows. Foreign Institutional Investors (FIIs) started the November series with net short positioning in index futures.
Stock list

Fed interest rate decision, Swiggy IPO and Q2 earnings among key factors to watch
Markets snapped four-week losing streak an ended the last week of October series on the positive note. The NIFTY50 index traded in narrow range throughout the week amid continuous sellig by foreign investors and muted corporate earnings.
The NIFTY50 index formed an inside candle on the weekly chart, resemblign the doji pattern. Additionally, the index ended the October month on a negative note, ending below the previous month’s low, after almost an year.
Sectorally, PSU Banks (+7.8%) and Metals (+3.7%) advanced the most. IT (-3.8%) and Consumer Durables (-0.3%) were the top losers.
Index breadth- NIFTY50
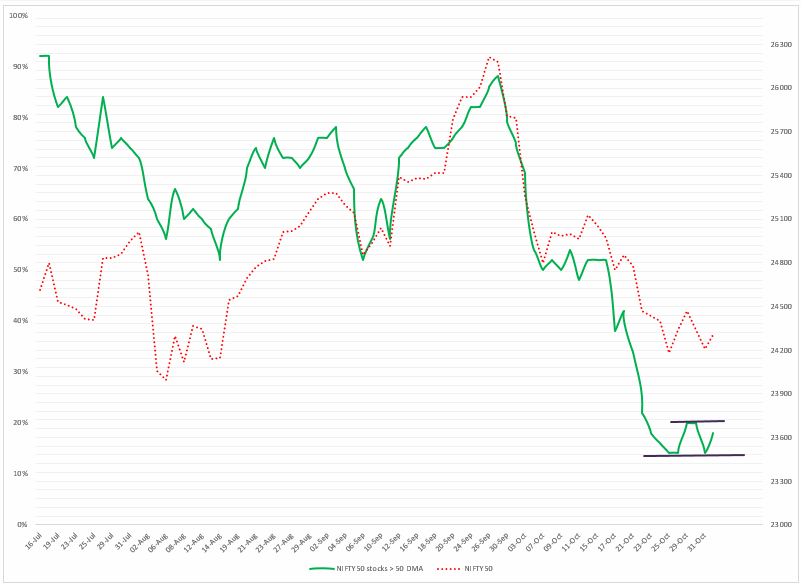
The market breadth remained weak throughout the week, with only 17% of NIFTY50 stocks trading above their 50-day moving averages. As shown in the chart below, the index is currently hovering near the oversold zone between 10 to 20% from last five trading sessions. However, the broader breadth of the index still remains weak and until the index sustains the rebound above 24,400 zone, the trend may remain negative.
FIIs positioning in the index
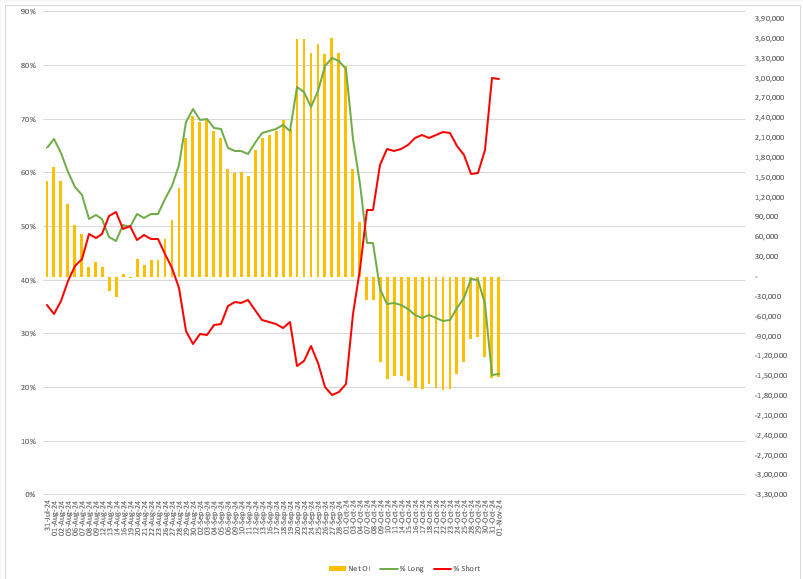
The Foreign Insititutional Investors (FIIs) started the November series with the net short positioning in the index futures. Currently, the long-to-short ratio of the index futures stand at 23:77, with the net open interest being short at 1.5 lac contracts. This indicates bearish positioning of FIIs for the November series.
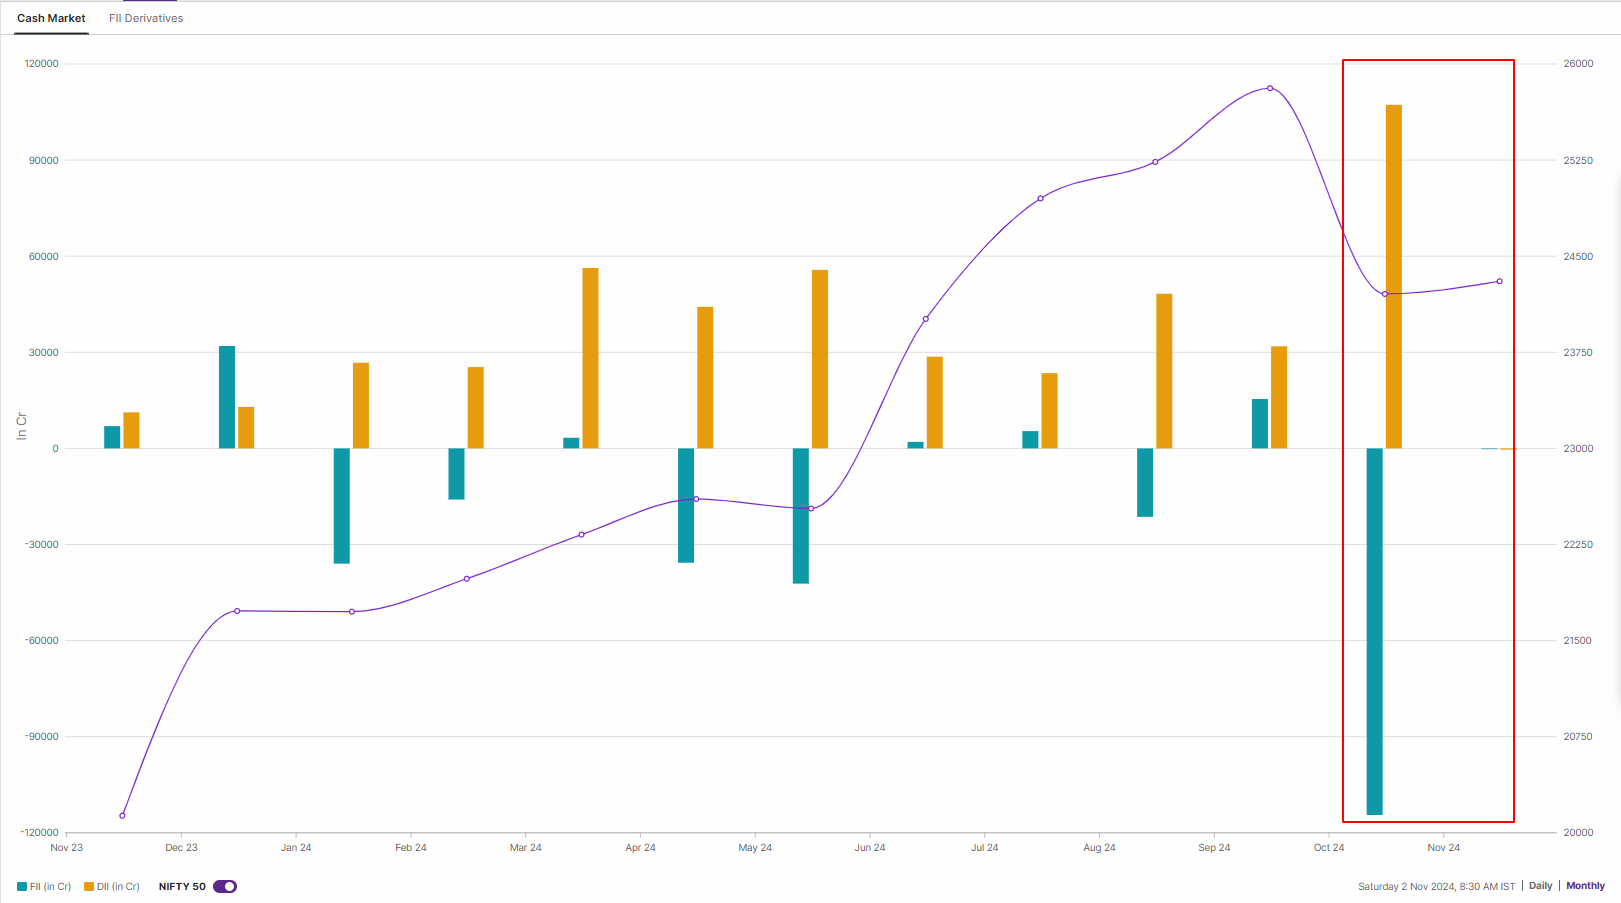
In the cash market, the Foreign Insititutional Investors(FIIs) sold shares worth ₹1,14,445 crore in October 2024, registering highest sell figure since the March 2020. On the other hand, the Domestic Institutional Investors supported the markets and purchased shares worth ₹1,07,254 crore, resulting in a net outflow of ₹7,191 crore.
F&O - NIFTY50 outlook
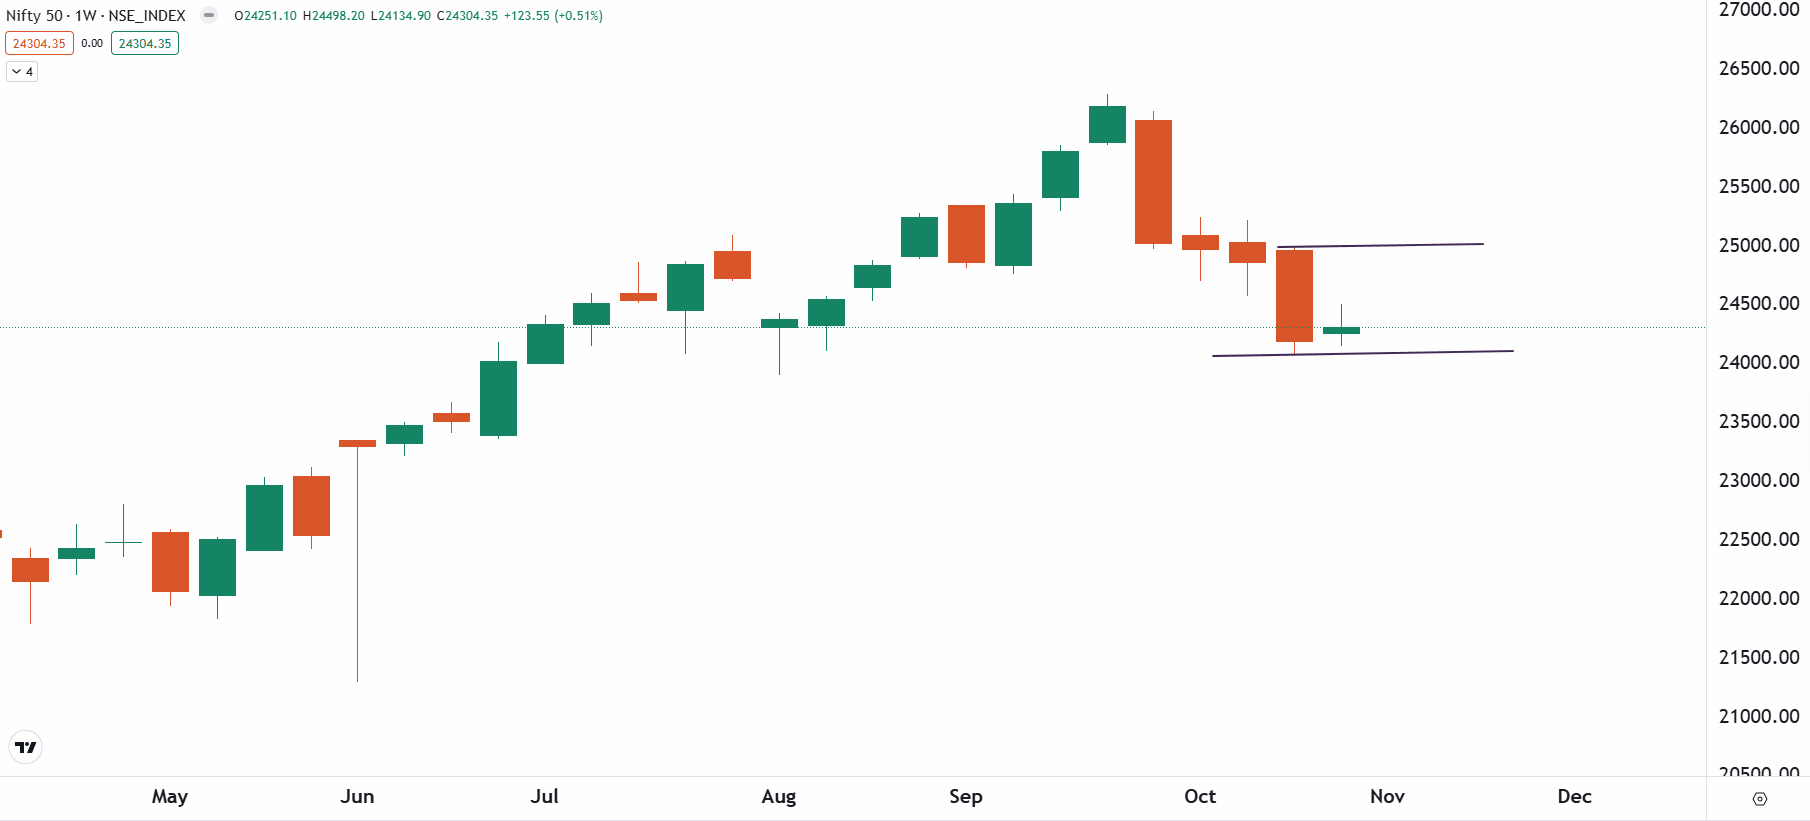
The NIFTY50 index formed an inside candle on the weekly chart, resembling the doji candlestick pattern. A doji is a neutral pattern, which indicates indecision among investors. However, after the consolidation, the index is currently placed at a crucial level.
The positional traders can keep an eye on the low and the high of previous week’s candle. The break of these levels on a closing basis on the daily chart will provide further directional clues to the traders.
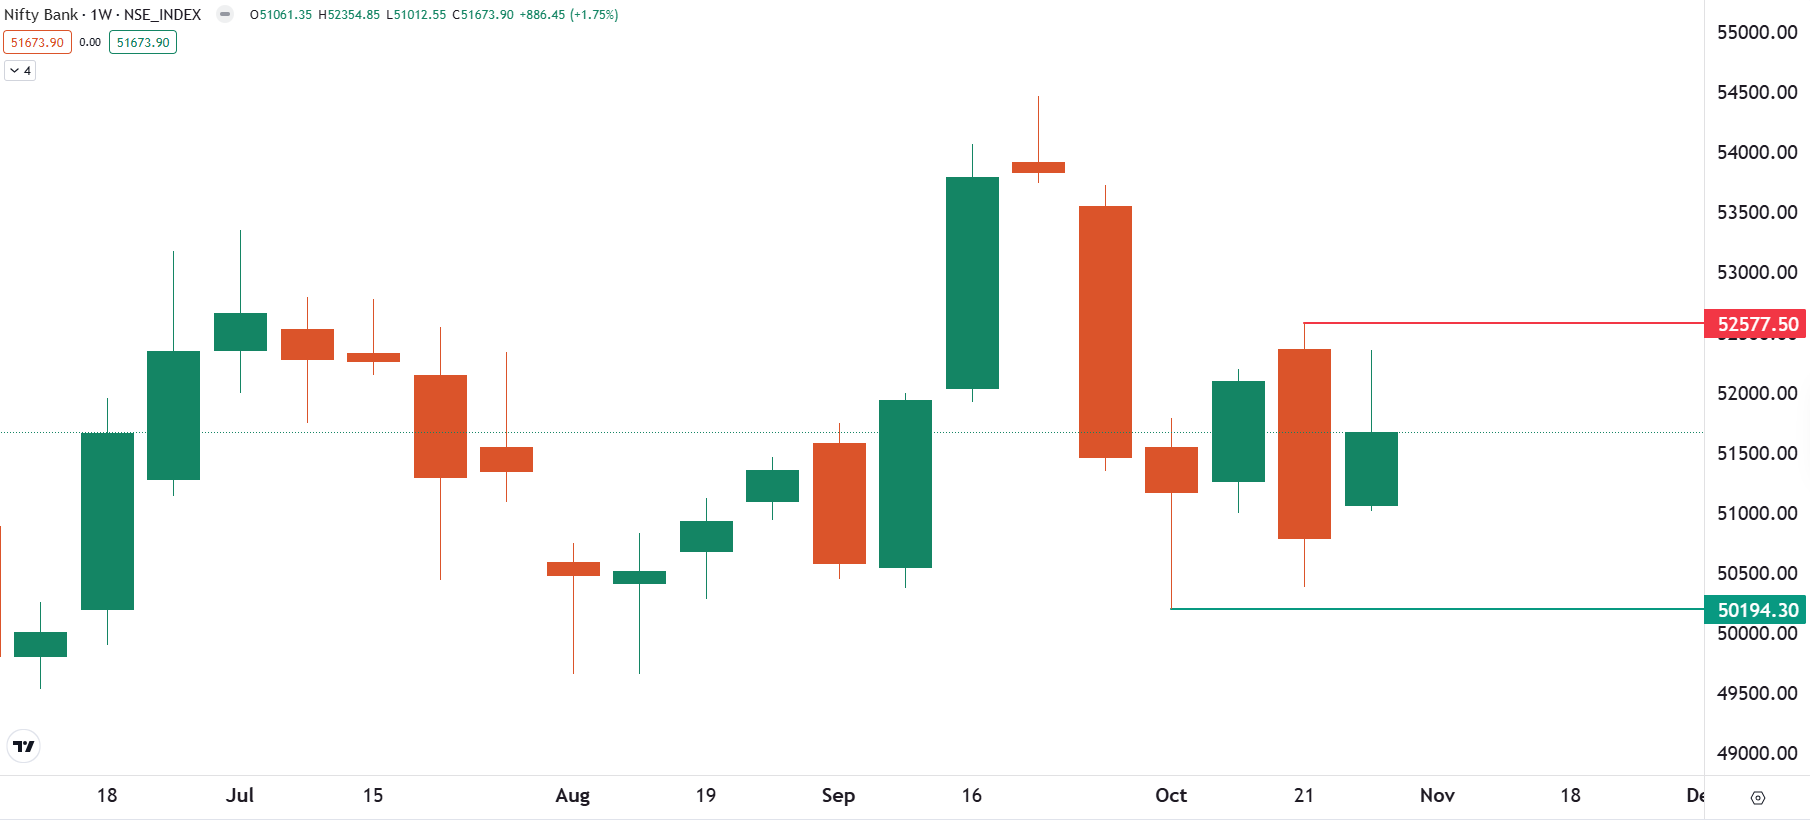
F&O - BANK NIFTY outlook
The BANK NIFTY index outperformed the benchmark indices and also formed the inside candle on the weekly chart. It formed a bullish harami candle on the weekly chart, which is a bullish reversal signal. It occurs when a small bullish (green) candle is contained within the previous larger bearish (red) candle. However, the pattern gets confirmed if the close of the subsequent candle is above the high of the reversal candle.
For the coming week, the index may broadly remain range-bound between 52,500 and 50,000 zone. If the index slips below the immediate support of 51,000, then it may extend the weakness upto 50,000 zone. On the flip side, a close above the 52,500 zone may lead to a short-covering rally.
To stay updated on any changes in these levels and all intraday developments, be sure to check out our daily morning trade setup blog, available before the market opens at 8 am.
Disclaimer: Derivatives trading must be done only by traders who fully understand the risks associated with them and strictly apply risk mechanisms like stop-losses. The information is only for consumption by the client, and such material should not be redistributed. We do not recommend any particular stock, securities, or trading strategies. The securities quoted are exemplary and not recommendatory. The stock names mentioned in this article are purely to show how to do analysis. Make your own decision before investing.
Related News

About The Author
Next Story