Market News
Week ahead: RBI policy, TCS Q2 results, and FOMC minutes are among key market triggers to watch
.png)
7 min read | Updated on October 07, 2024, 09:12 IST


SUMMARY
NIFTY50 and BANK NIFTY indices both declined by over 4% last week, forming a bearish candle on the weekly chart. The short-term trend has shifted to bearish as both indices fell below their 20-day and 50-day moving averages on the daily chart. With the volatility index surging by over 10%, traders are advised to exercise caution and implement robust risk management strategies while planning their trades.
Stock list

Market movers this week: RBI decision, TCS Q2 results, FOMC minutes and inflation trends
Markets ended their three-week winning streak, facing strong selling pressure and closing the week on a negative note. The sharp decline in indices was driven by escalating geopolitical tensions between Israel and Iran, rising crude oil prices and siginificant sell-off by foreign investors.
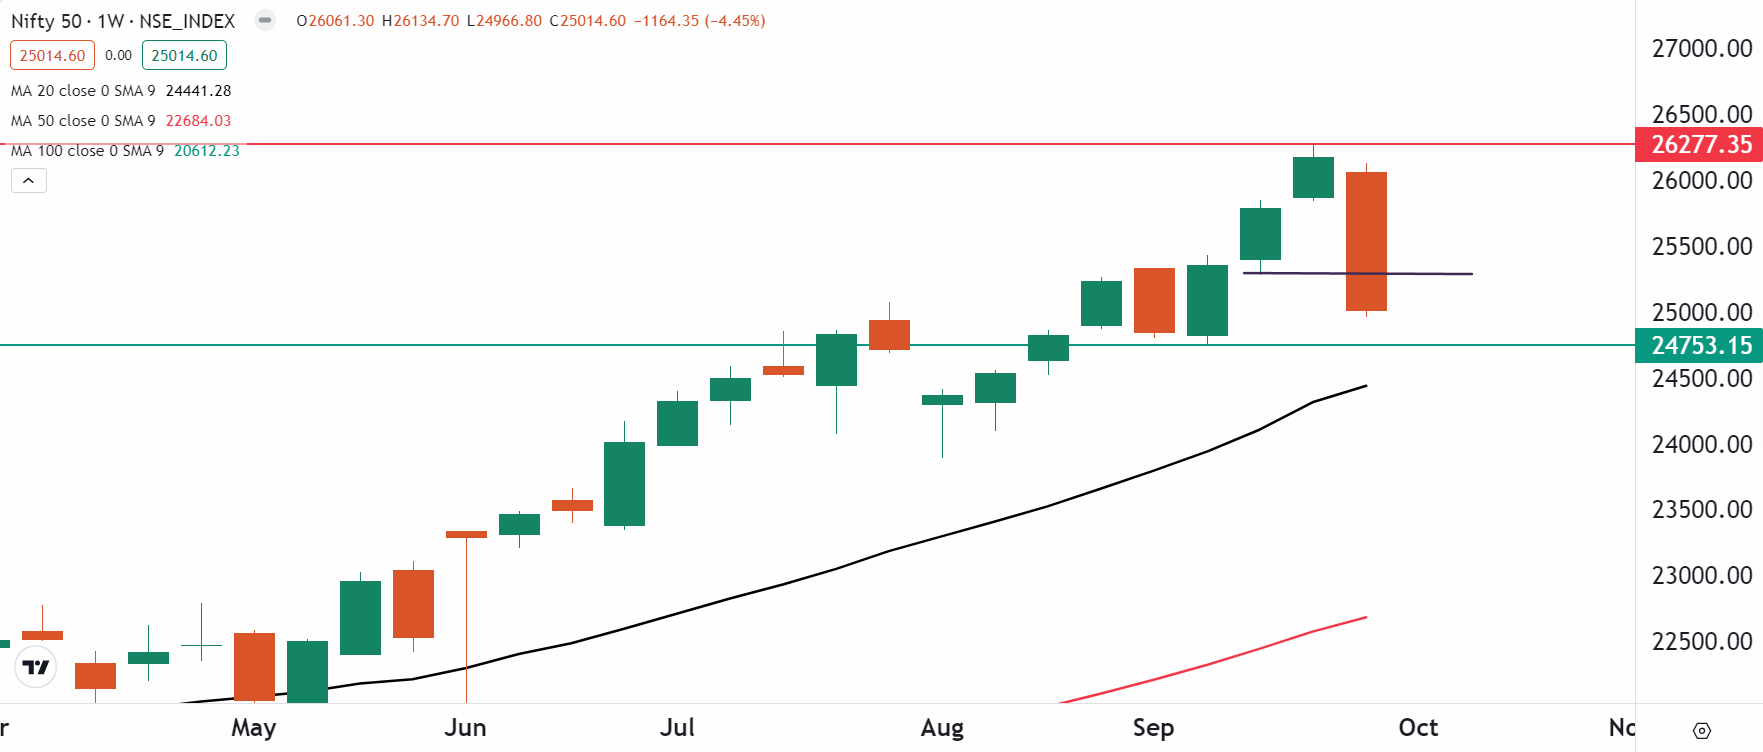
NIFTY50 index slipped more than 4%, forming a large bearish candle on the weekly chart, and closed at 25,014. Broader markets also followed a downward trend, with the NIFTY Midcap 100 index declining 3% and the Smallcap 100 index falling over 2%, performing slightly better than their benchmark counterparts.
Sectorally, the broad-based selling was seen across the indices with Real-Estate (-7.6%), Automobiles (-6.1%) and Energy (-5.5%) declining the most.
Index breadth- NIFTY50
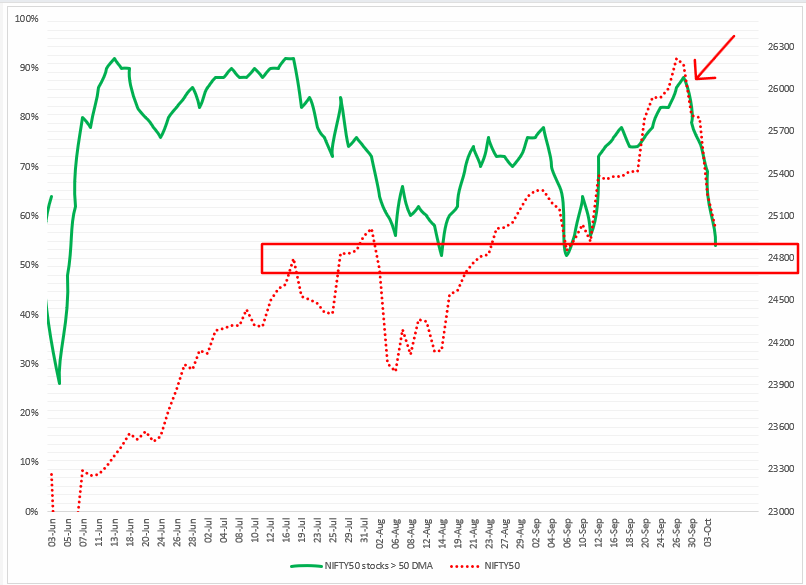
The breadth of the NIFTY50 index weakened starting Monday, with the percentage of NIFTY50 stocks trading above their 50-day moving average dropping sharply from 88% to 79% on 30 September. This downward trend persisted throughout the week, with the reading falling further to 54% by Friday, signaling increasing weakness in the index.
Currently, the breadth indicator is showing the reading of 54% which is in a neutral zone. However, if the reading slips below 50%, then we may see further weakness on the index.
FIIs positioning in the index
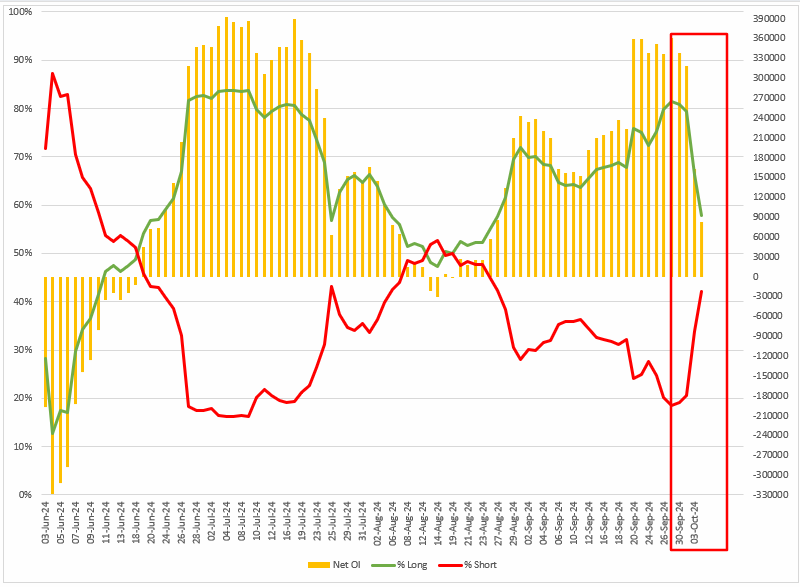
Foreign Institutional Investors (FIIs) halved their bullish bets on index futures, reducing net open interest by 75% from the previous week. FIIs started the week with a long-to-short ratio of 81:19 and ended the week with a reduced ratio of 58:42, highlighting a significant unwinding of long futures contracts.
In last week's blog, we advised our readers to keep a close watch on the change in the long-to-short ratio as FIIs started the October series with an extremely bullish ratio of 81:19. The sharp unwinding of long contracts was seen throughout the week with the index correcting by over 4%.
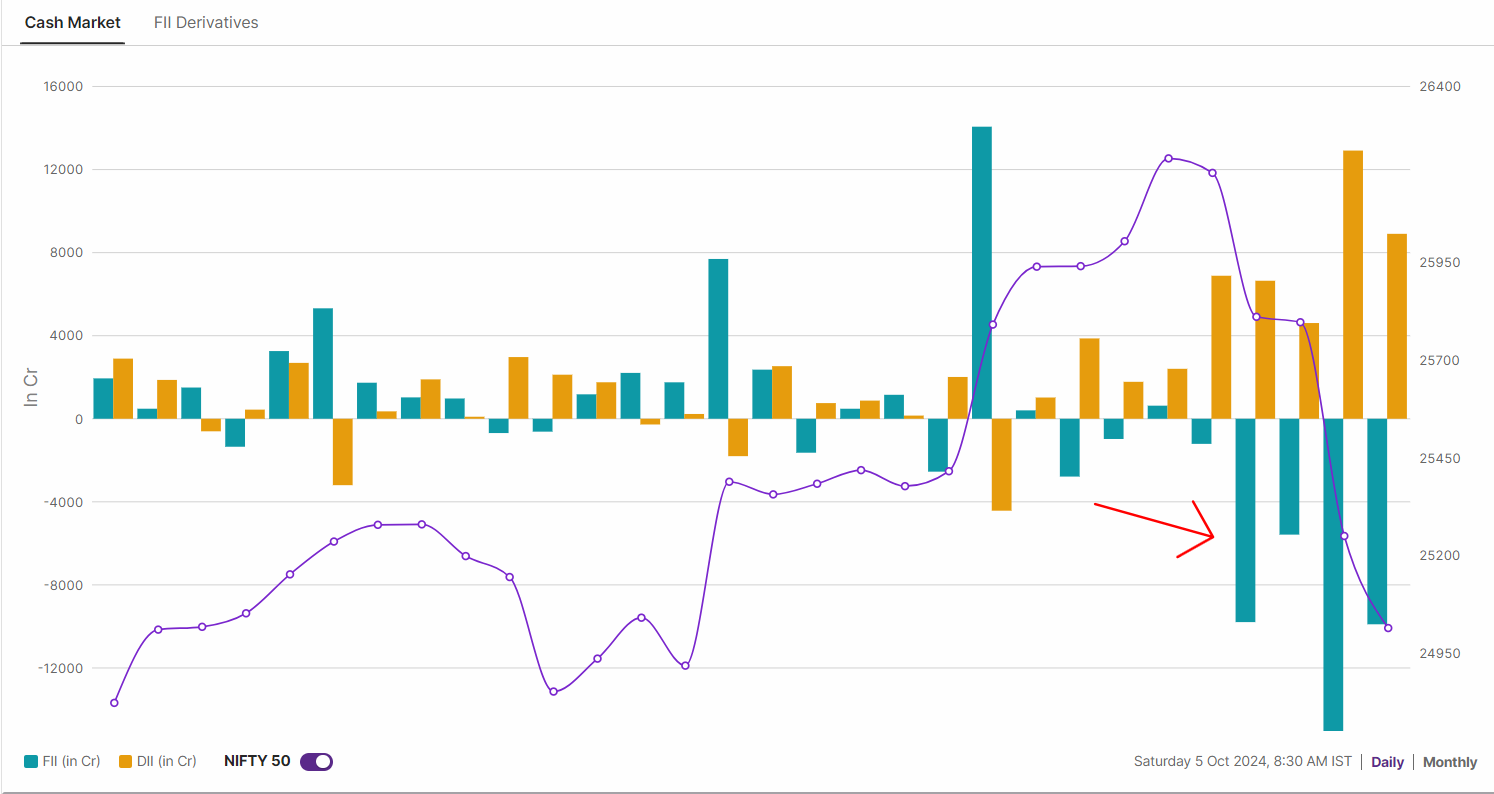
The significant unwinding of the long futures contracts was in line with the cash market activity of the Foreign Institutional Investors (FIIs). The FIIs sold shares worth ₹40,511 crore last week, marking the highest weekly sell-off so far. Meanwhile, the Domestic Institutional Investors absorbed the selling pressure and bought shares worth ₹33,073 crore, taking the net institutional outflow to ₹7,437 crore.
F&O - NIFTY50 outlook
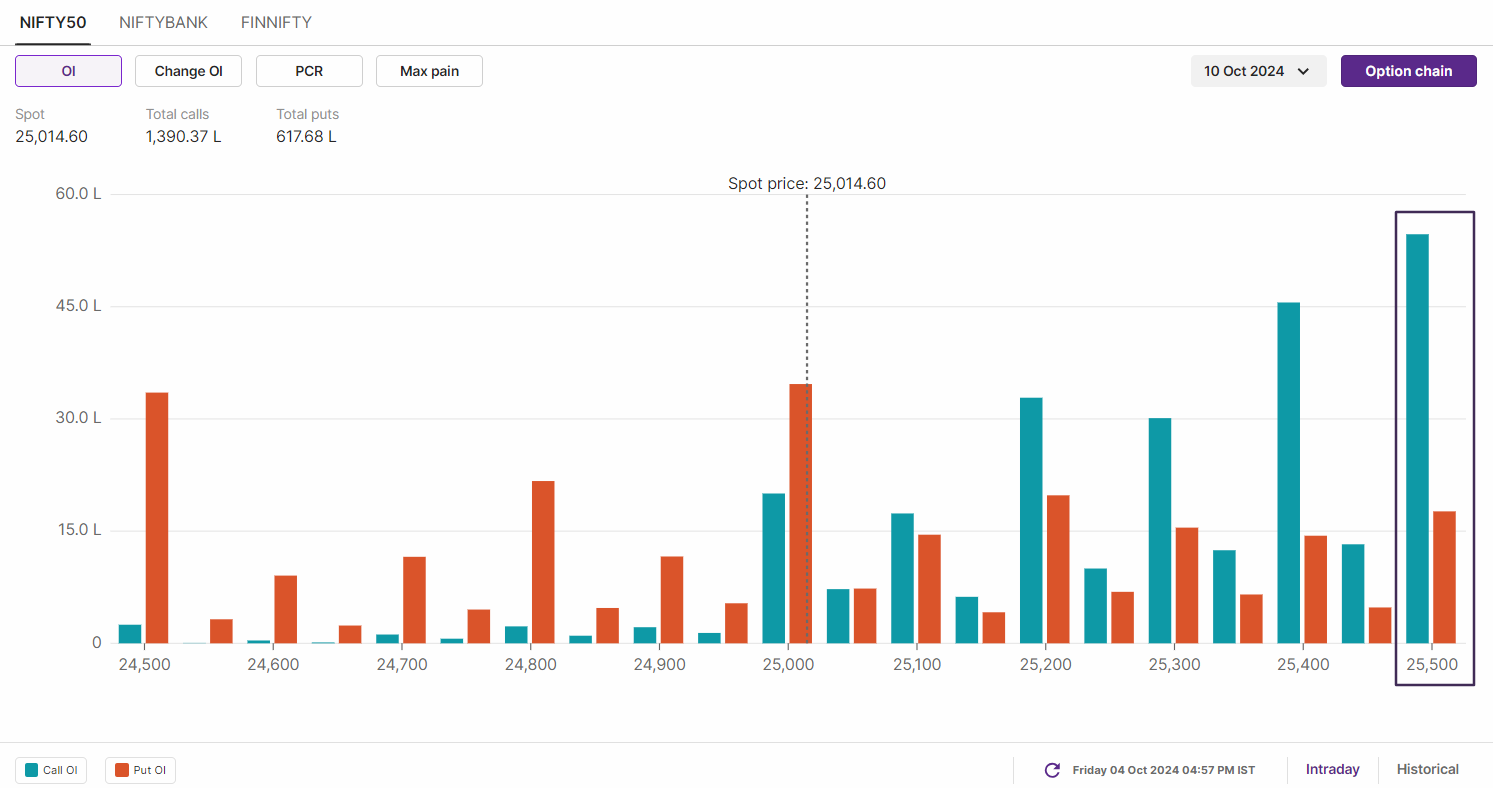
The open interest data of NIFTY50 for the 10 October expiry has highest call base at 26,000 and 25,500 strikes, making them as immediate resistance zones. Conversely, the put base was seen at 24,500 and 24,000 with low volume, suggeesting that index may find support around these levels.
The technical structure of the NIFTY50 index as per weekly chart has turned bearish with index closing below two weeks low. The immediate support is now in 24,700 and 24,800 zone. If the index slips below these levels and surrenders it on closing basis, then we may see further weakness.
However, after a sharp fall of over 4%, we believe that the index may consolidate around these levels staging small recoveries resulting in sharp swings in both directions. The immediate resistance for the index is around 25,700 zone.
F&O - BANK NIFTY outlook
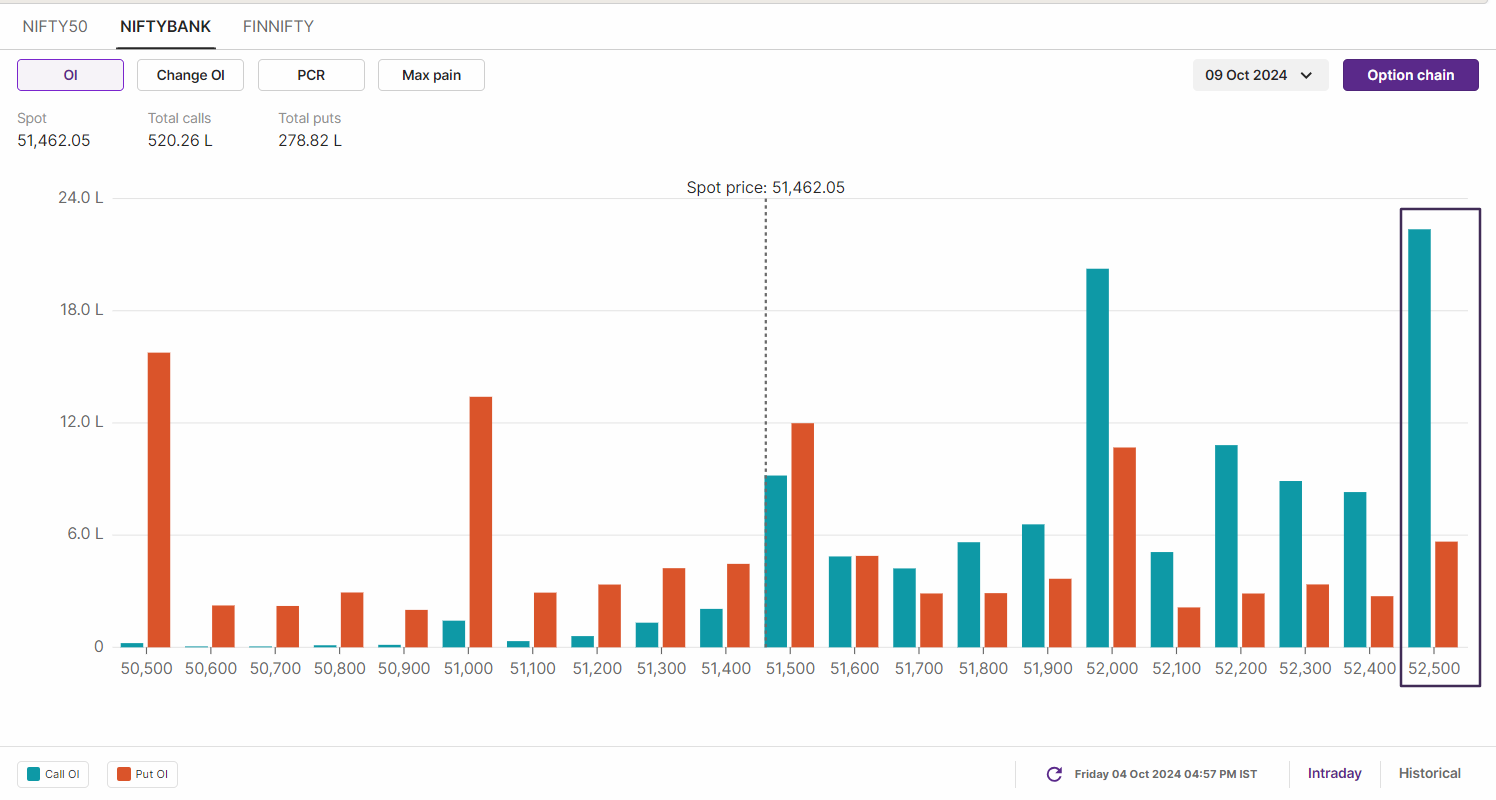
The options data of BANK NIFTY also looks tilted towards call writers for 9 October expiry. The index saw significant call open interest placed at 53,000 and 52,500 strikes, making them as immediate resistance zones for the index. On the other hand, the put base was seen at 50,500 and 50,000 strikes making them as immediate support.
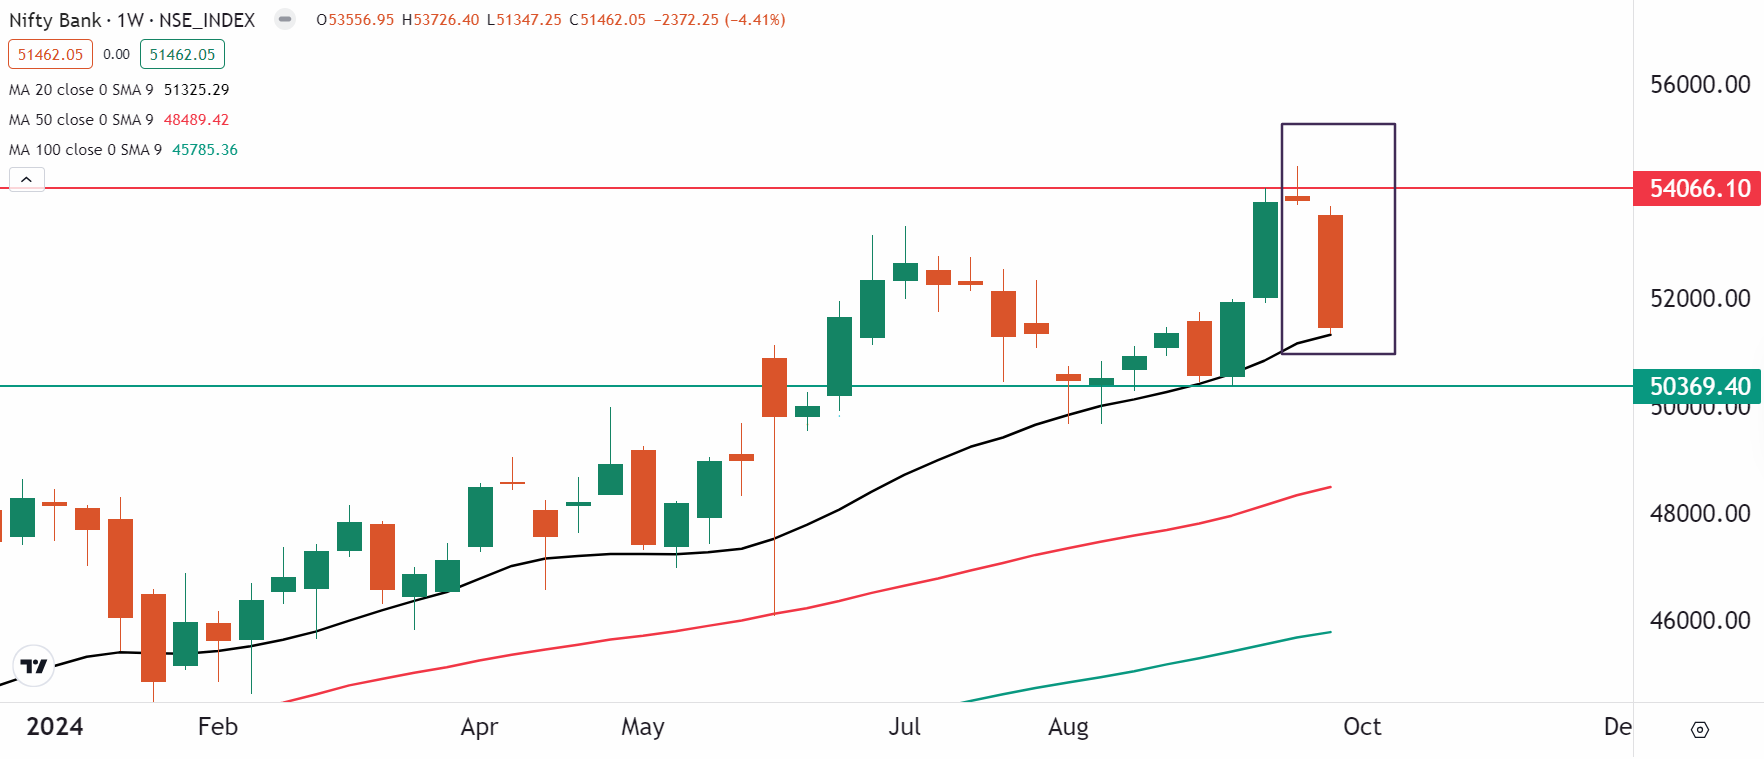
In our last week’s blog, we highlighted to our readers the formation of shooting star pattern on the weekly chart, awaiting confirmation. In the previous week, the index confirmed the bearish reversal pattern and closed below it.
As you can see on the chart below, BANK NIFTY has taken support at its 20 weekly moving average after a sharp fall of over 5%. In the near-term, we expect the index to consolidate between 52,500 and 51,000. However, if the index slips below the crucial support of 50,369, then the index may slip towards 49,000 mark. On the other hand, the 52,500 zone will act as immediate resistance.
On the domestic front, all eyes will be on the Reserve Bank of India (RBI). The central bank's rate-setting Monetary policy Committee (MPC) will meet from 7-9 October and announce the outcome of the meeting at 10am on 9 October. Street expectations are that the RBI will leave interest rates unchanged at 6.5%, even after the Fed's first rate cut. In addition, the Street will also be looking for the RBI Governor's comments on the timing of the rate cut cycle.
Globally, the third quarter earnings of BlackRock, JPMorgan Chase, Wells Fargo and Pepsico will be in focus.
The spike in crude oil prices was due to fears of a supply disruption with Israel provoking Iran by targeting Iranian oil supplies. Iran is a member of OPEC+ and produces over 3.2 million barrels per day, 3% of global production.
In the upcoming sessions, we anticipate the downtrend to persist, with both indices facing immediate resistance around their 20-day moving average. However, traders should remain cautious of potential intraday volatility, as the indices may consolidate and could experience a technical rebound. It's important for traders to closely monitor price action around key levels and adjust their strategies accordingly.
To stay updated on any changes in these levels and all intraday developments, be sure to check out our daily morning trade setup blog, available before the market opens at 8 am.
Disclaimer: Derivatives trading must be done only by traders who fully understand the risks associated with them and strictly apply risk mechanisms like stop-losses. The information is only for consumption by the client, and such material should not be redistributed. We do not recommend any particular stock, securities, or trading strategies. The securities quoted are exemplary and not recommendatory. The stock names mentioned in this article are purely to show how to do analysis. Make your own decision before investing.
Related News

About The Author
Next Story


