Market News
Trade Setup for Oct 11: NIFTY50 forms inside candle, can it hold 25,000 at weekly close?
.png)
5 min read | Updated on October 11, 2024, 07:19 IST


SUMMARY
The NIFTY50 has failed to make a meaningful recovery from last week's sell-off and has run into resistance around 25,300. Traders may want to monitor the index's weekly close as a close below the 25,000 level will indicate further weakness.
Stock list

The BANK NIFTY index outperformed its benchmark peers, rising 1%, led by gains in the index's heavyweight private banks.
Asian markets update
The GIFT NIFTY is trading flat around 25,000 mark, suggesting a muted start for the NIFTY50 today. In contrast, other Asian markets are showing positive momentum. Japan’s Nikkei 225 is up 0.6%, while Hong Kong’s Hang Seng index remains closed due to holiday.
U.S. market update
- Dow Jones: 42,454 (▼0.1%)
- S&P 500: 5,780 (▼0.2%)
- Nasdaq Composite: 18,282 (▼0.0%)
U.S. indices ended Thursday’s session in the red following the release of hotter-than expected inflation data and a spike in the unemployment claims. The Consumer Price Index (CPI) increased 2.4% YoY in September. The yearly increase, which is the lowest annual reading since February 2021, came in slightly higher than the expectation of 2.3%.
About 258,000 new claims for unemployment benefits were filed during the week of 5 October, according to data released by the Labor Department on Thursday. The reading was higher than expectations for 2,29,000 claims. Jobless claims spiked last week due to the effects of Hurricane Helene and the ongoing labour strike at Boeing.
NIFTY50
- October Futures: 25,117 (▲0.1%)
- Open Interest: 5,60,441 (▲1.1%)
The NIFTY50 index traded in a narrow range on the weekly expiry of its options contracts and formed an inside candle on the daily chart. The index extended its consolidation for the third day in a row and traded within the range of the 7 October candle, forming the third inside candle on the daily chart.
The technical structure of the index continues to be weak with the NIFTY50 facing a second rejection from its 50 day moving average. As discussed in yesterday's blog, the broader structure of the index has become range bound between the 20 and 100 day moving averages.
Short-term traders can also monitor the high and low of the 7 October candle. The index is largely consolidating within its range and a close above or below the high or low of the candle will provide directional clues.
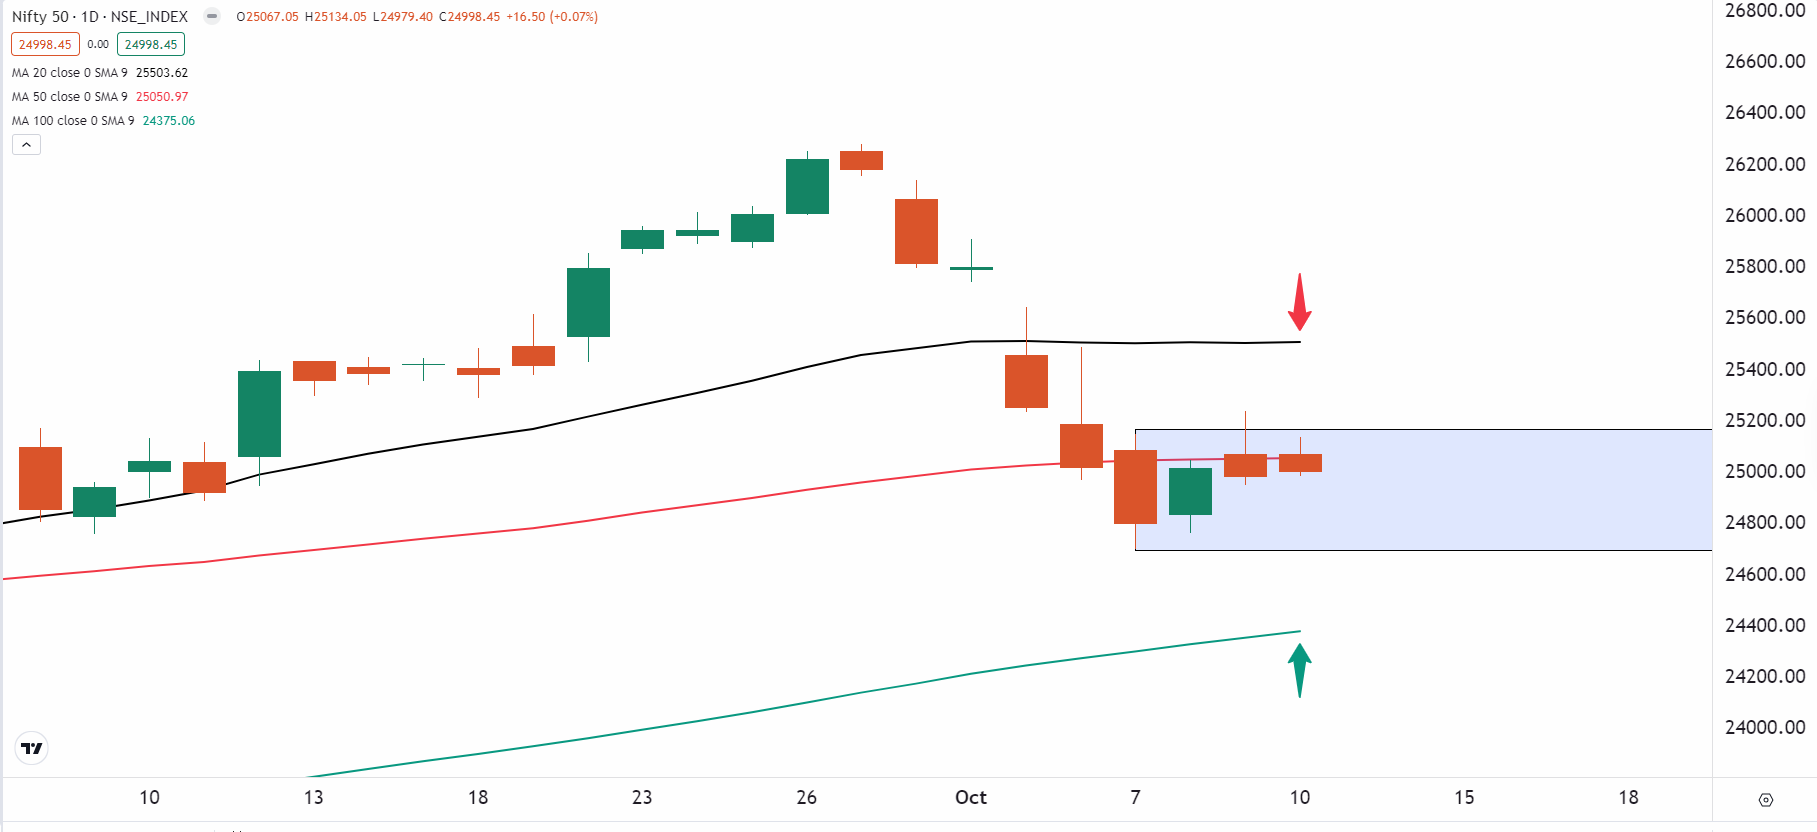
Currently, open interest for the 17 October expiry is concentrated at the 25,000 strike level. However, as the data is still in its early stages, clearer directional insights will emerge after the weekly close of the NIFTY50.
BANK NIFTY
- October Futures: 51,780 (▲0.8%)
- Open Interest: 2,05,871 (▼3.4%)
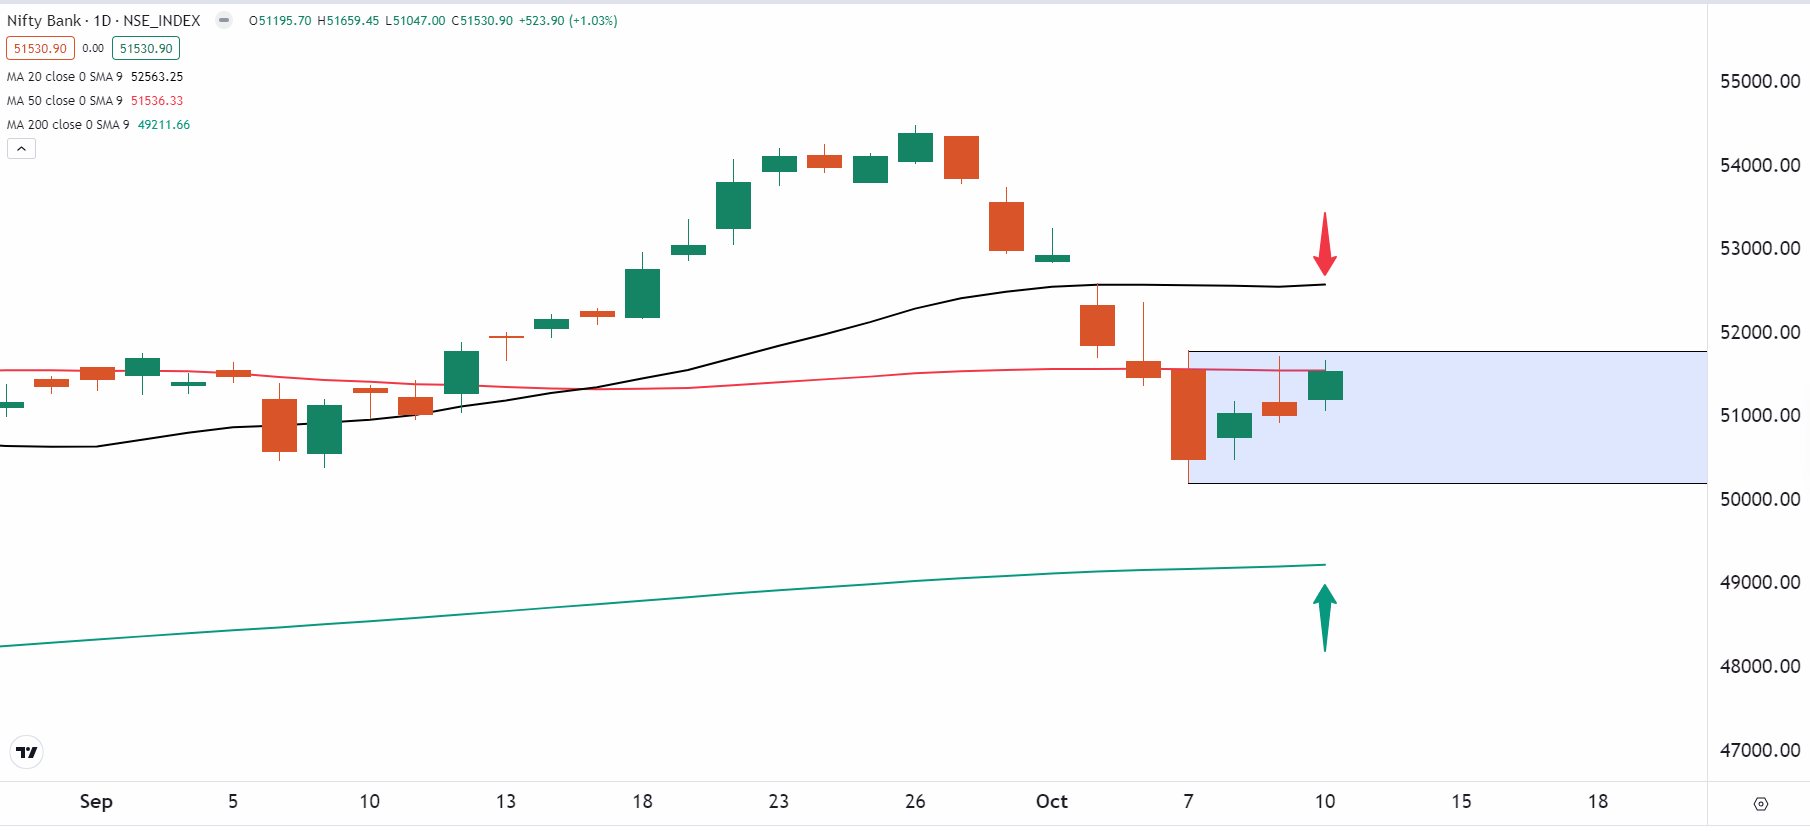
The BANK NIFTY index outperformed its benchmark peers, rising 1%, led by gains in the index's heavyweight private banks. The index also formed an inside candle on the daily chart, trading within the range of the 7 October candle.
As shown in the chart below, the index is currently consolidating between its 20 and 200 day moving averages following last week's sharp decline. On the daily chart, the index has formed a third consecutive inside candle, indicating contraction of the range. For directional clues, traders can monitor the high and the low of 7 October candle. A close above the high or below the low of the candle will provide clear directional insights.
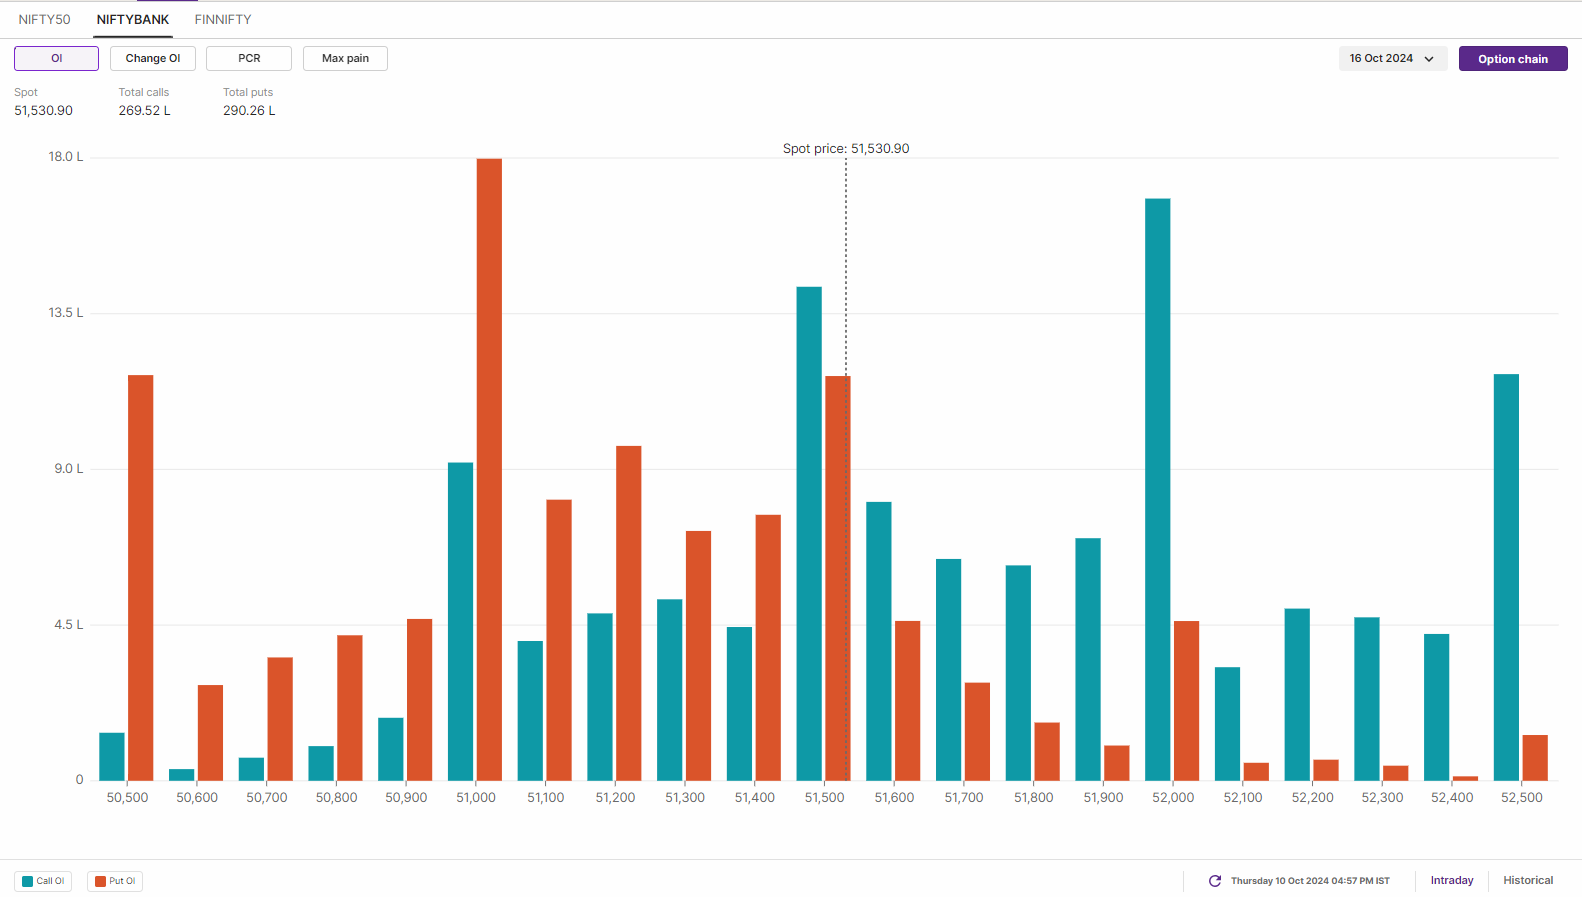
The open interest data of the 16 October expiry has highest call base at 52,000 strike and the put base was accumulated at 51,000 strike. The current build-up of the open interest indicates range-bound movement with the base at 51,500 strike. However, traders are advised to monitor the data as per the weekly close and align strategies accordingly.
FII-DII activity
Stock scanner
Long build-up: N/A
Out of F&O ban: NIL
Added under F&O ban: Chambal Fertilisers
In Futures and Options or F&O, long build-up means an increase in Open Interest (OI) along with an increase in price, and short build-up means an increase in Open Interest(OI) along with a decrease in price.
Source: Upstox and NSE.
Disclaimer: Derivatives trading must be done only by traders who fully understand the risks associated with them and strictly apply risk mechanisms like stop-losses. The information is only for consumption by the client and such material should not be redistributed. We do not recommend any particular stock, securities and strategies for trading. The securities quoted are exemplary and are not recommendatory. The stock names mentioned in this article are purely for showing how to do analysis. Take your own decision before investing.

About The Author
Next Story


