Market News
Trade Setup for Nov 4: NIFTY50 ends October series with a bearish signal
.png)
4 min read | Updated on November 04, 2024, 07:15 IST
SUMMARY
As per the options data, the NIFTY50 index witnessed significant call base at 24,300 and 24,500 strikes, indicating that index may resistance around these levels.
Stock list

The NIFTY50 index ended the October series on a negative note and closed below the previous month low after the gap of a year.
Asian markets update
The GIFT NIFTY is trading flat, suggesting a muted opening for the NIFTY50 today. Meanwhile, Japan’s Nikkei 225 is closed for a holiday, and Hong Kong’s Hang Seng Index has gained 0.4%.
U.S. market update
- Dow Jones: 42,052 (▲0.6%)
- S&P 500: 5,728 (▲0.4%)
- Nasdaq Composite: 18,239 (▲0.8%)
U.S. indices ended the Friday’s session on a positive note amid rebound in tech stocks as investors looked past the disappointing October jobs report. Shares of Amazon surged over 6%, driven by strong performance in its cloud and advertising segments. On the other hand, shares of Intel jumped 7% after beating revenue forecasts and providing robust guidance.
Meanwhile, the Friday's jobs report showed that the U.S. economy added just 12,000 jobs in October, well below expectations of 1,00,000, slowest growth since December 2020. Traders largely shrugged off the weak data, attributing it to the impact of hurricanes and a strike at Boeing.
NIFTY50
- November Futures: 24,388 (▼0.4%)
- Open Interest: 4,22,641 (▲35.1%)
The NIFTY50 index ended the October series on a negative note and closed below the previous month low after the gap of a year. The price action of the index remained weak on the monthly expiry of its options contracts and ended the session on a negative note.
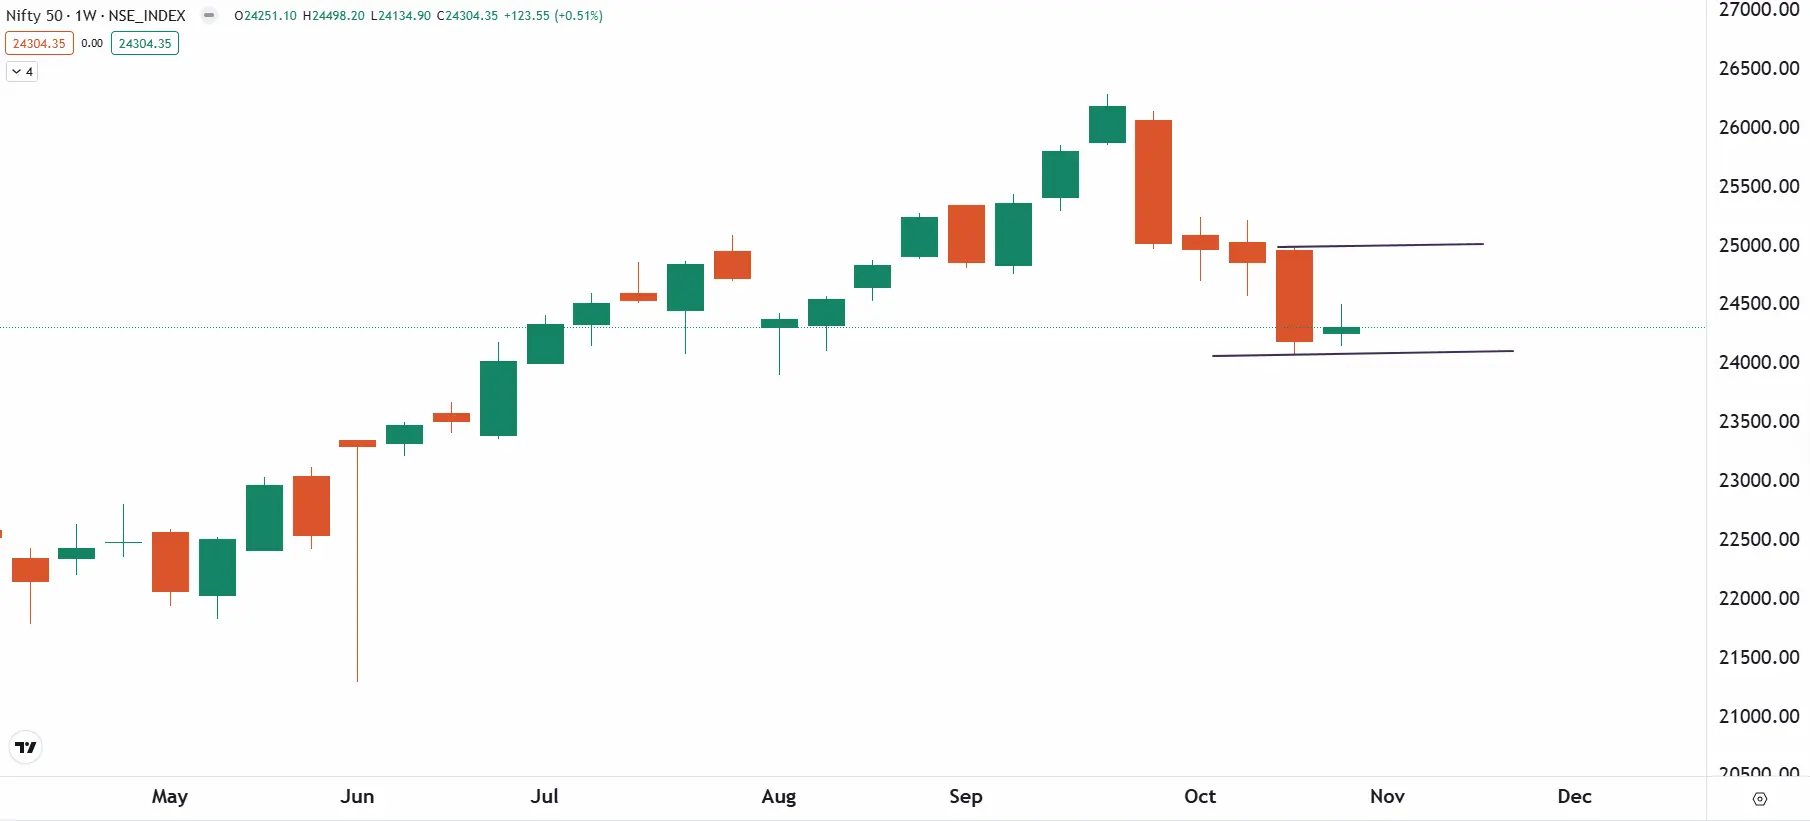
The price action of the index as per the weekly time frame remains bearish with the appearance of inside candle. The inside bar indicates consolidation in a narrow range with sharp bouts of volatility in both the directions. As per the weekly chart, traders can plan bearish strategies if the index ends below the 24,100 zone on the daily chart. On the flip side, a close above the 24,500, which also coincides with the high of the inside candle, will result in a rebound upto 24,800 zone.
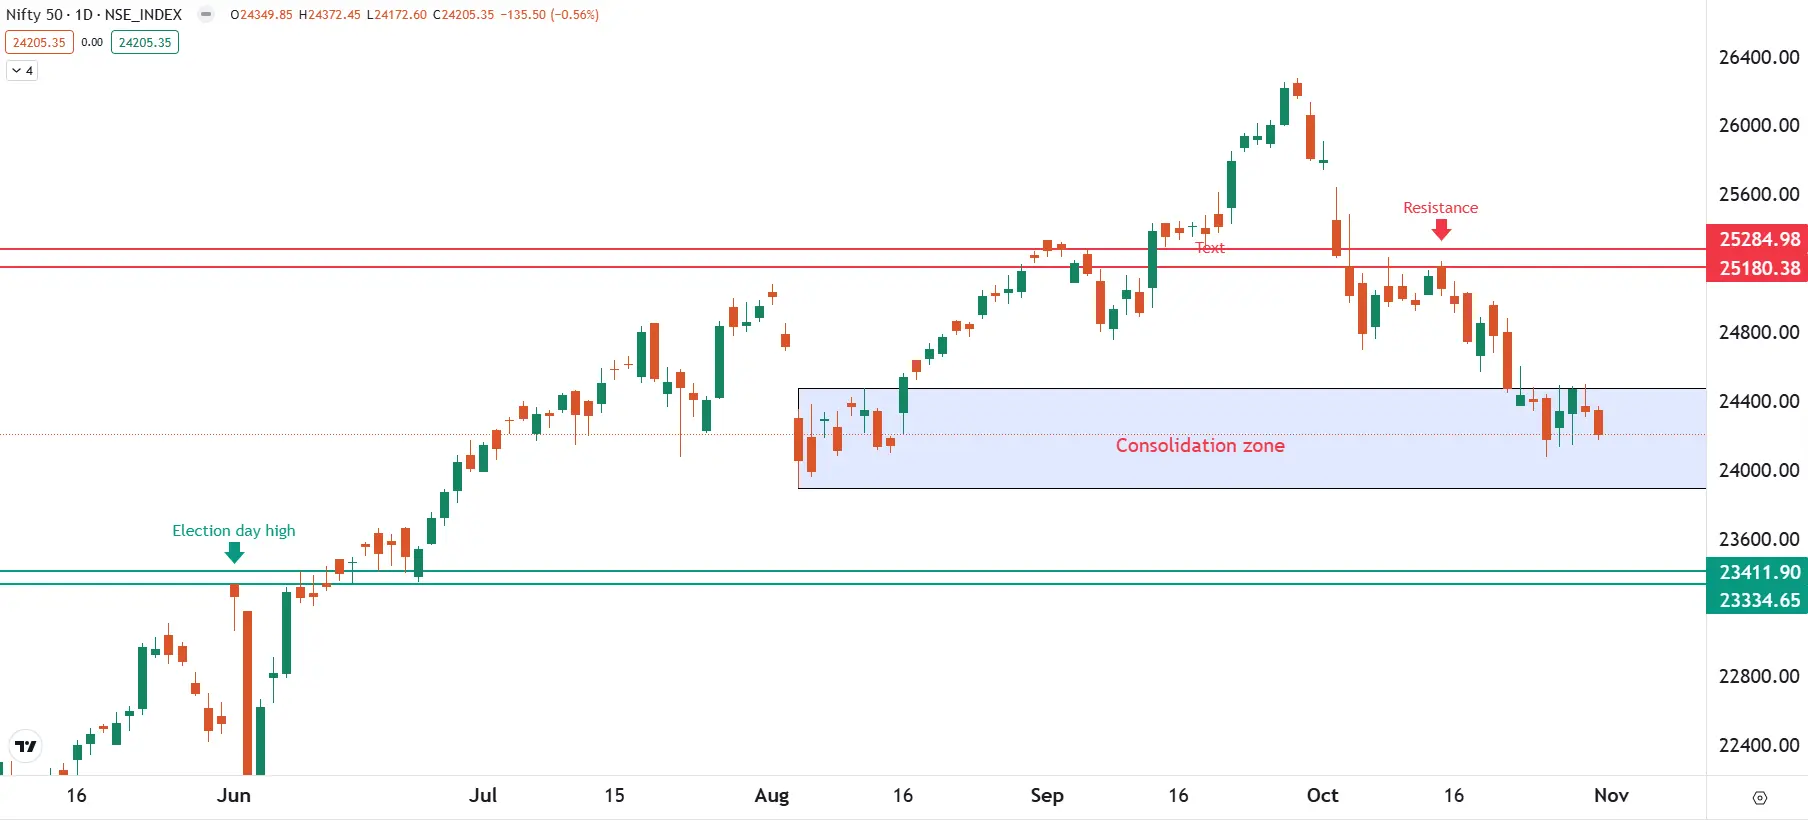
On the daily chart, the index is currently consolidating within the the broader 500 point range since last six trading sessions. Traders should closely monitor the price action of the index around this zone and plan strategies accordingly. Unless the index breaks this range on closing basis, the trend may remain range-bound. However, a close above or below this range will provide further directional clues.
BANK NIFTY
- November Futures: 52,260 (▼0.6%)
- Open Interest: 1,51,455 (▲43.8%)
For the second day in a row, the BANK NIFTY opened on a weak note, erasing most of the gains made on the 29th. The index remained subdued throughout the session, forming a bearish candle on the daily chart. However, unlike the benchmark NIFTY50, the BANK NIFTY managed to close above its low for the month, although it ended the month in negative territory.
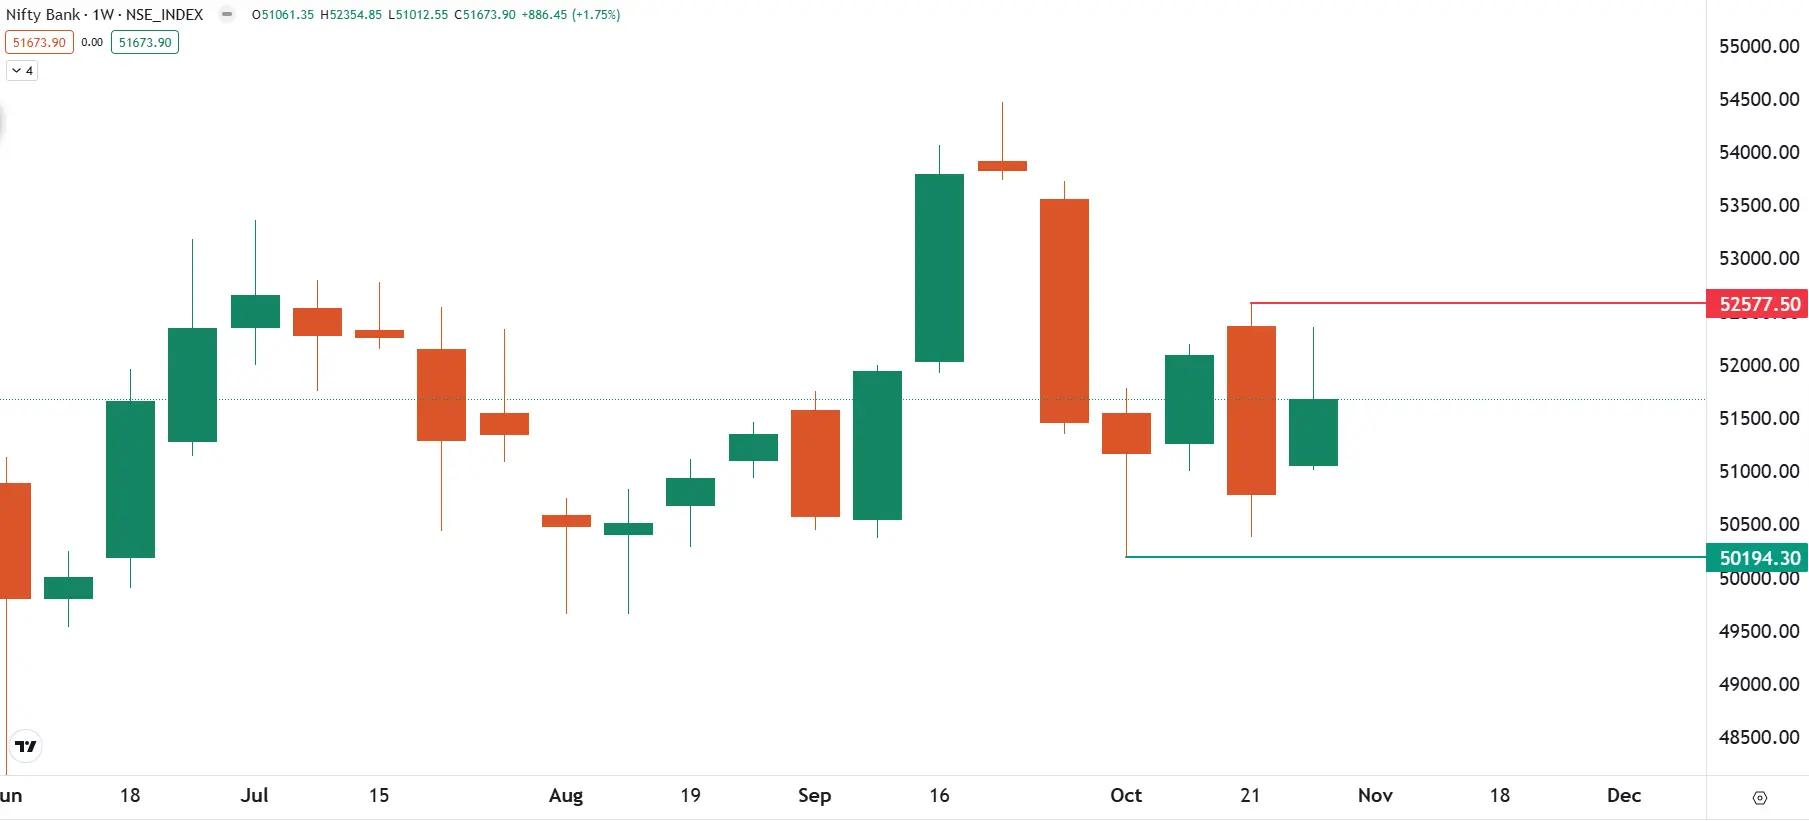
The technical structure of the BANK NIFTY remains range-bound as the index formed an inside candle on the weekly chart. Positional traders can focus on previous week’s high and low. A close above previous week’s high and low will provide further directional clues.
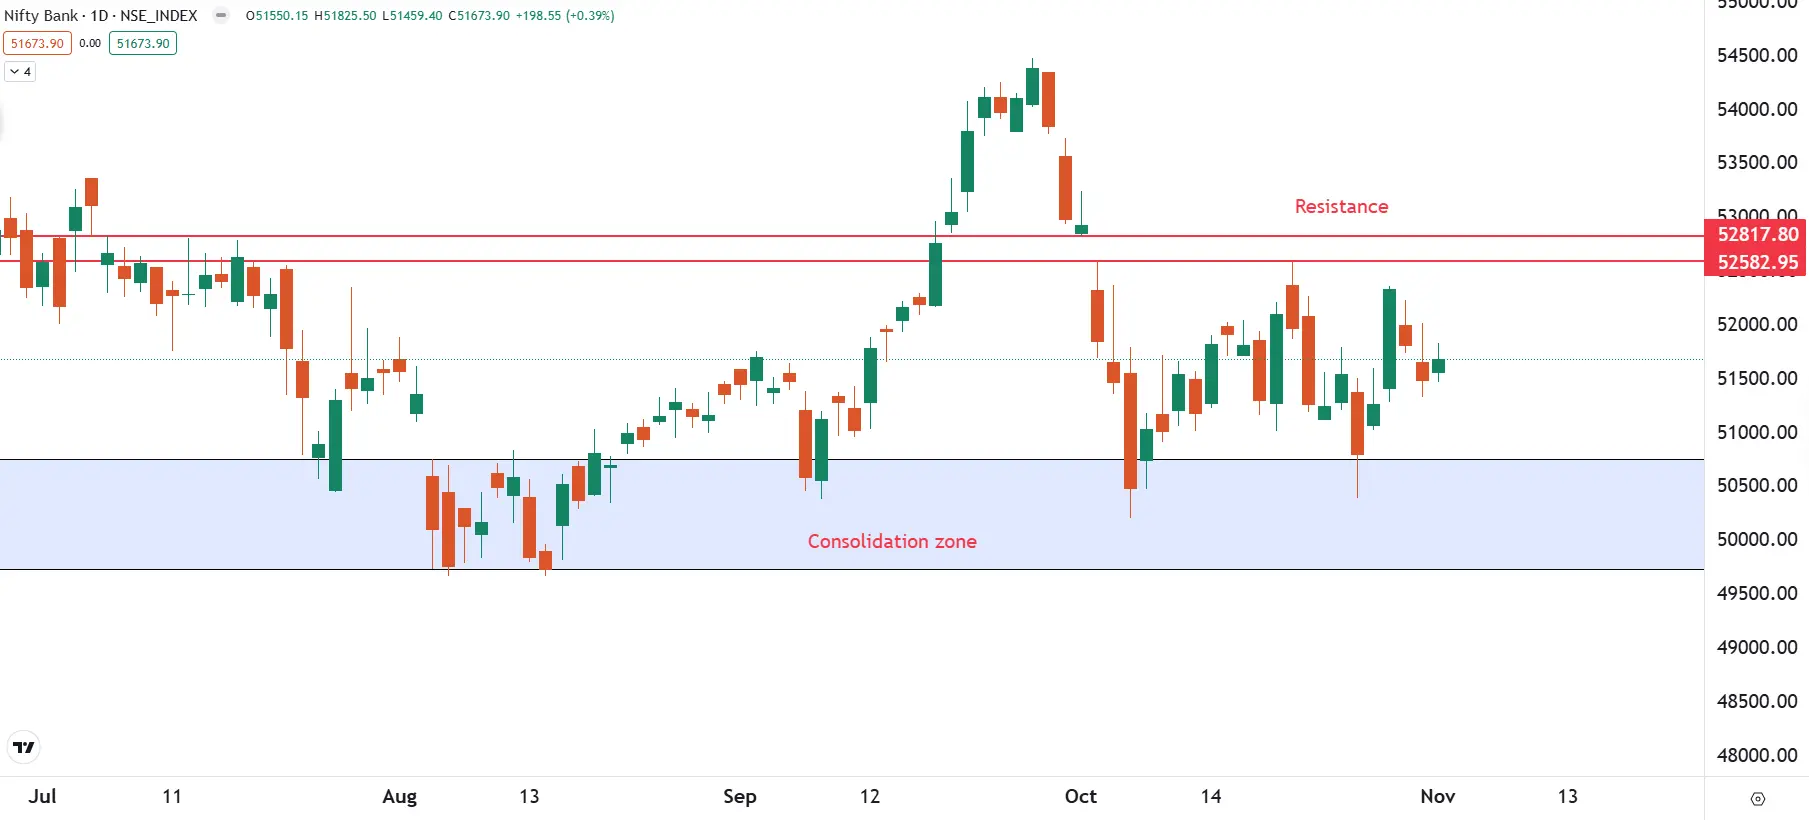
On the daily chart, the index has crucial support around 51,000 zone. If the index closes below this zone, it may slip into the consolidation zone highlighted below on the chart. However, if the index closes above the resistance zone of 52,500 zone, the trend may turn bullish.
FII-DII activity
Stock scanner
Under F&O ban: NIL
In Futures and Options or F&O, long build-up means an increase in Open Interest (OI) along with an increase in price, and short build-up means an increase in Open Interest(OI) along with a decrease in price.
Source: Upstox and NSE.
Disclaimer: Derivatives trading must be done only by traders who fully understand the risks associated with them and strictly apply risk mechanisms like stop-losses. The information is only for consumption by the client and such material should not be redistributed. We do not recommend any particular stock, securities and strategies for trading. The securities quoted are exemplary and are not recommendatory. The stock names mentioned in this article are purely for showing how to do analysis. Take your own decision before investing.
About The Author
Next Story


