Market News
Trade Setup for Nov 14: NIFTY50 ends around 200 EMA, all eyes on the 23,300 support
.png)
4 min read | Updated on November 14, 2024, 07:18 IST
SUMMARY
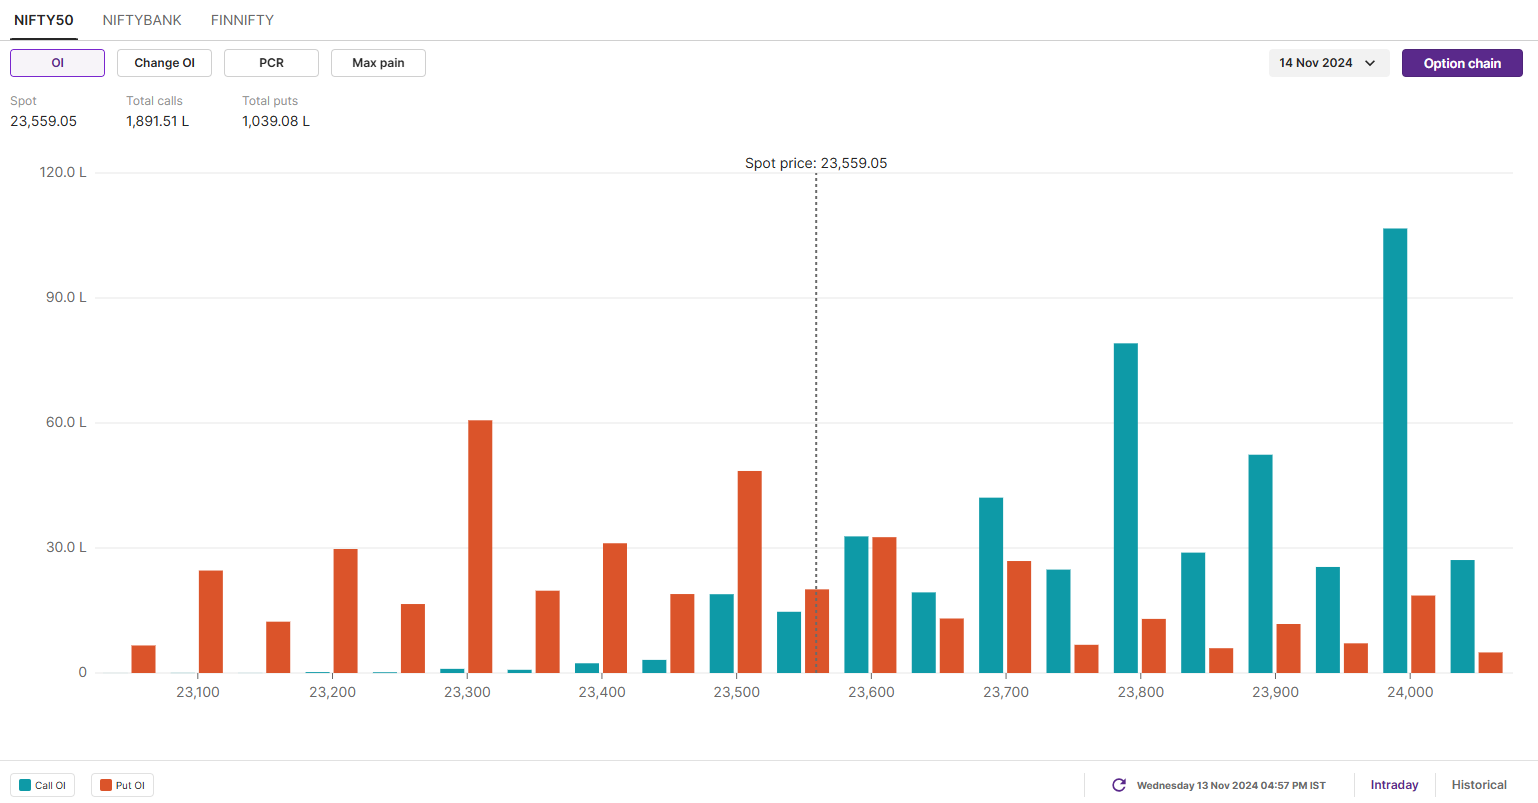
The open interest data for today’s expiry shows that the NIFTY50 index has the highest call base at 23,800 and 24,000 strikes. This means that the index may face resistance around these levels.
Stock list

After a flat start, the NIFTY50 index slipped broke the six day consolidation and ended the day below the immediate support zone of 23,800.
Asian markets @ 7 am
- GIFT NIFTY: 23,626 (-0.07%)
- Nikkei 225: 38,852 (+0.34%)
- Hang Seng: 19,626 (-1%)
U.S. market update
- Dow Jones: 43,958 (▲0.1%)
- S&P 500: 5,985 (▲0.0%)
- Nasdaq Composite: 19,230 (▼0.2%)
U.S. indices ended Wednesday's session on a mixed note as investors digested the latest inflation data, which was in line with Street expectations. The Consumer Price Index rose 2.6% year-on-year in October, up 0.2% from September. Meanwhile, core inflation, which strips out volatile food and energy prices, rose 3.3% YoY, unchanged from September's reading.
NIFTY50
- November Futures: 23,658 (▼1.1%)
- Open Interest: 4,80,488 (▲2.7%)
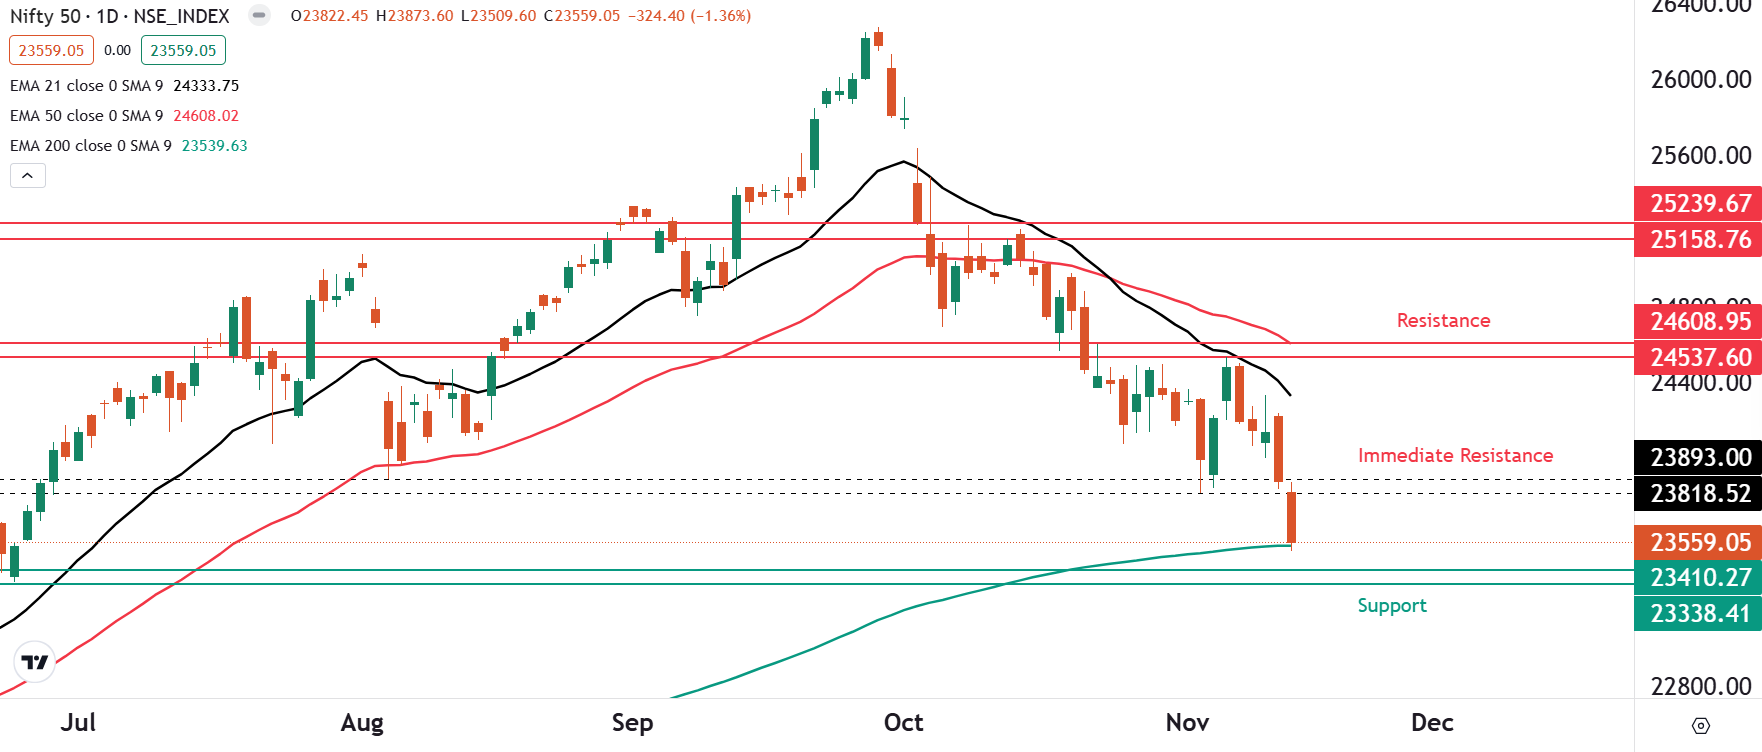
After a flat start, the NIFTY50 index slipped broke the six day consolidation and ended the day below the immediate support zone of 23,800. The index surrendered the August month low on 12 November, hinting weakness in the upcoming sessions.
The technical structure of the index on the daily chart remains weak as it slipped to the 200 exponential moving average (EMA), which is psychologically a crucial support zone. Positionally, traders should monitor the price action around this crucial support zone and avoid the fresh short position as the risk reward remains unfavourable. However, the weakness may extend upto 23,000 levels if the index surrenders 200 EMA on closing basis.

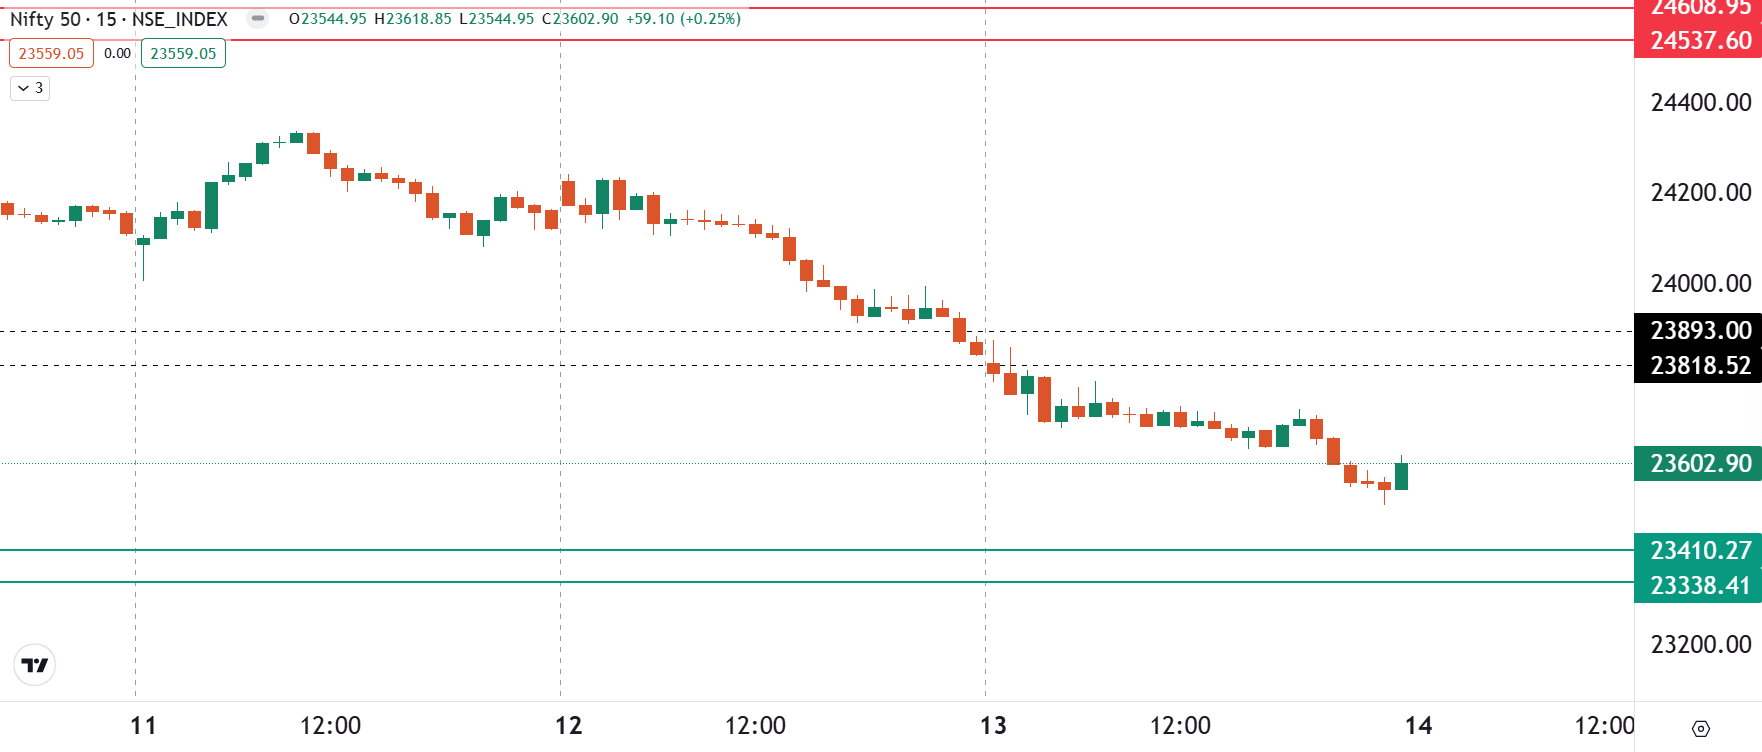
Intraday traders can monitor the range of 23,800 and 23,300 on the 15 minute chart. Unless the index breaks this range with a strong candle on closing basis, the trend may remain range-bound. A break of this range may provide further directional clues.

The open interest data for today’s expiry has significant call build-up at 24,000 and 23,800 strikes, indicating that index may face resistance around these levels. Conversely, the put base was seen at 23,300 with low volume, suggesting immediate support for the index around this zone.

BANK NIFTY
- November Futures: 51,373 (▼1.7%)
- Open Interest: 1,96,202 (▼0.9%)
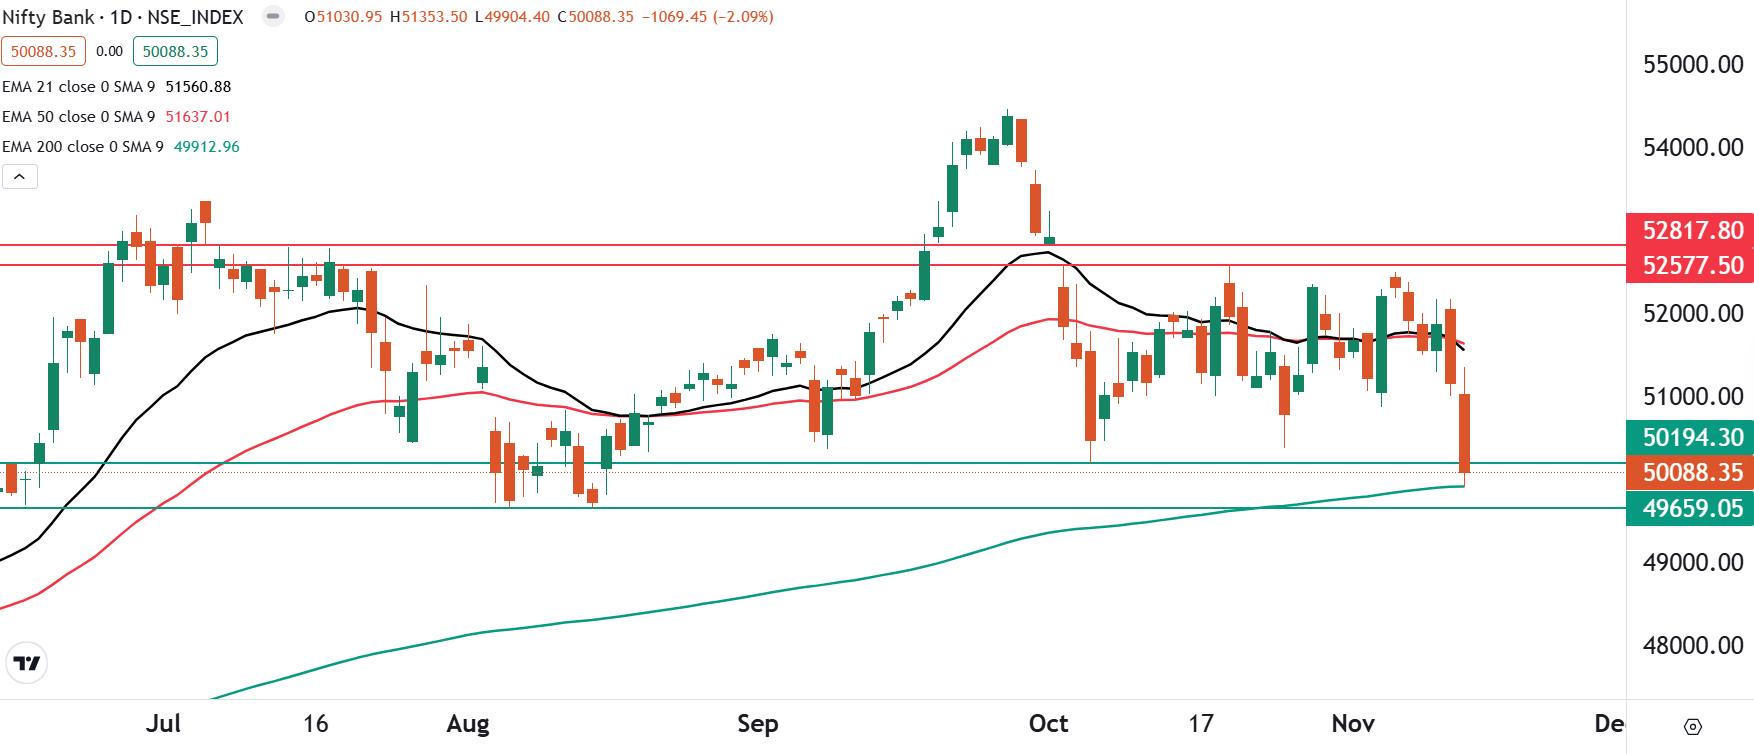
The BANK NIFTY index slipped below the crucial support zones on the last weekly expiry of its options contract, ending Wednesday’s session deep in the red. The index formed a strong bearish candle on the daily chart, confirming the bearish engulfing candle formed on 12 November.
The bearish engulfing is a reversal pattern, which indicates reversal in the trend and weakness. However, the index has taken support at the crucial support zone of 49,600 and 50,000, which also coincides with its 200 EMA. Traders should monitor the price action of the index in this 400 point range, especifically around 49,600. A close below this level will signal further weaknes, while the 51,000 zone will now act as immediate resistance zone for the index.

FII-DII activity
Stock scanner
Long build-up: NIL
Under F&O ban: Aarti Industries, Aditya Birla Fashion and Retail, Gujarat Narmada Valley Fertilizers & Chemicals (GNFC), Granules India and Hindustan Copper
Added under F&O ban: Gujarat Narmada Valley Fertilizers & Chemicals (GNFC)
Out of F&O ban: Manappuram Finance
In Futures and Options or F&O, long build-up means an increase in Open Interest (OI) along with an increase in price, and short build-up means an increase in Open Interest(OI) along with a decrease in price.
Source: Upstox and NSE.
Disclaimer: Derivatives trading must be done only by traders who fully understand the risks associated with them and strictly apply risk mechanisms like stop-losses. The information is only for consumption by the client and such material should not be redistributed. We do not recommend any particular stock, securities and strategies for trading. The securities quoted are exemplary and are not recommendatory. The stock names mentioned in this article are purely for showing how to do analysis. Take your own decision before investing
About The Author
Next Story


