Market News
Trade setup for March 28: NIFTY50 defends key support at 200 EMA, consolidates near 23,600
.png)
4 min read | Updated on March 28, 2025, 07:19 IST


SUMMARY
The NIFTY50 index has maintained positive momentum and is currently trading above all major exponential moving averages such as 21, 50 and 200. If the index holds its key support zone at the 200 EMA (23,400) on a closing basis, it could extend gains towards the 23,800 zone.
Stock list
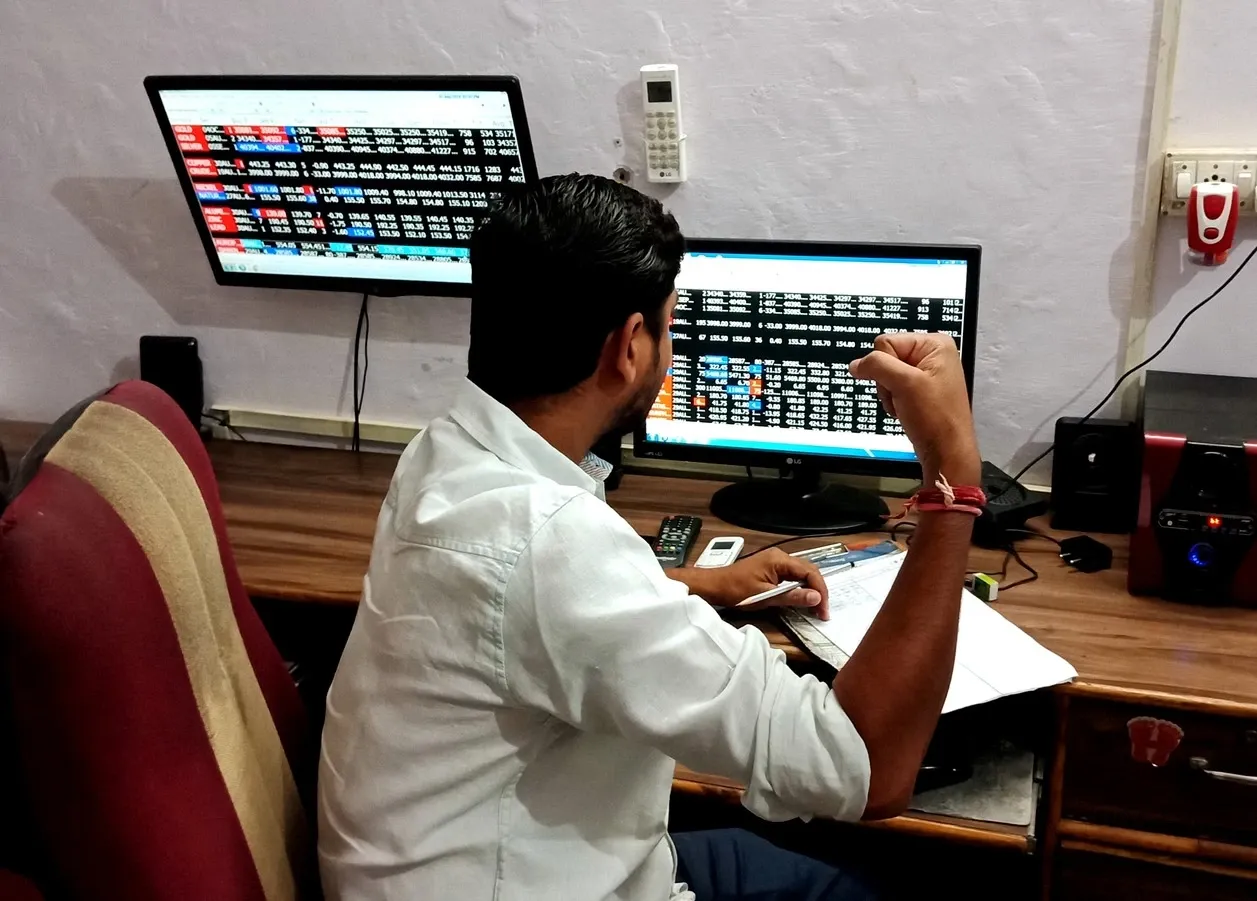
The NIFTY50 index rebounded from the day's low to end the monthly futures and options expiry on a positive note. | Image: Shutterstock
Asian markets @ 7 am
- GIFT NIFTY: 23,758 (-0.01%)
- Nikkei 225: 36,991 (-2.14%)
- Hang Seng: 23,672 (+0.40%)
U.S. market update
- Dow Jones: 42,299 (▼0.3%)
- S&P 500: 5,693 (▼0.3%)
- Nasdaq Composite: 17,804 (▼0.5%)
U.S. markets slipped lower on Thursday as investors reacted to new tariffs on foreign automakers announced by President Trump. The executive order, signed Wednesday, imposes a 25% tariff on foreign-made cars starting in early April.
Investor focus now shifts to February's Personal Consumption Expenditures (PCE) index, the Fed's preferred measure of inflation. Street estimates suggest that PCE inflation may rise to 0.3% for the month, the same as January. Year-on-year inflation is expected to hold steady at 2.5%.
NIFTY50
- Max call OI: 24,000
- Max put OI: 23,500
- (Ten strikes to ATM, 3 April expiry, initial build-up)
The NIFTY50 index rebounded from the day's low to end the monthly futures and options expiry on a positive note. The index protected its key 200-day exponential moving average (EMA) support zone on a closing basis and formed a bullish piercing candlestick pattern on the daily chart.
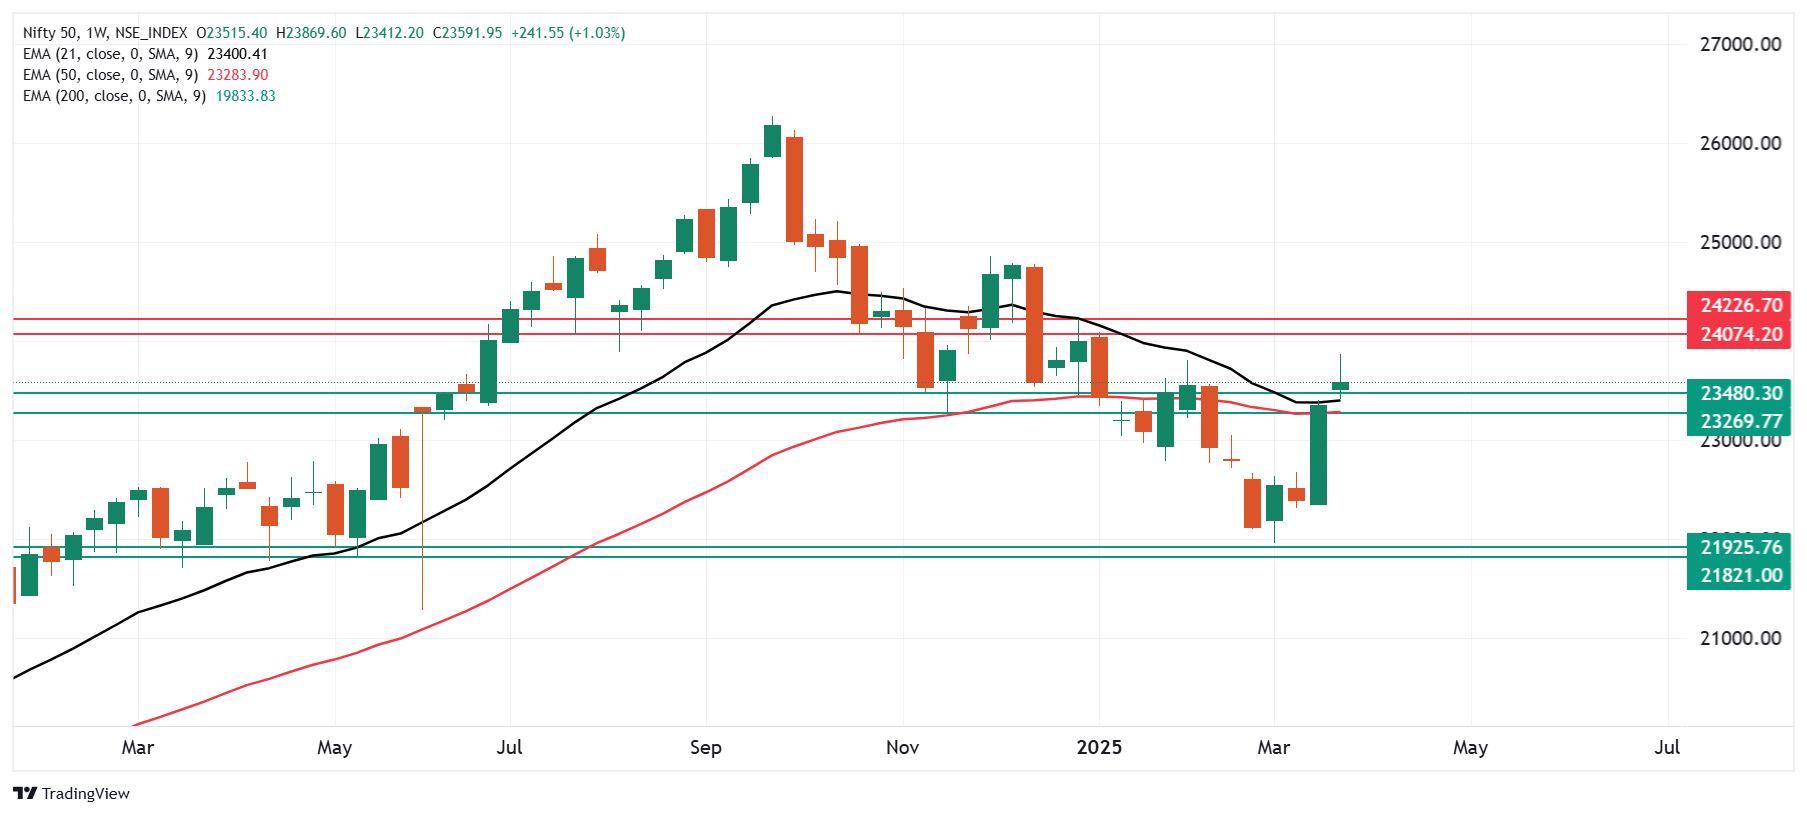
The technical structure of the index on the weekly chart remains bullish as it is trading above the previous week's high. For today's session, traders can closely monitor the index's weekly close. A close above the previous week's high will confirm last week's bullish engulfing pattern, indicating a continuation of the bullish momentum. On the other hand, a close below last week's high will invalidate the bullish reversal pattern.
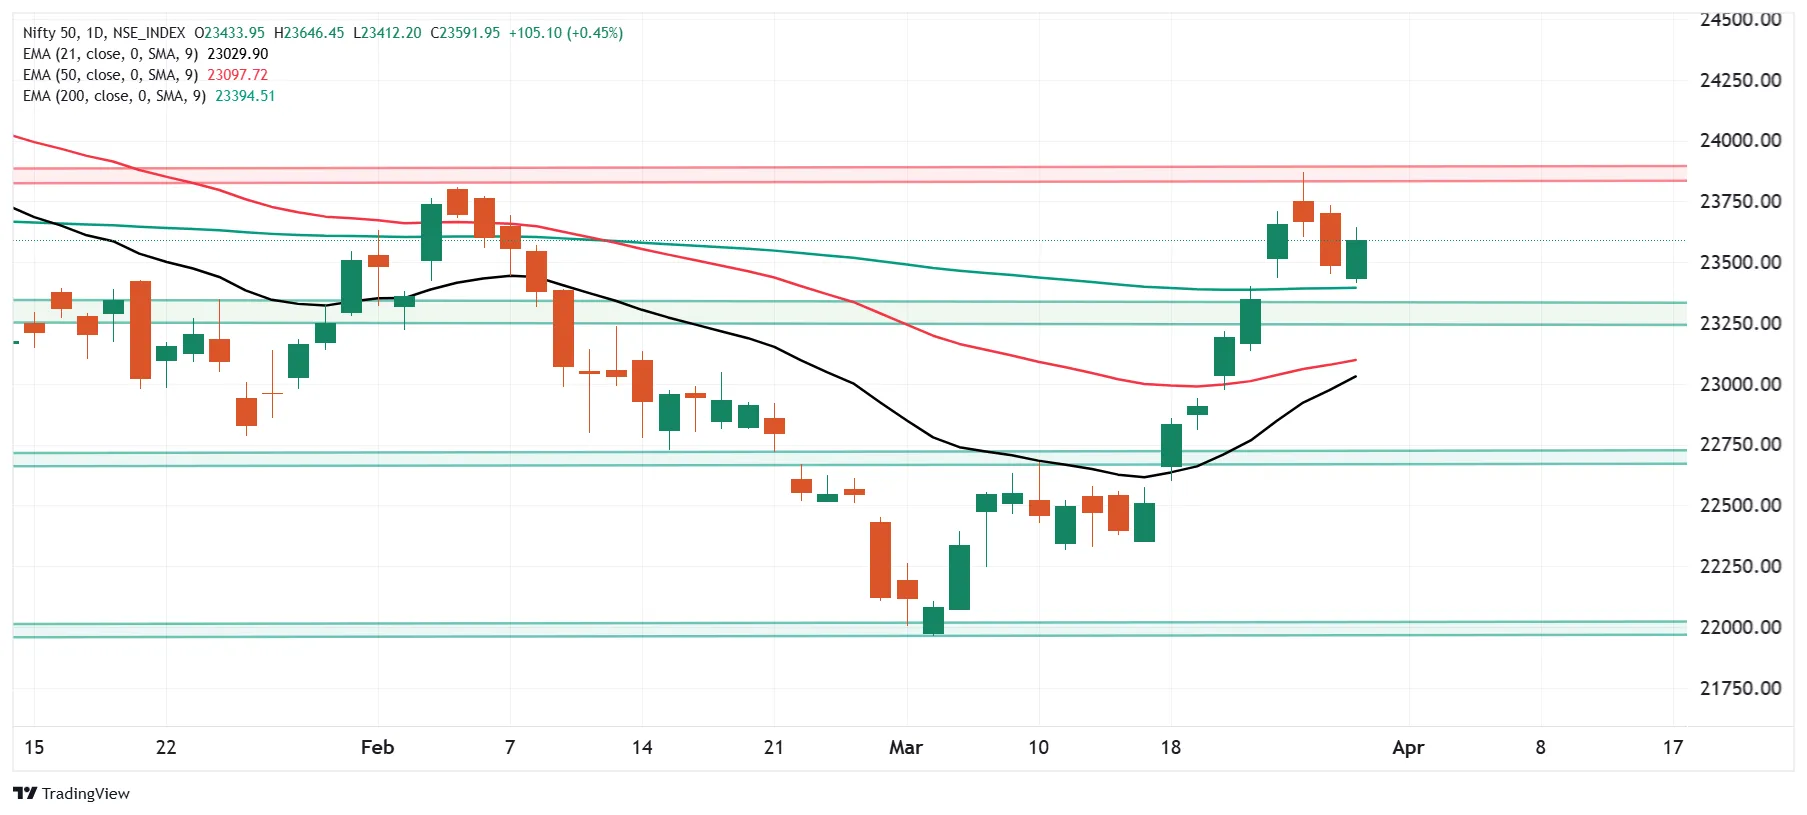
On the daily chart, the index formed a bullish piercing pattern. It is a two-candle reversal signal where a bullish candle closes above the midpoint of the previous bearish candle, indicating potential upward momentum.
However, the pattern gets confirmed if the close of the subsequent candle is above the high of the piercing pattern. Meanwhile, the immediate support near the 23,400 zone, aligning with the 200-day EMA, while resistance stands around 23,850, the February swing high.
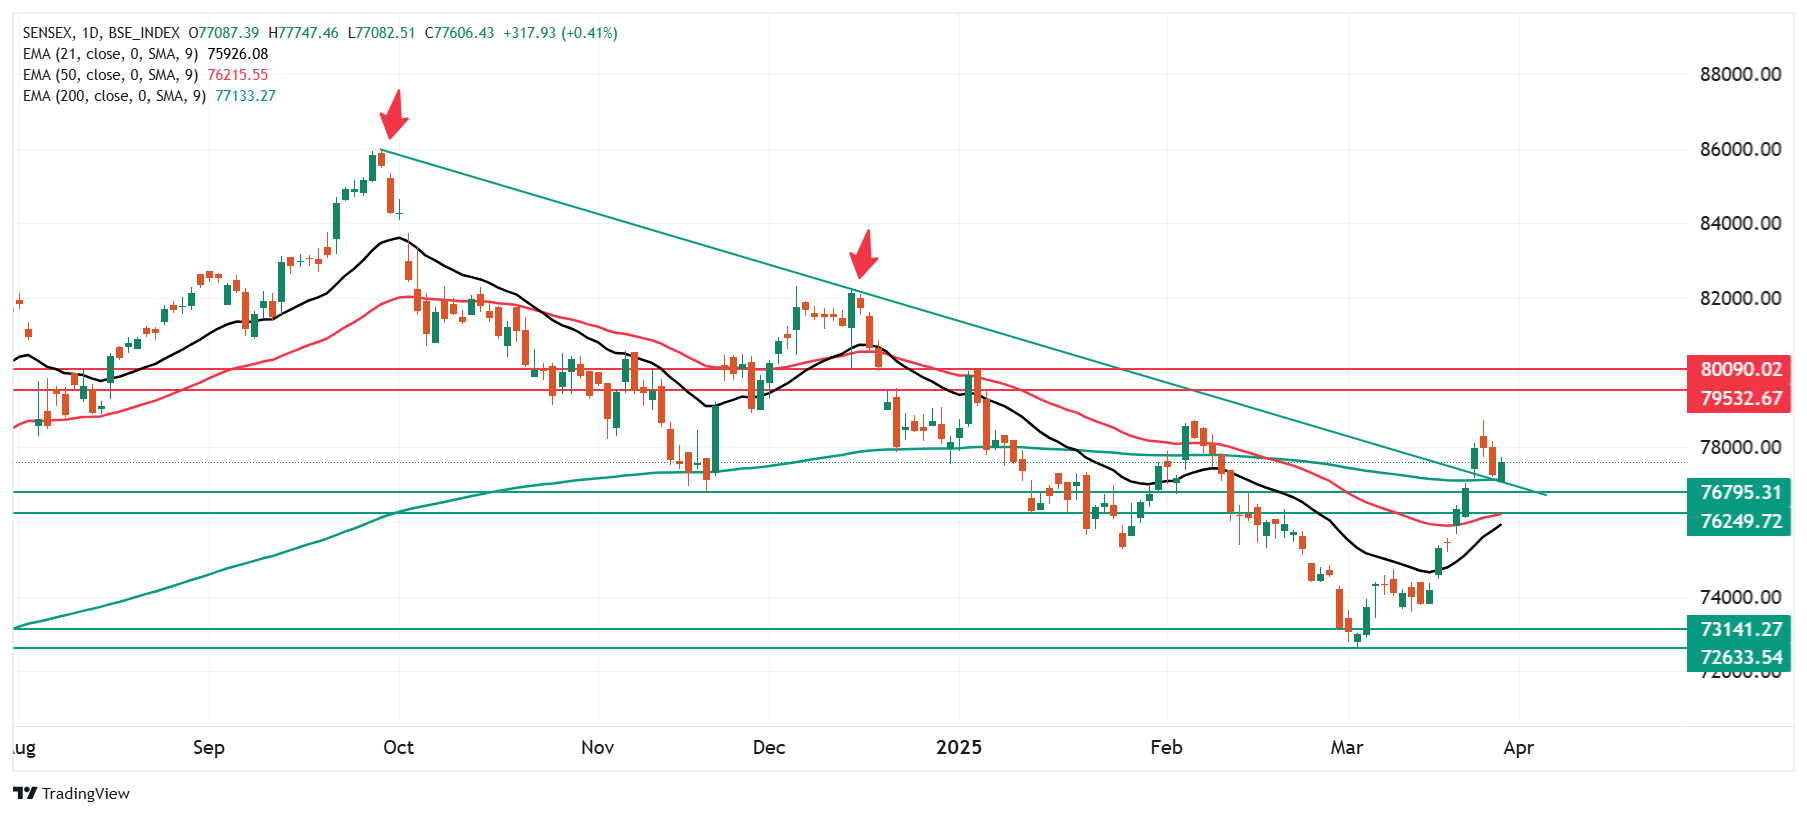
SENSEX
- Max call OI:78,000
- Max put OI:77,000
- (Ten strike to ATM, 1 April Expiry)
After a day of profit booking, the SENSEX bounced back on the 27th of March, rising by more than 300 points. It formed a bullish piercing pattern on the daily chart, indicating support based buying from lower levels.
On the weekly chart, the index is trading above the previous week’s high and 21 and 50 weekly EMAs, indicating continuation of the bullish momentum. A close above previous week’s high will confirm the bullish engulfing candlestick pattern.
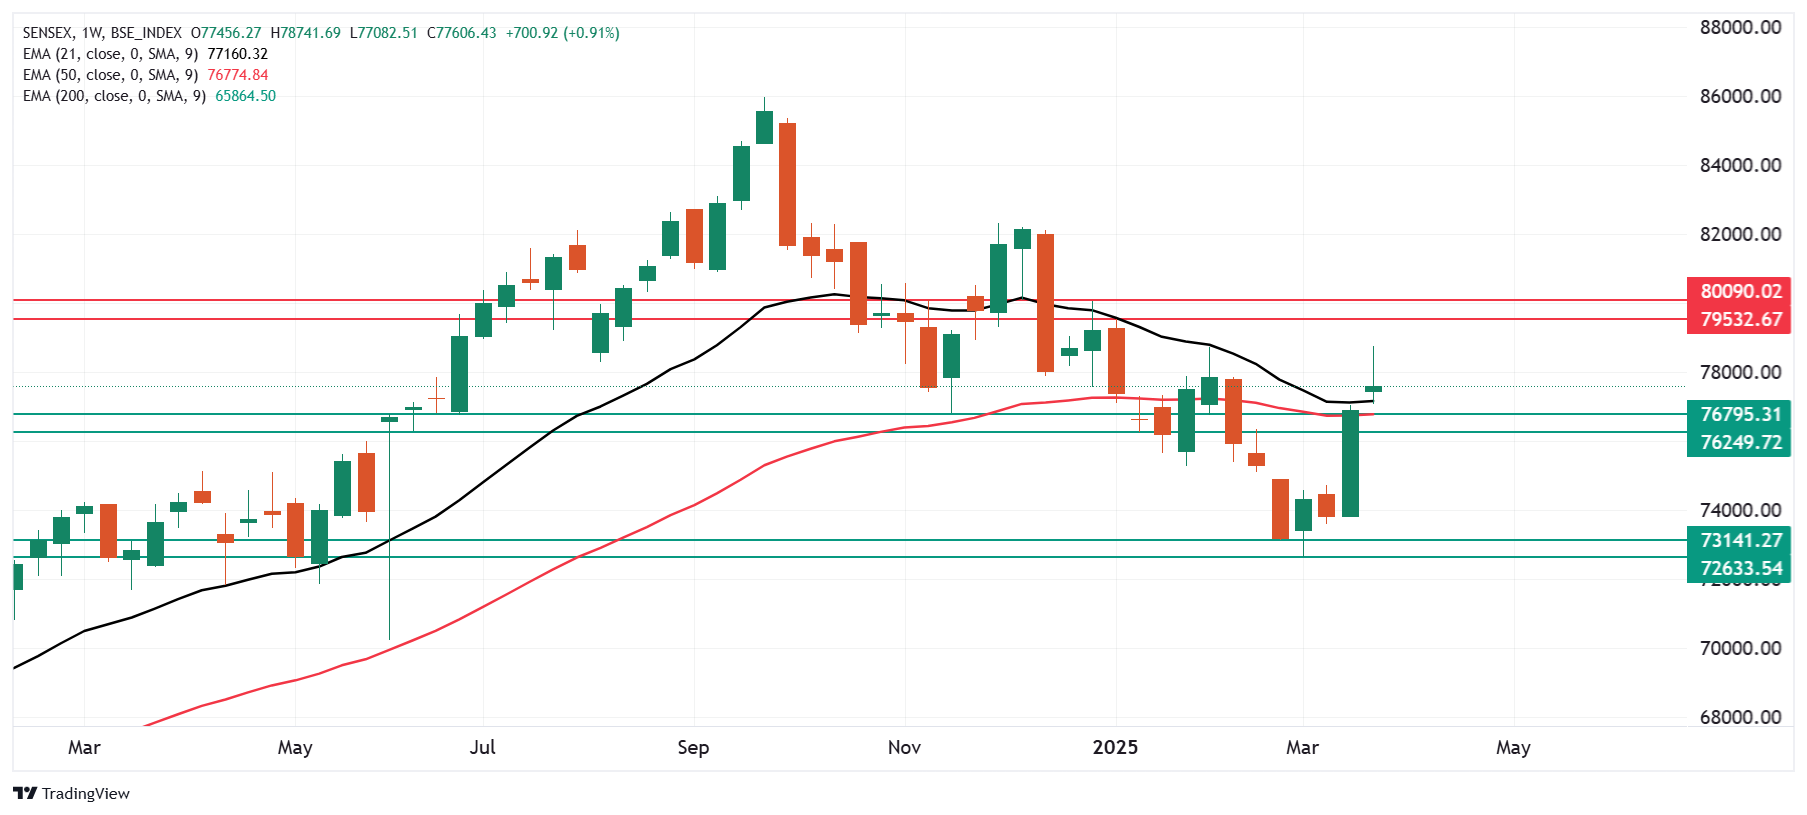
On the daily chart, the index took support around its 200-day EMA (77,133) and retested the downward sloping trendline connecting September and December highs. For the upcoming session, traders can monitor the price action of the index around its 200-day EMA and immediate resistance zone of 78,700. A break above or below these levels on closing basis will provide further directional clues.
FII-DII activity
Stock scanner
- Long build-up: Adani Energy Solutions, Union Bank, BSE, Bajaj Finserv and NTPC
- Short build-up: Tata Motors, AU Small Finance Bank and Indian Hotels
- Top traded futures contracts: HDFC Bank, ICICI Bank, Reliance, Bajaj Finance and Zomato
- Top traded options contracts: SBI 810 CE, HDFC Bank 1700 PE, SBIN 740 PE and Reliance 1220 PE
- Under F&O ban: Nil
In Futures and Options or F&O, long build-up means an increase in Open Interest (OI) along with an increase in price, and short build-up means an increase in Open Interest(OI) along with a decrease in price. Source: Upstox and NSE.
Disclaimer: Derivatives trading must be done only by traders who fully understand the risks associated with them and strictly apply risk mechanisms like stop-losses. The information is only for consumption by the client and such material should not be redistributed. We do not recommend any particular stock, securities and strategies for trading. The securities quoted are exemplary and are not recommendatory. The stock names mentioned in this article are purely for showing how to do analysis. Take your own decision before investing.
About The Author
Next Story


