Market News
Trade setup for March 18: NIFTY50 defends support at 22,300, eyes 21 EMA for next move
.png)
4 min read | Updated on March 18, 2025, 07:30 IST


SUMMARY
Over the past five trading sessions, the NIFTY50 index has been consolidating within the 22,700 to 22,300 range. A decisive breakout from this zone, either through a closing basis or a strong candle, will offer traders clearer directional insights.
Stock list

The NIFTY50 index started the Monday’s session on a positive note and reclaimed its 10-day exponential moving average on the daily chart (EMA). | Image: Shutterstock
Asian markets @ 7 am
- GIFT NIFTY: 22,738 (+0.58%)
- Nikkei 225: 37,955.92 (+1.50%)
- Hang Seng: 24,612.79 (+1.94%)
U.S. market update
- Dow Jones: 41,841 (▲0.8%)
- S&P 500: 5,675 (▲0.6%)
- Nasdaq Composite: 17,808 (▲0.3%)
U.S. indices continued their rebound for a second straight day after a four-week slump driven by tariff announcements from the U.S. President Donald Trump and declining consumer confidence. On Monday, investors found some relief in February’s retail sales data, which showed a 0.2% increase—below the expected 0.6% but still a positive signal.
Attention now turns to the Federal Reserve’s two-day meeting beginning Tuesday, where policymakers are expected to keep interest rates steady between 4.25% and 4.50%.
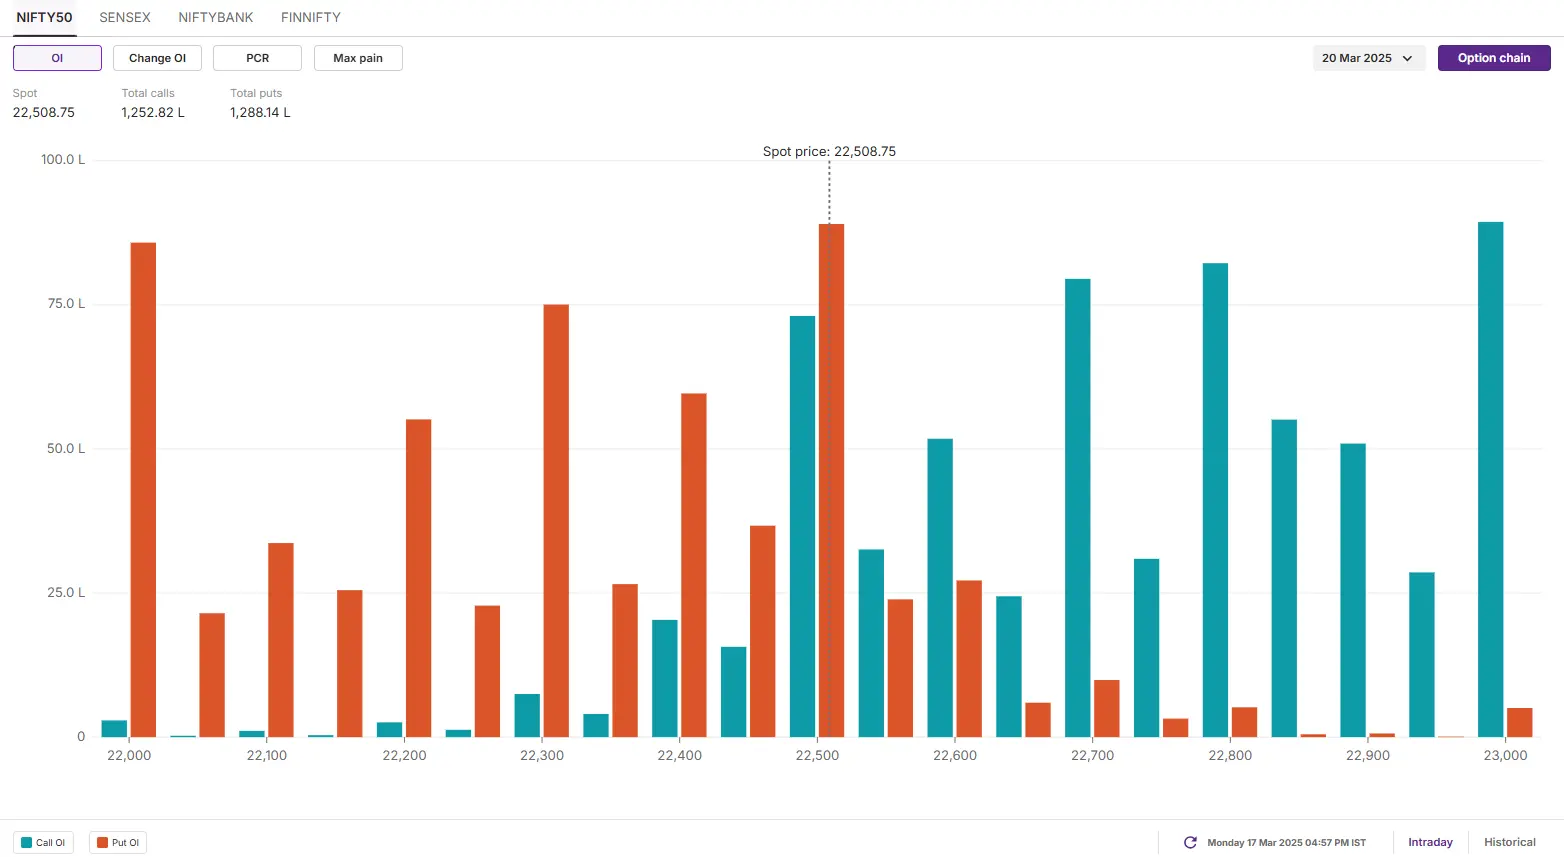
NIFTY50
- Max call OI: 23,000
- Max put OI: 22,000
- (10 Strikes from ATM, Expiry: 20 March)
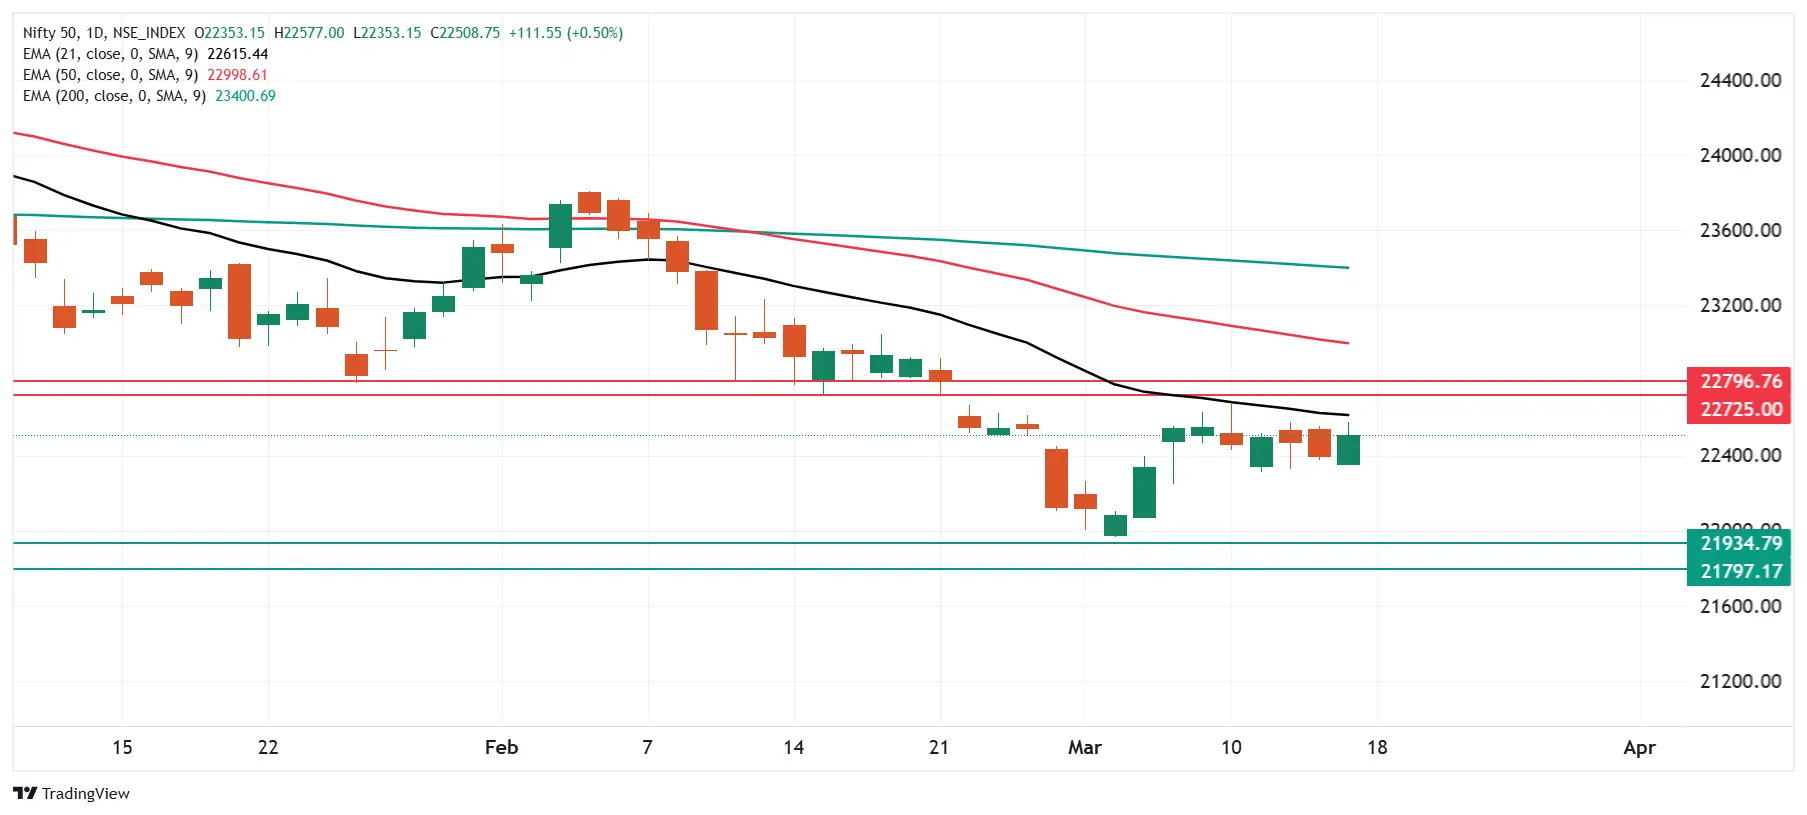
The NIFTY50 index started the Monday’s session on a positive note and reclaimed its 10-day exponential moving average on the daily chart (EMA). It formed a bullish candle on the daily chart, protecting the crucial support zone of 22,300 on a closing basis.
The broader trend of the index remains weak as the index is currently trading below all its key EMAs like 21, 50 and 200. It is currently consolidating between the range of 22,300 and 22,800 for the past five trading sessions. For the short-term directional clues, traders can monitor the break of this range on a closing basis. A breakout above or below these levels will provide further clues.
The open interest data for the March 20th expiry saw significant put options base at 22,500 and 22,300 strikes, pointing at support for the index around these levels. On the flip side, highest call option OI was observed at 23,000 and 22,800 strikes, suggesting resistance for the index around these strikes.
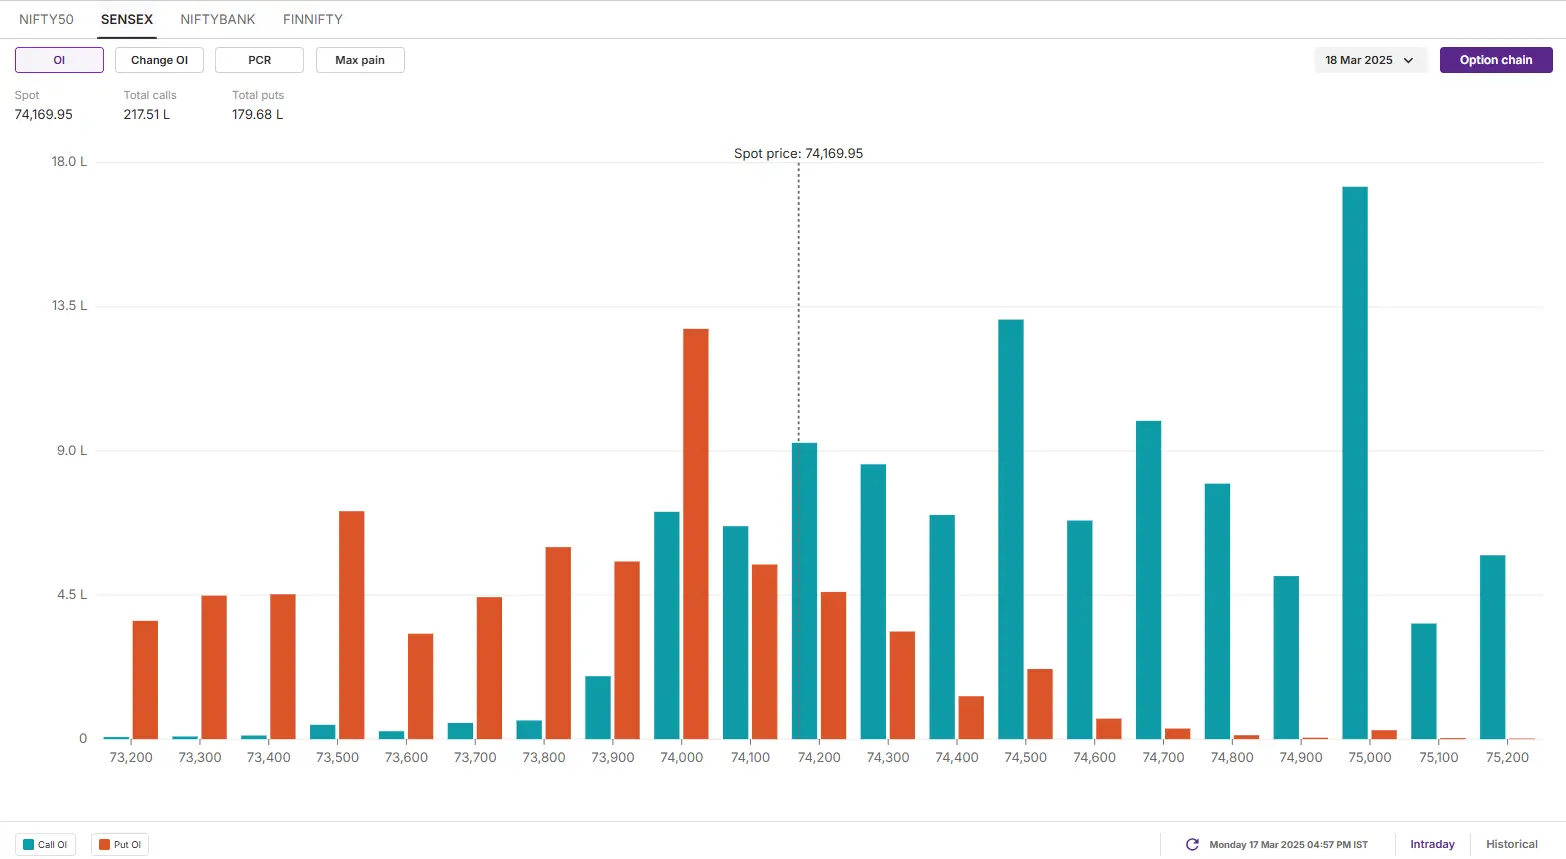
SENSEX
- Max call OI: 75,000
- Max put OI: 74,000
- (10 Strikes from ATM, Expiry: 18 March)
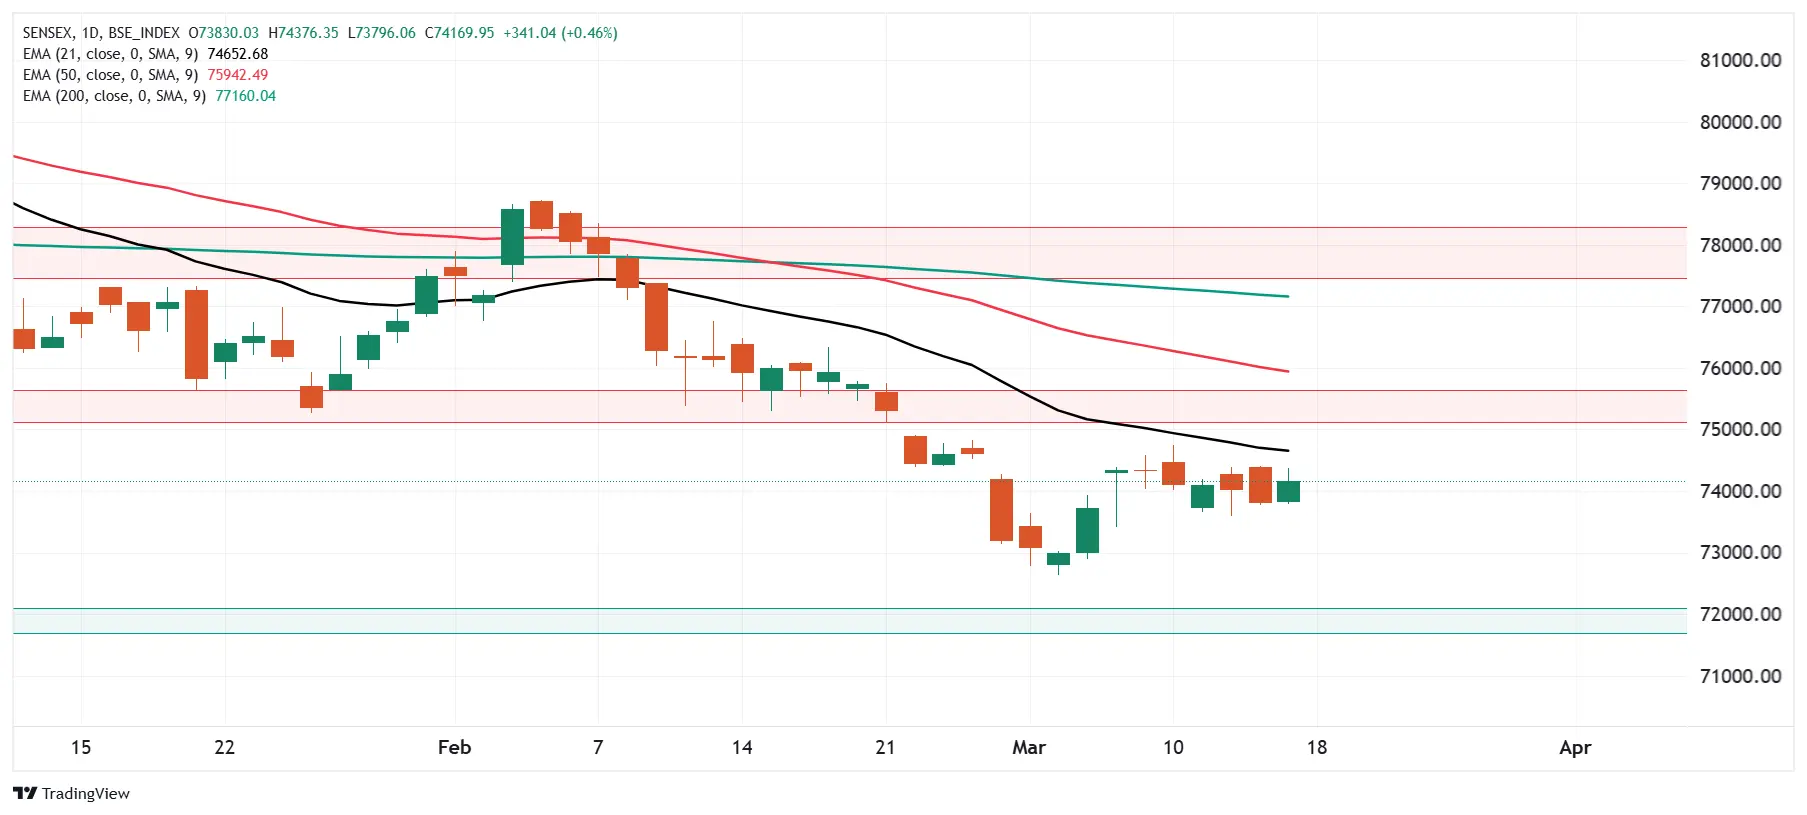
The SENSEX also started the Monday’s session on a positive note and sustained its opening gains throughtout the session. The index reclaimed its 10-day EMA on the daily chart and formed a inside candle on the daily chart.
The technical structure of the index as per the daily chart remains range-bound with immediate support around the 72,700 zone and resistance around 77,300 level. Unless the index breaks this range on a closing basis, the trend may remain sideways.
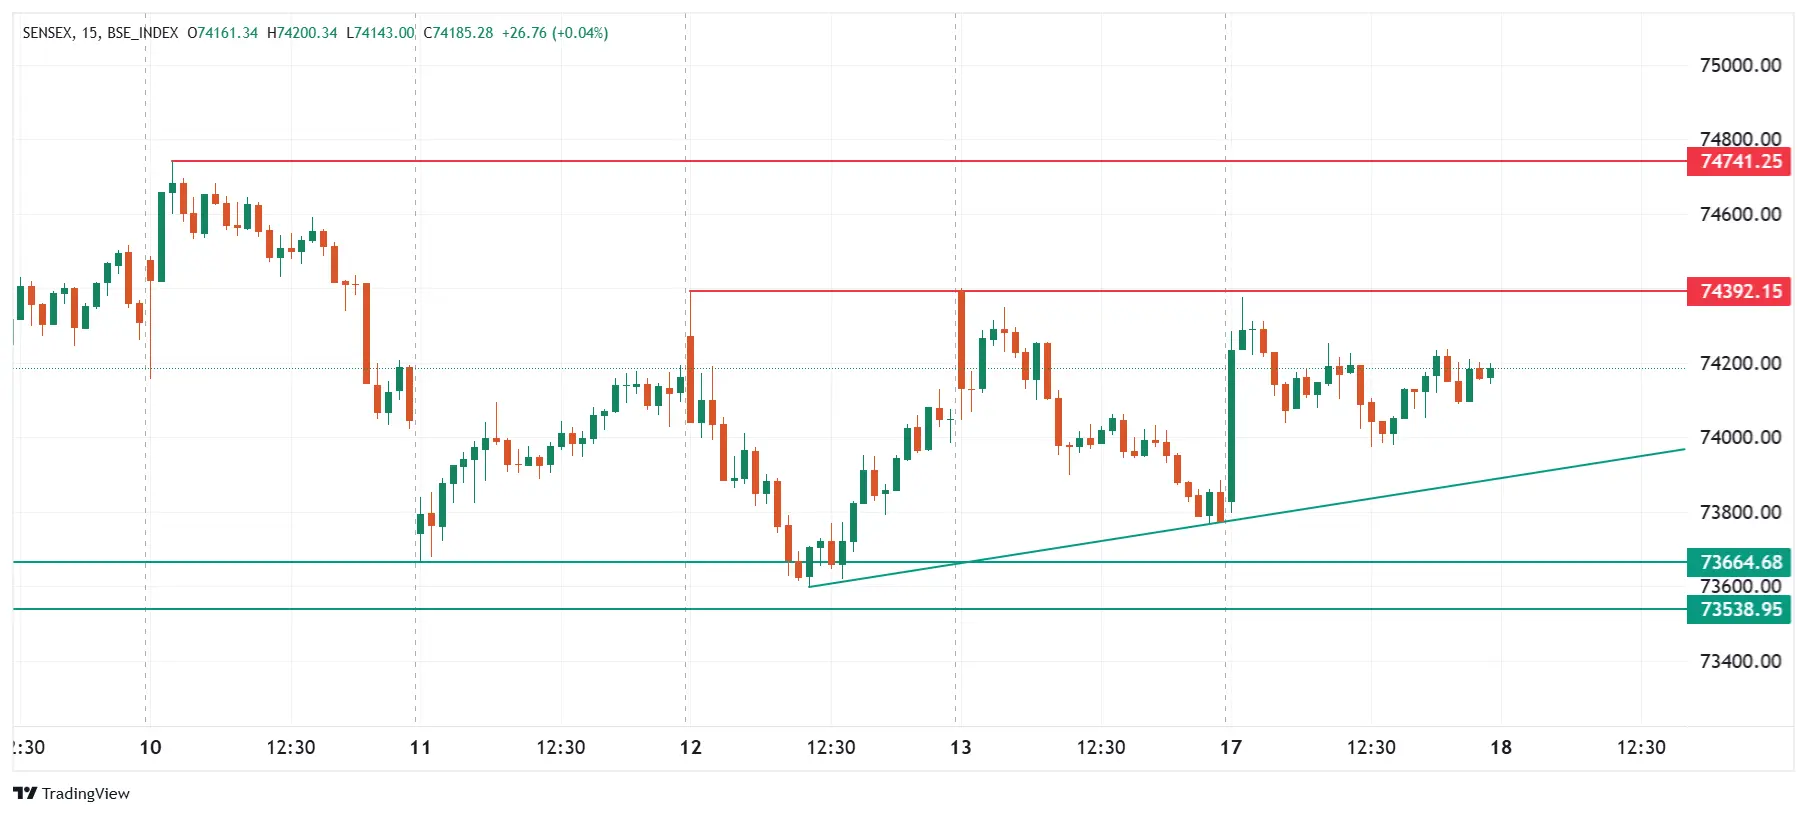
For today’s expiry, traders can monitor the price action of the index between the range of 74,400 and 73,500. Within this range, the trend of the index remains range-bound. However, breakout of this range with a strong candle and on a closing basis will provide further directional insights.
Meanwhile, the open interest data for today’s SENSEX expiry saw highest call options build-up at 75,000 strike. This indicates that the index may face resistance around this level. On the other hand, the put options base was established at 74,000 strike, pointing at support for the index around this level.
FII-DII activity
Stock scanner
- Long build-up: Muthoot Finance, Bajaj Finserv, PB Fintech (Policy Baazar), Jubilant FoodWorks and Dr Reddy’s Laboratories
- Short build-up: LTIMindtree, Tube Investments of India, AU Small Finance Bank and IIFL
- Top traded futures contracts: Reliance Industries, HDFC Bank, ICICI Bank, Bajaj Finance and Bajaj Finserv
- Top traded options contracts: Bajaj Finance 8,600 CE, MCX 5,000 CE, Trent 5,100 CE, Dixon 13,500 CE and Trent 5,000 CE
- Under F&O ban: BSE, Hindustan Copper, IndusInd Bank, Manappuram Finance and Steel Authority of India
In Futures and Options or F&O, long build-up means an increase in Open Interest (OI) along with an increase in price, and short build-up means an increase in Open Interest(OI) along with a decrease in price. Source: Upstox and NSE.
Disclaimer: Derivatives trading must be done only by traders who fully understand the risks associated with them and strictly apply risk mechanisms like stop-losses. The information is only for consumption by the client and such material should not be redistributed. We do not recommend any particular stock, securities and strategies for trading. The securities quoted are exemplary and are not recommendatory. The stock names mentioned in this article are purely for showing how to do analysis. Take your own decision before investing.
About The Author
Next Story


