Market News
Trade setup for March 10: NIFTY50 sustains above 10-EMA, sets sight on the resistance zone of 22,800
.png)
4 min read | Updated on March 10, 2025, 07:21 IST


SUMMARY
The options data for NIFTY50’s 3 March expiry saw call open interest (OI) buildup at the 22,800 strike and a strong put OI base at the 22,300 strike. This positioning suggests that the index is expected to trade within this range. A breakout beyond these levels could offer clearer directional signals for the market.
Stock list

The NIFTY50 index sustained its gains and ended the third consecutive session in green. | Image: PTI
Asian markets @ 7 am
- GIFT NIFTY: 22,601 (-0.12%)
- Nikkei 225: 36,994 (+0.29%)
- Hang Seng: 24,115 (-0.48%)
U.S. market update
- Dow Jones: 42,801 (▲0.5%)
- S&P 500: 5,770 (▲0.5%)
- Nasdaq Composite: 18,196 (▲0.7%)
U.S. indices ended the Friday’s volatile session on a positive note as investors digested the jobs report of February. However, the S&P500 slipped over 3% for the week, registering its biggest weekly decline since September 2024.
Meanwhile, the non-farm payrolls report showed an addition of 1,51,000 jobs in February, falling slightly short of the estimated 1,60,000. The unemployment rate inched up from 4% to 4.1%. This data follows a volatile week for the markets, driven by a barrage of tariff policy announcements and subsequent rollbacks by the U.S. President concerning Canada and Mexico.
NIFTY50
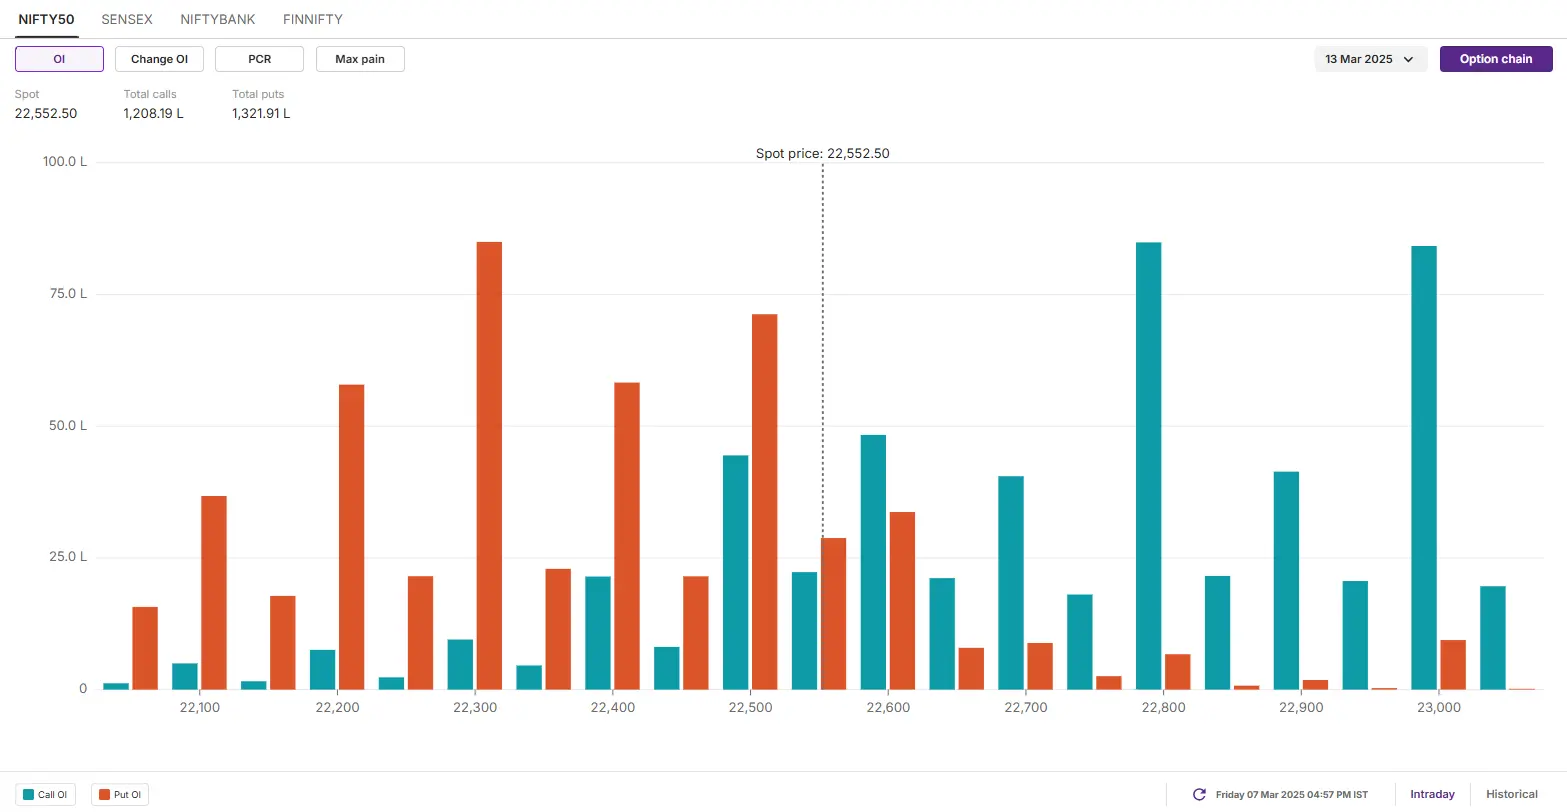
- Max call OI: 22,800
- Max put OI: 22,300
- (10 Strikes from ATM, Expiry: 13 March)
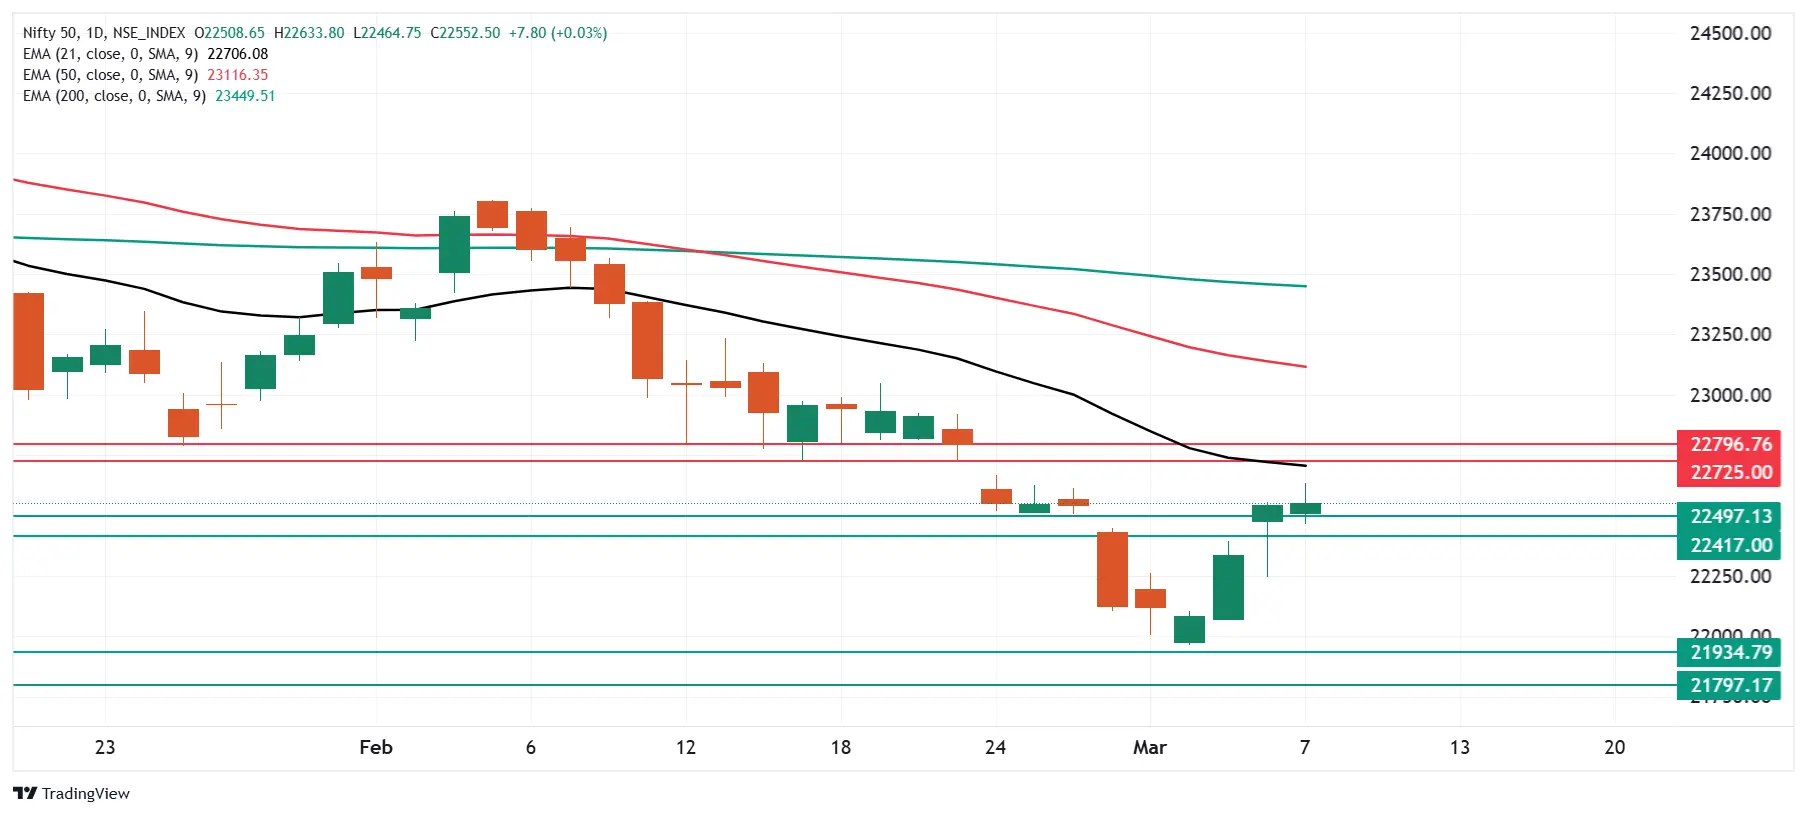
The NIFTY50 index sustained its gains and ended the third consecutive session in green. It ended the Friday’s session on a flat note, forming a doji candlestick pattern on the daily chart. The stability of the market was led by gains in index heavyweight Reliance Industries and metal stocks.
On the daily chart, the index protected its immediate support zone of 22,450 along with 10-day exponential moving average (EMA). As highlighted on the chart below, the index is approaching the immediate resistance zone of 22,800, coinciding with its 21-EMA. A close below this zone and 21-EMA will further fuel the positive sentiment. However, a reversal and rejection from this zone will signal weakness.
The open interest (OI) data for the 13 March expiry saw significant call OI base was seen at 22,800 strike, indicating resistance for the index around this zone. Meanwhile, the put OI base was observed at 22,300 strike, suggesting support for the index around this level.
SENSEX
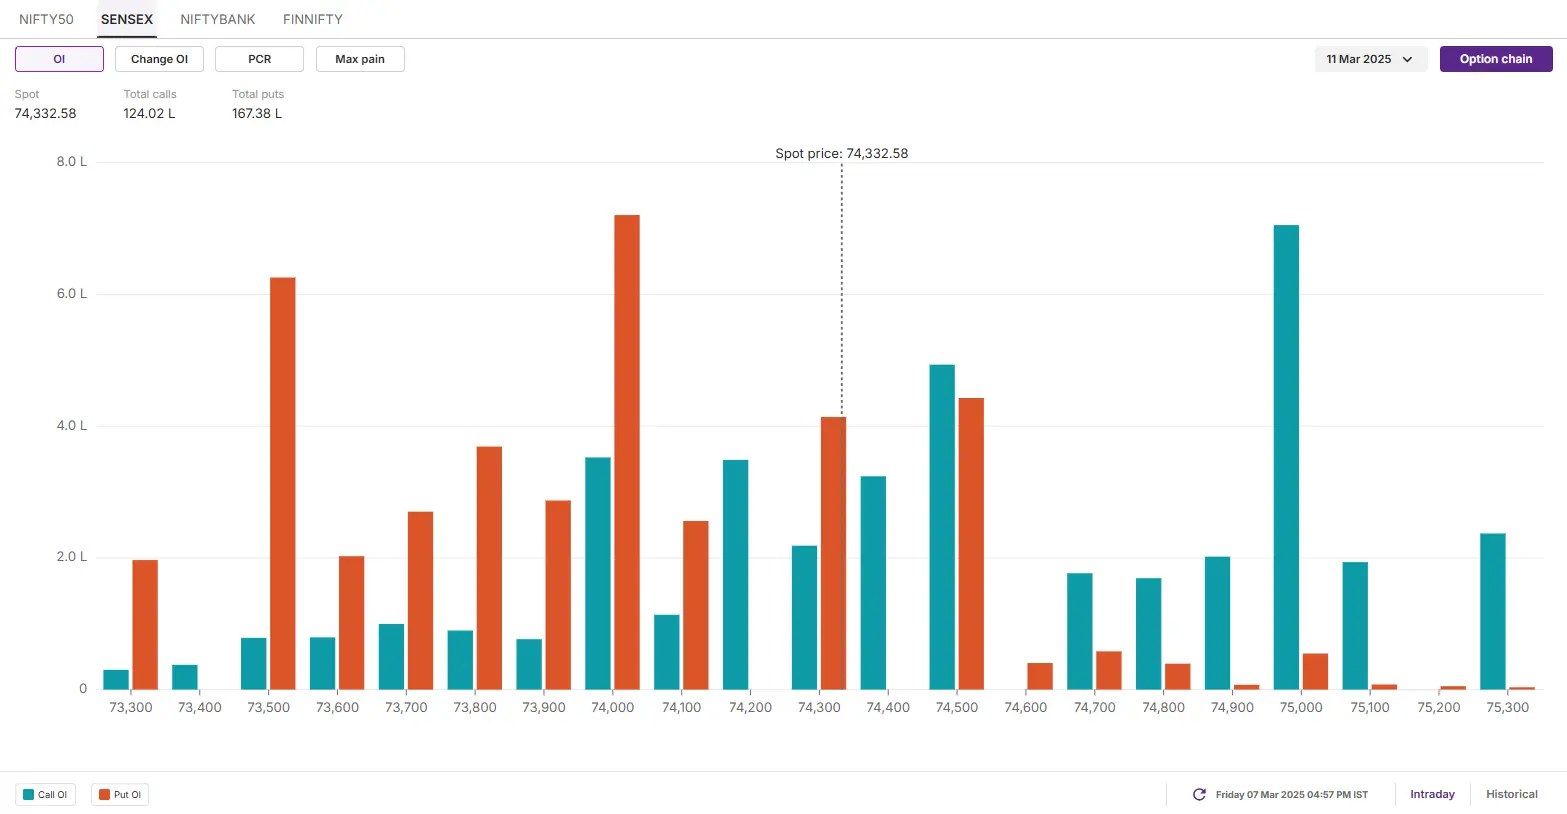
- Max call OI: 75,000
- Max put OI: 74,000
- (10 Strikes from ATM, Expiry: 11 March)
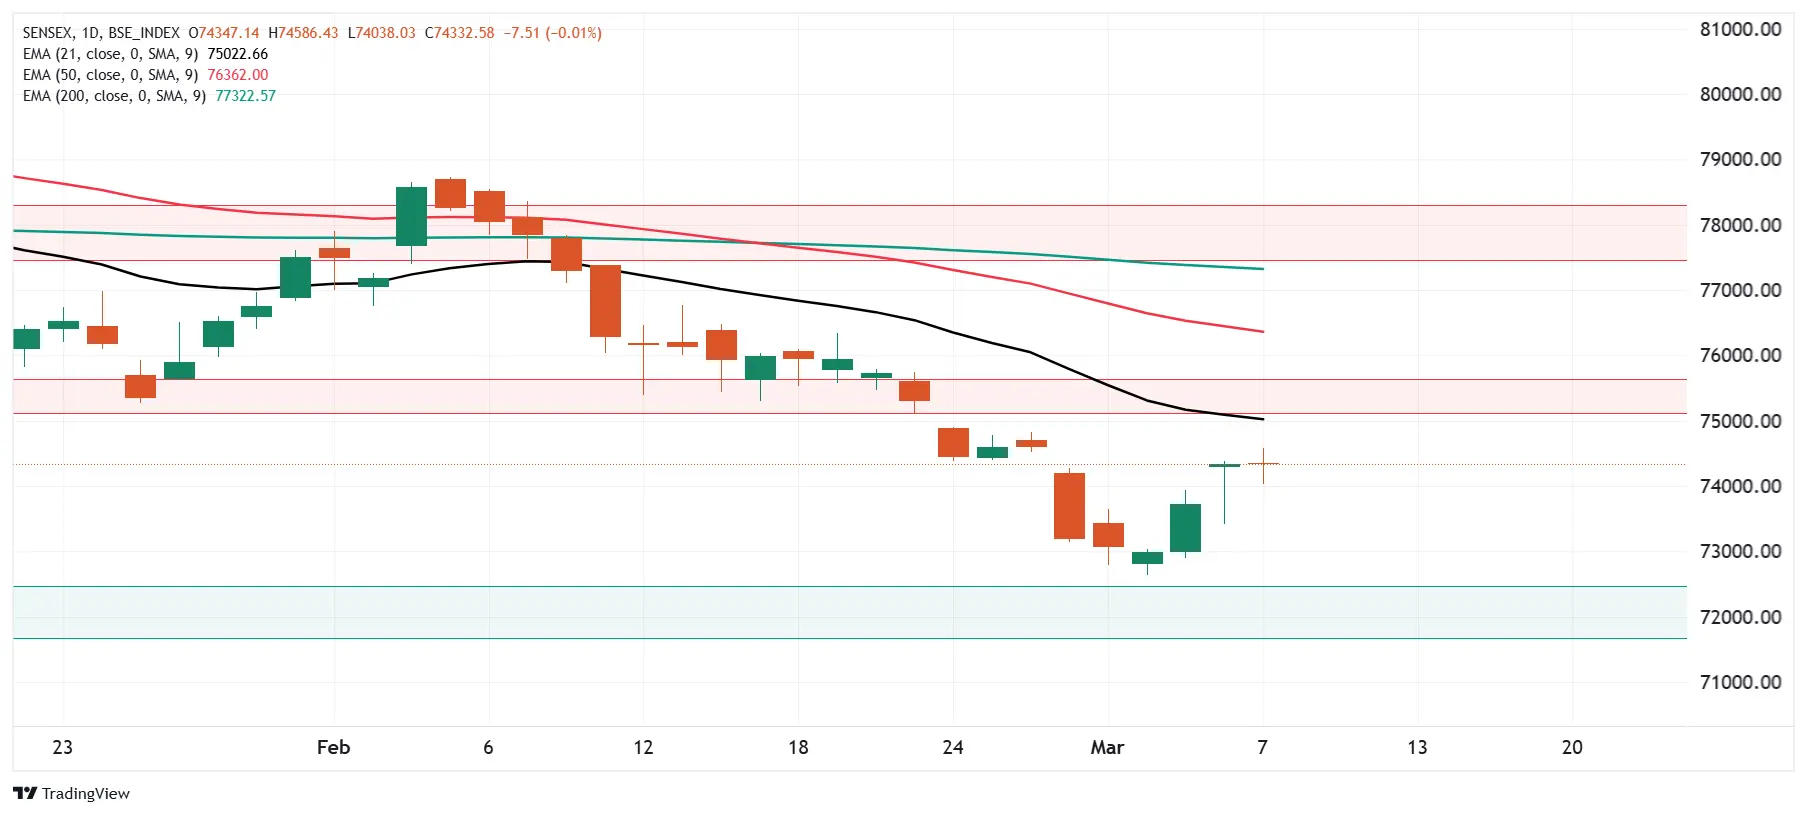
The SENSEX consolidated in a narrow range and formed a doji candlestick pattern on the daily chart on Friday. The technical structure of the index as per the daily chart remains sideways to bullish as the index sustained its gains of the previous two sessions.
For the upcoming sessions, traders can monitor the resistance zone of 21 EMA, around the 75,000 zone. If the index reclaims this zone, it may extend the gains towards 50-EMA. Meanwhile, the immediate support for the index is around the 72,700 zone.
The open interest (OI) data for the 11 March expiry saw significant call OI base was seen at 75,000 strike, suggesting resistance for the index around this zone. Conversely, the put base was seen at 74,000 strike, indicating immediate support for the index around this level.
FII-DII activity
Stock scanner
- Long build-up: Titagarh Wagons and Apollo Tyres
- Short build-up: Kalyan Jewellers, Oracle Financial Services Software, IndusInd Bank, Nykaa and Escorts
- Top traded futures contracts: Reliance Industries, HDFC Bank, IndusInd Bank, Infosys and ICICI Bank
- Top traded options contracts: Reliance 1250 CE, SRF 2900 CE, BSE 4300 CE, HDFC Bank 1700 CE and Bajaj Auto 7600 CE
- Under F&O ban: Hindustan Copper and Manappuram Finance
In Futures and Options or F&O, long build-up means an increase in Open Interest (OI) along with an increase in price, and short build-up means an increase in Open Interest(OI) along with a decrease in price. Source: Upstox and NSE.
Disclaimer: Derivatives trading must be done only by traders who fully understand the risks associated with them and strictly apply risk mechanisms like stop-losses. The information is only for consumption by the client and such material should not be redistributed. We do not recommend any particular stock, securities and strategies for trading. The securities quoted are exemplary and are not recommendatory. The stock names mentioned in this article are purely for showing how to do analysis. Take your own decision before investing.
About The Author
Next Story


