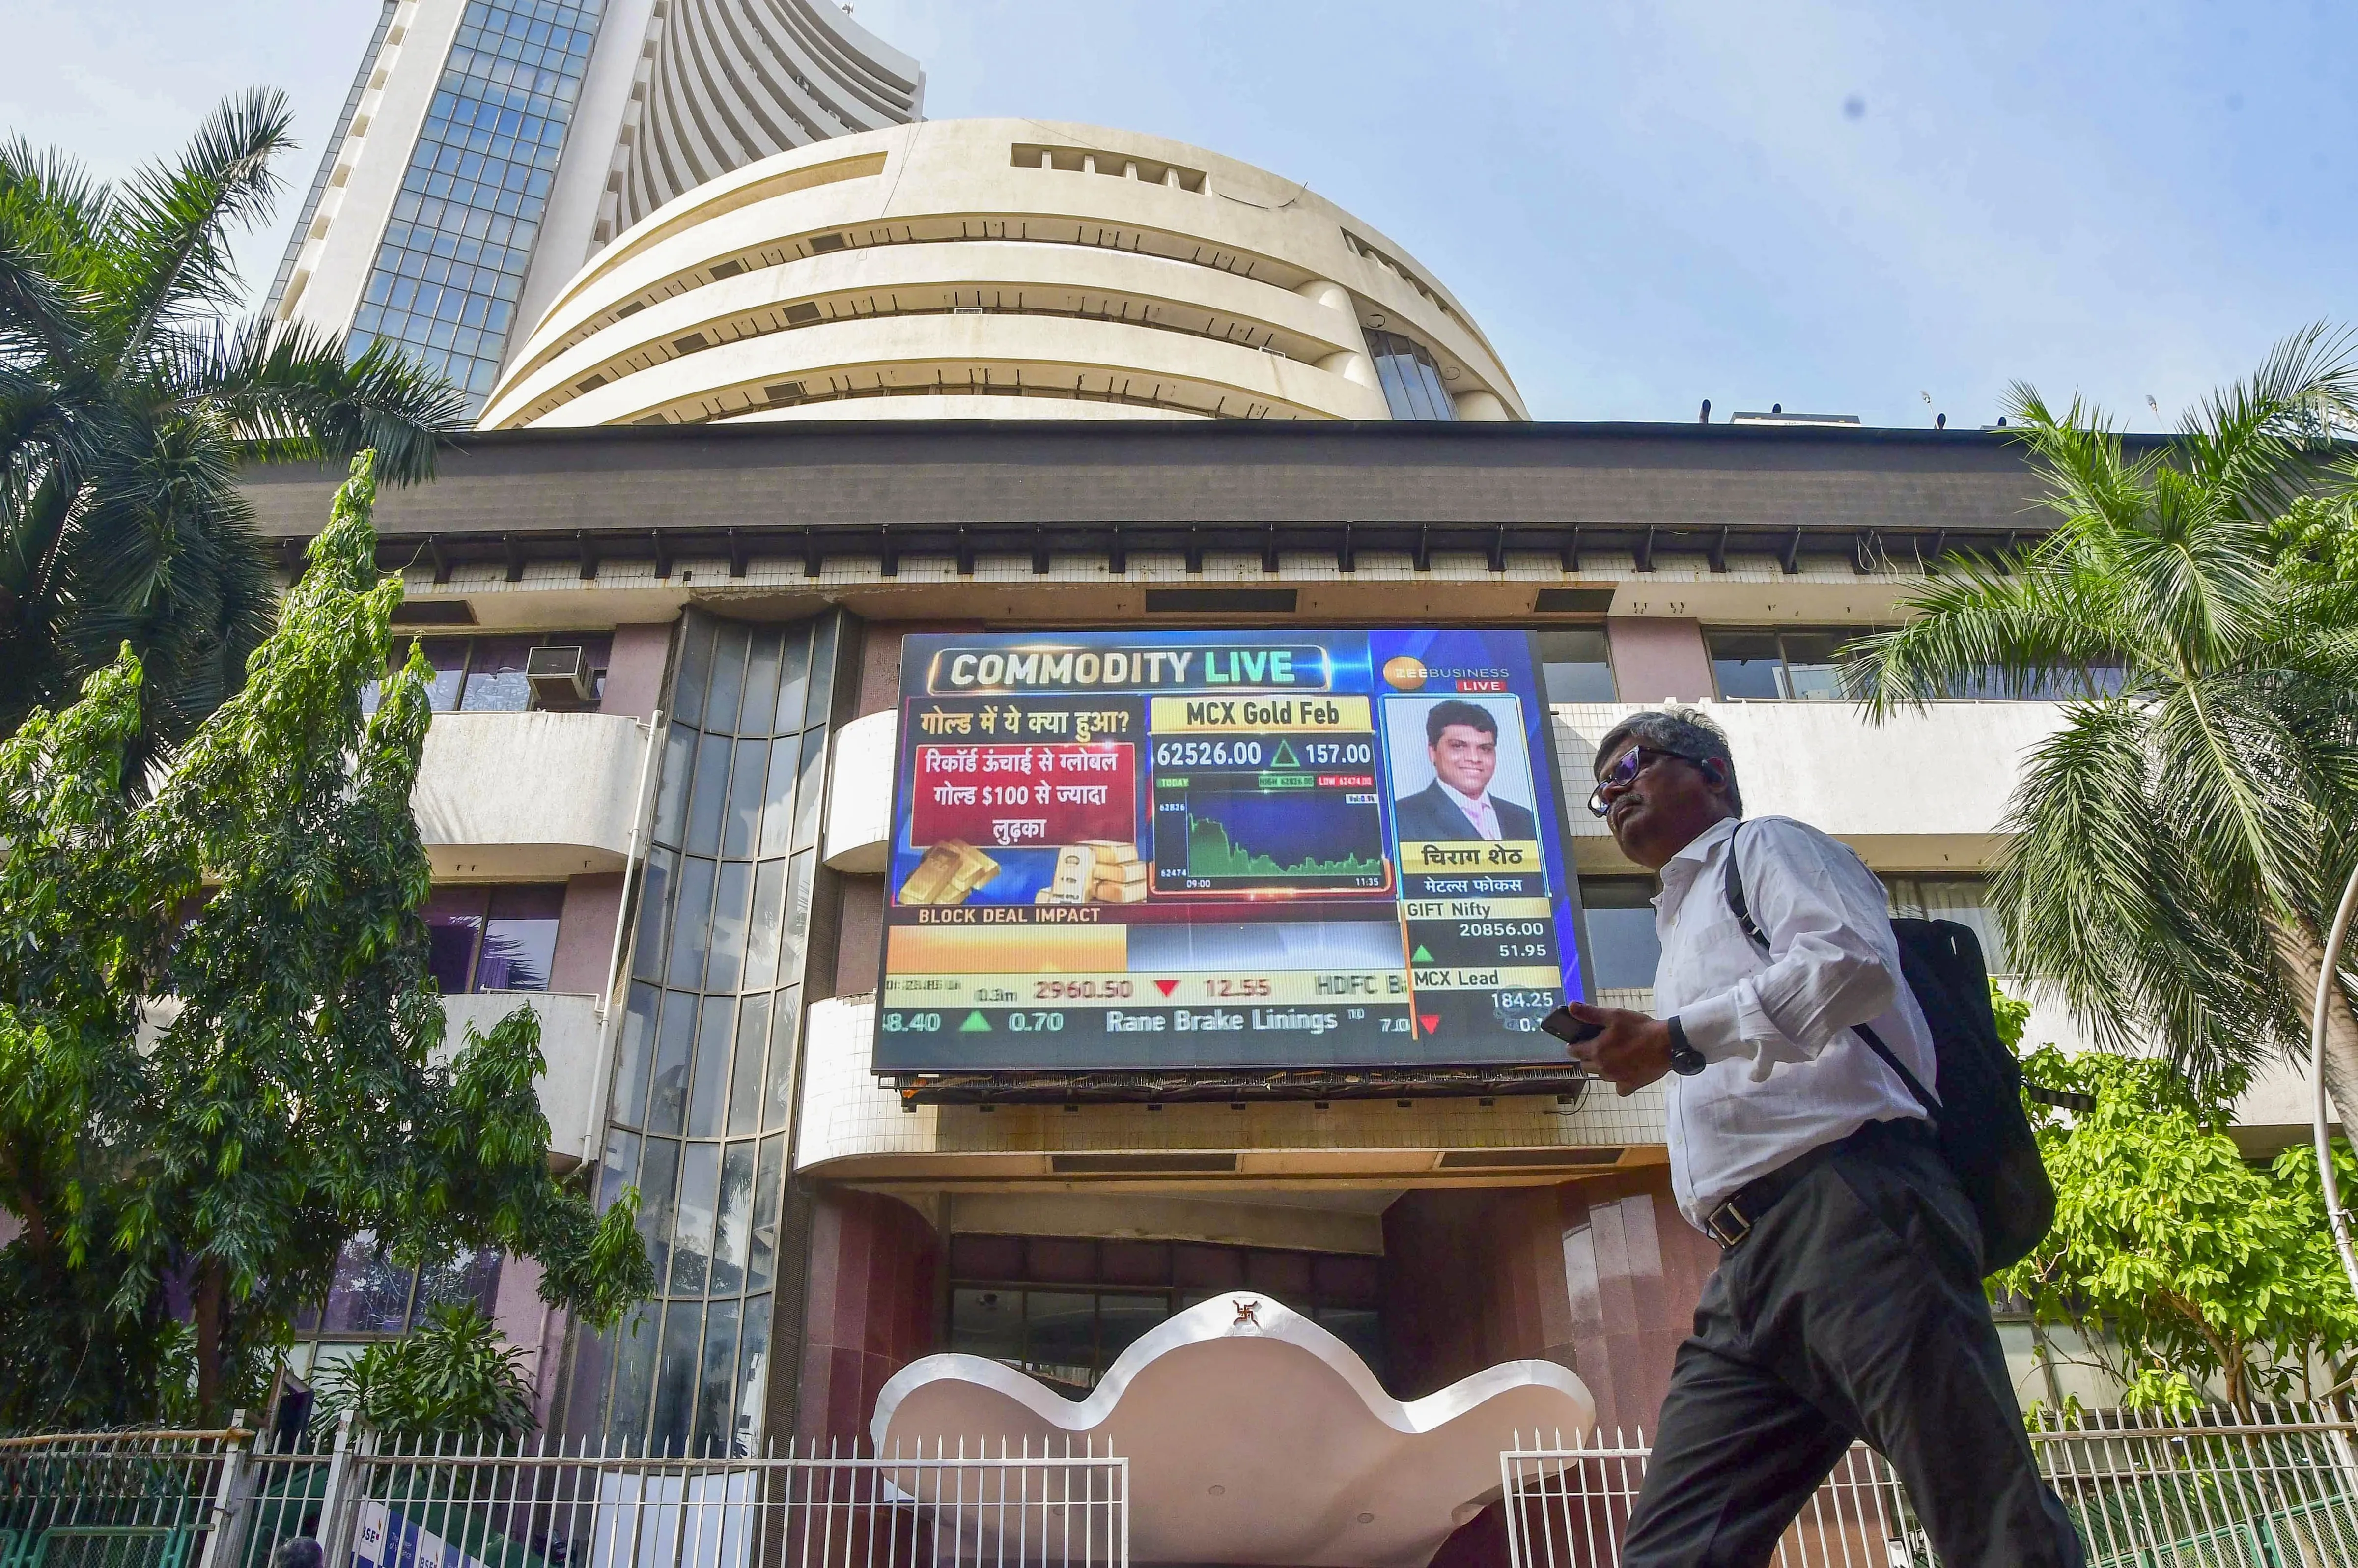
Market News
Trade setup for Jan 28: NIFTY50 ends below 23,000, volatility index record highest close in 5 months
.png)
4 min read | Updated on January 28, 2025, 07:22 IST


SUMMARY
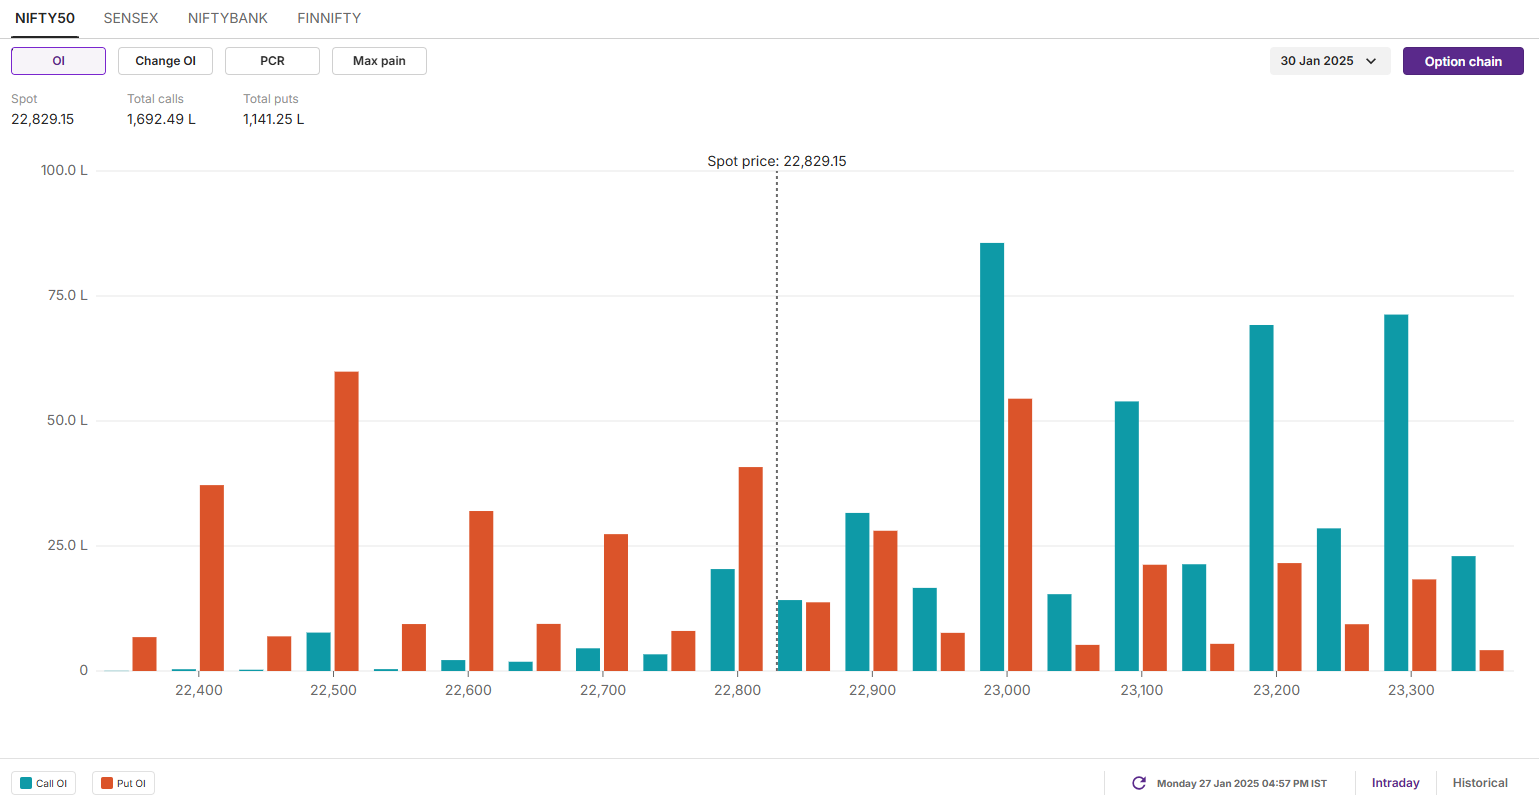
Options data for January 30 showed a significant build-up of open interest at the 23,000 call strike, suggesting resistance for the index around this level. Meanwhile, as the Union Budget approach, the India VIX - the volatility index - closed at 18, its highest level in five months, signalling heightened market volatility in the coming sessions.
Stock list
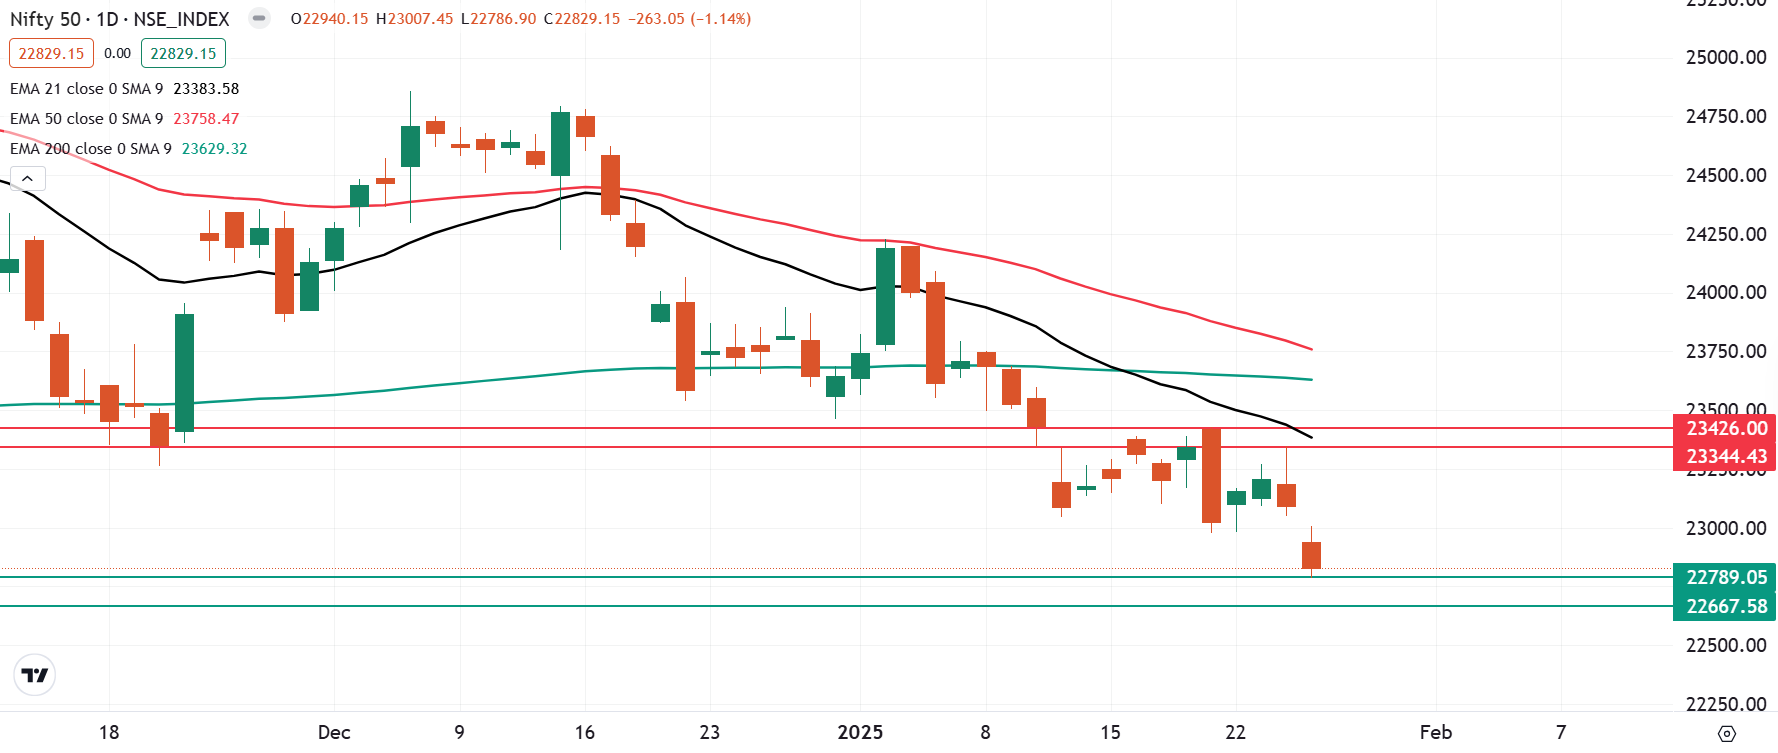
The NIFTY50 started Monday's session on a negative note, breaking the psychologically important 23,000 level by the close.
Asian markets @ 7 am
- GIFT NIFTY: 22,923 (+0.49%)
- Nikkei 225: 39,242 (-0.87%)
- Hang Seng: 20,337 (+0.69%)
U.S. market update
- Dow Jones: 44,713 (▲0.6%)
-
- S&P 500: 6,012 (▼1.4%)
- Nasdaq Composite: 19,341 (▼3.0%)
U.S. stocks closed mostly lower on Monday, driven by a tech selloff after rising attention on Chinese startup DeepSeek raised the possibility of more affordable AI development. The Nasdaq Composite and S&P 500 saw significant declines as the AI bellwether Nvidia tanked 17% along with the other chip stocks.
Shares of Microsoft, Google and Amzon also fell amid worries of hefty investments in AI. Meanwhile, big tech earnings season kicks off this week with key reports expected from Apple, Tesla (TSLA), Meta and Microsoft. Investors will be watching earnings guidance closely amid growing concerns about the revenue outlook following the rise of DeepSeek.
NIFTY50
- January Futures: 22,846 (▼1.2%)
- Open interest:4,72,166 (▼10.6%)
The NIFTY50 started Monday's session on a negative note, breaking the psychologically important 23,000 level by the close. The index lost over 1% to close at 22,829. The sharp fall was driven by weak global cues, broader market weakness and continued selling by foreign investors.
As per the daily chart, the index has slipped closer to the crucial support zone of 22,600 and 22,700, the breakout zone of May 2023. If the index slips below this zone on closing basis, then it may extend the weakness up to 22,500 zone. Meanwhile, the resistance remains around the 23,400 zone.
The open interest data for the 30 January expiry saw significant call build-up at 23,000 strike, indicating resistance for the index around this level. Conversely, the put base was seen at 22,500 with relatively low volume, suggesting support for the index around this zone.
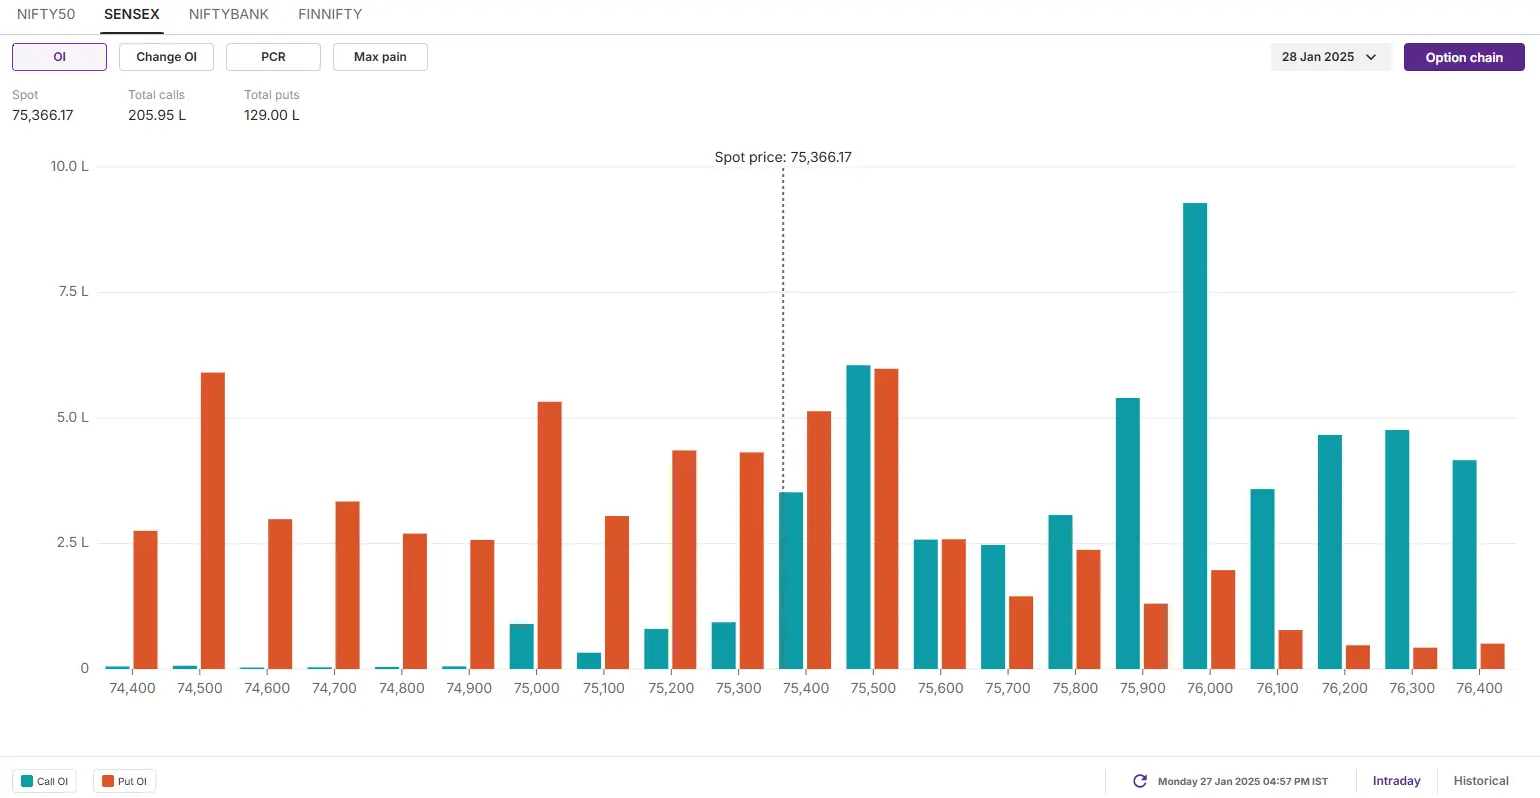
SENSEX
- Max call OI: 77,000
- Max put OI: 74,000
- (Expiry: 28 Jan)
Following a gap-down opening, the SENSEX extended its decline, closing below the critical support level of 75,800. With the breakdown of a nine-day consolidation phase, the index inched closer to the next key support zone at 74,800, which aligns with the breakout level of May 2024.
The broader technical outlook for the index remains weak, with immediate resistance near the ₹77,300 mark. Unless the index reclaims this level on a closing basis, the bearish trend is likely to persist. On the downside, a decisive close below the crucial support of ₹75,000 could intensify selling pressure, potentially driving the index lower to ₹74,000.
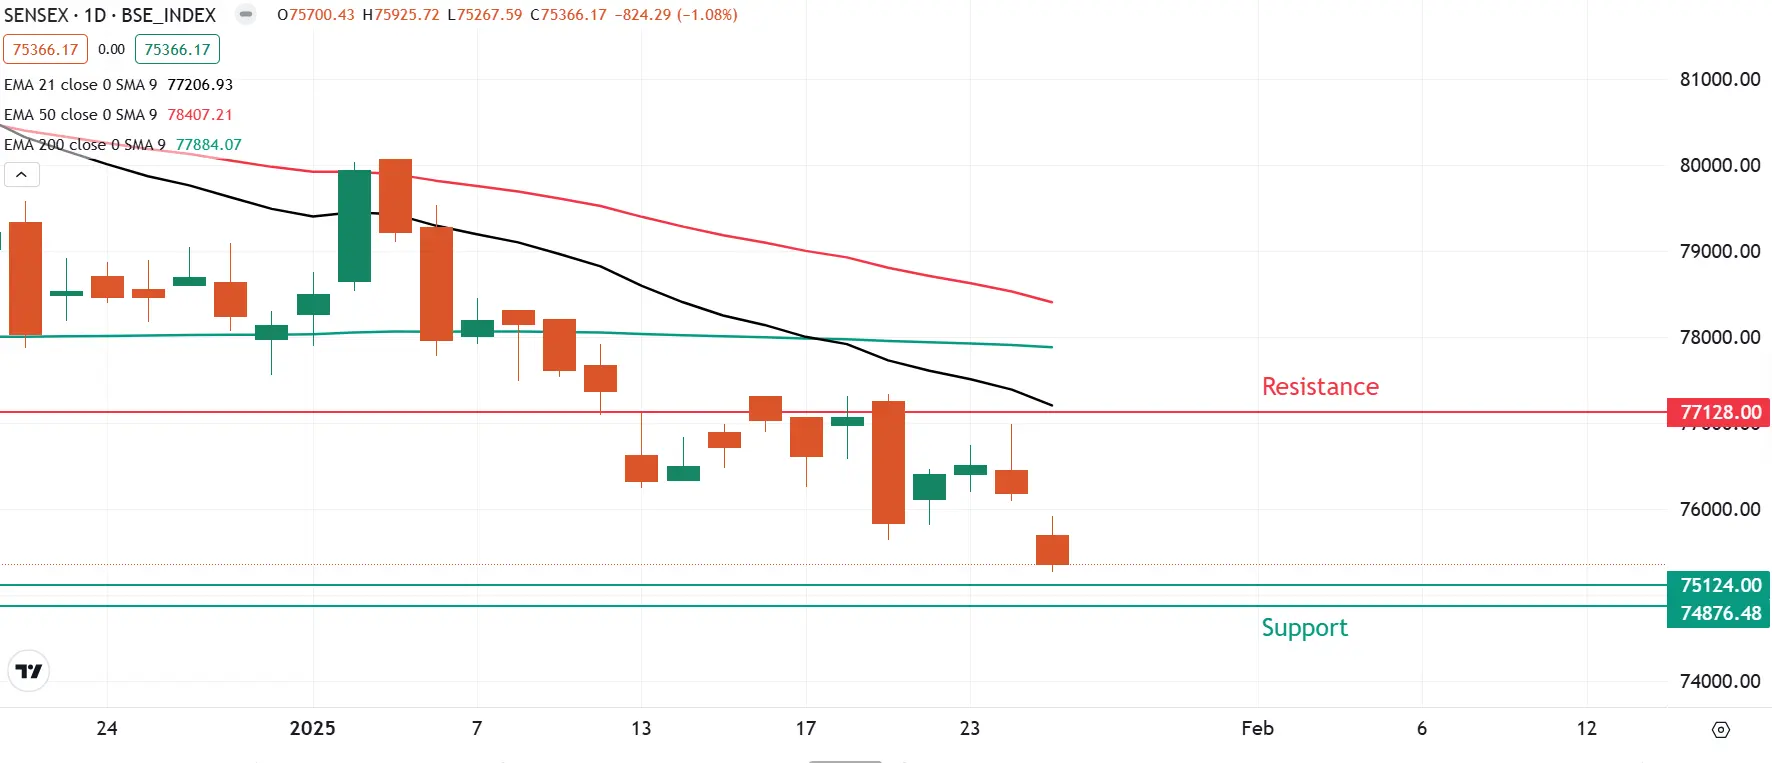
The open interest data for today’s expiry saw significant call build-up at 76,000 strike, suggesting resistance for the index around this zone. Conversely, the put base was seen at 74,500 strike with relatively low volume, pointing at support for the index around this zone. Additioanlly, the index also saw significant call and put base build-up at 75,500, pointing at consolidation around this level.
FII-DII activity
Stock scanner
- Long build-up: Bank of India
- Short build-up: CDSL, Laurus Labs, Godrej Properties, Supreme Industries, Computer Age Management Services and Info-Edge (Naukri)
- Under F&O ban: IndiaMART InterMESH, Manappuram Finance, Mahanagar Gas and Punjab National Bank
- Out of F&O ban: Aditya Birla Fashion and Retail, Bandhan Bank, Can Fin Homes, Dixon Technologies and L&T Finance
In Futures and Options or F&O, long build-up means an increase in Open Interest (OI) along with an increase in price, and short build-up means an increase in Open Interest(OI) along with a decrease in price. Source: Upstox and NSE.
Disclaimer: Derivatives trading must be done only by traders who fully understand the risks associated with them and strictly apply risk mechanisms like stop-losses. The information is only for consumption by the client and such material should not be redistributed. We do not recommend any particular stock, securities and strategies for trading. The securities quoted are exemplary and are not recommendatory. The stock names mentioned in this article are purely for showing how to do analysis. Take your own decision before investing.
About The Author
Next Story


