Market News
Trade setup for Jan 20: Doji on NIFTY50 weekly chart, will 23,000 hold as crucial support?
.png)
4 min read | Updated on January 20, 2025, 07:18 IST
SUMMARY
The NIFTY50 index formed a doji candlestick pattern on the weekly chart, reflecting indecision among traders after a sharp fall. For short-term clues, traders can monitor the low and the high of the indecision pattern. A close above or below these levels will provide directional clues.
Stock list

The NIFTY50 index extended its range-bound movement for the fourth day in a row and consolidated within the range of 23,400 and 23,000.
Asian markets @ 7 am
- GIFT NIFTY: 23,297 (+0.26%)
- Nikkei 225: 39,029 (+1.50%)
- Hang Seng: 19,804 (+1.13%)
U.S. market update
- Dow Jones: 43,487 (▲0.7%)
- S&P 500: 5,996 (▲1.0%)
- Nasdaq Composite: 19,630 (▲1.5%)
U.S. indices registered their biggest weekly gains since the week of U.S. Presidential Election in November with Dow Jones and S&P 500 advancing 3.7% and 2.9%. These gains follow consecutive reports indicating a slight easing of inflationary pressures.
The core Consumer Price Index showed a smaller-than-expected year-over-year increase, while the Producer Price Index for December also rose less than anticipated. In response, the 10-year Treasury yield fell sharply, fueled by rising optimism for multiple rate cuts in the coming year.
NIFTY50
- January Futures: 23,267 (▼0.5%)
- Open interest: 5,61,286 (▲3.9%)
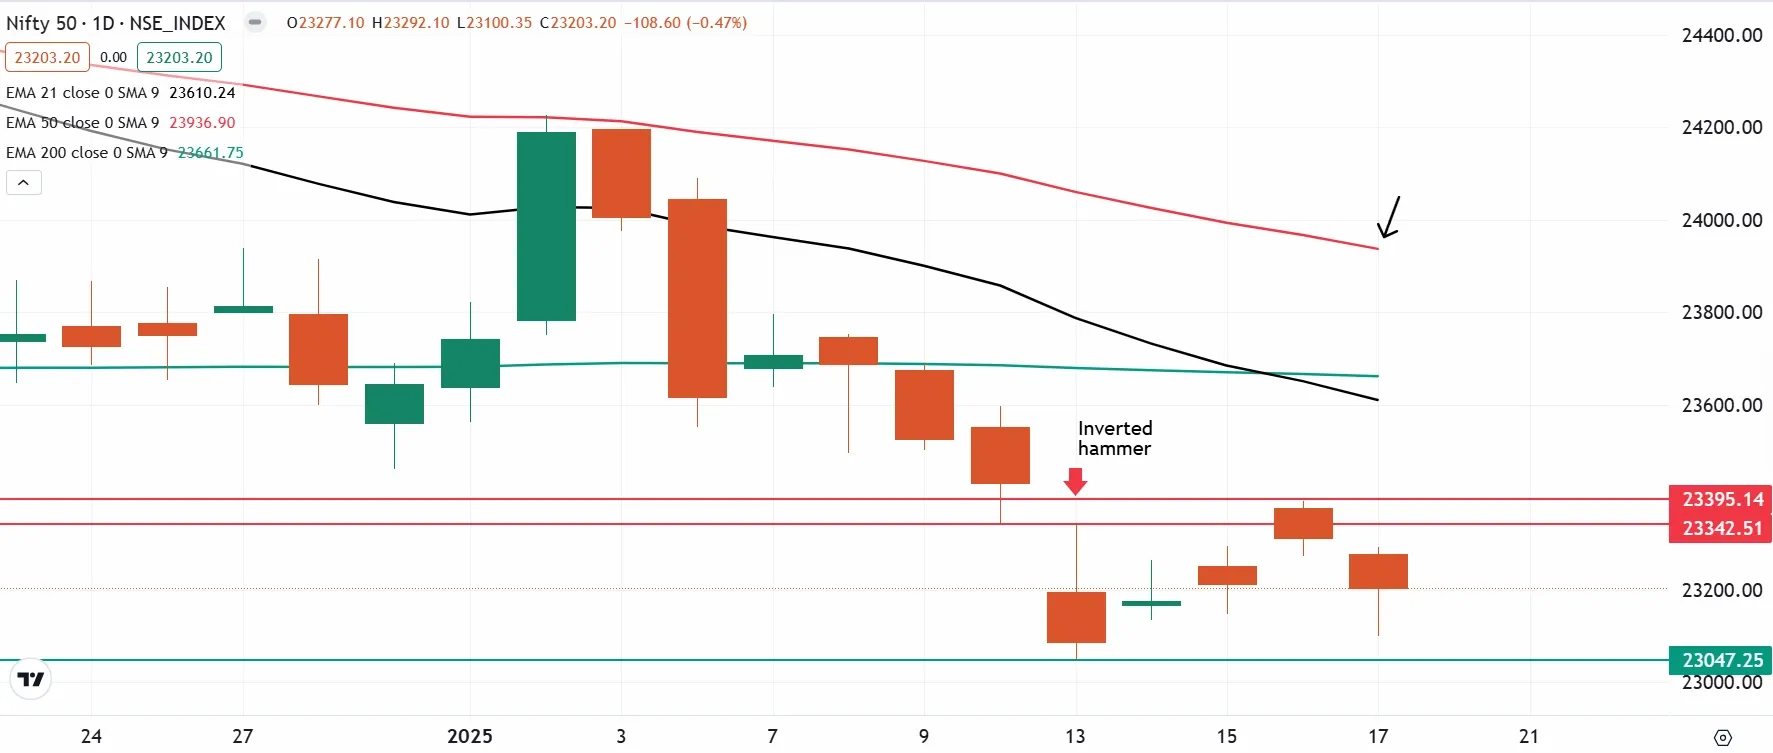
The NIFTY50 index extended its range-bound movement for the fourth day in a row and consolidated within the range of 23,400 and 23,000. The index is broadly still trading within the range of 13th January’s inverted hammer candlestick pattern and has failed to close above the high and the low of the reversal pattern on the daily chart.
As highlighted on the chart below, the NIFTY50 index is currently trading within the range of 23,400 and 23,000. Traders can closely monitor this range as a close below or above these level on daily chart will provide further directional clues. However, it is important to note that the broader trend of the index remains weak with immediate resistance around 21 and 200 EMAs. On the other hand, if index slips below 23,000 zone, the next crucial support is visible around 22,800.
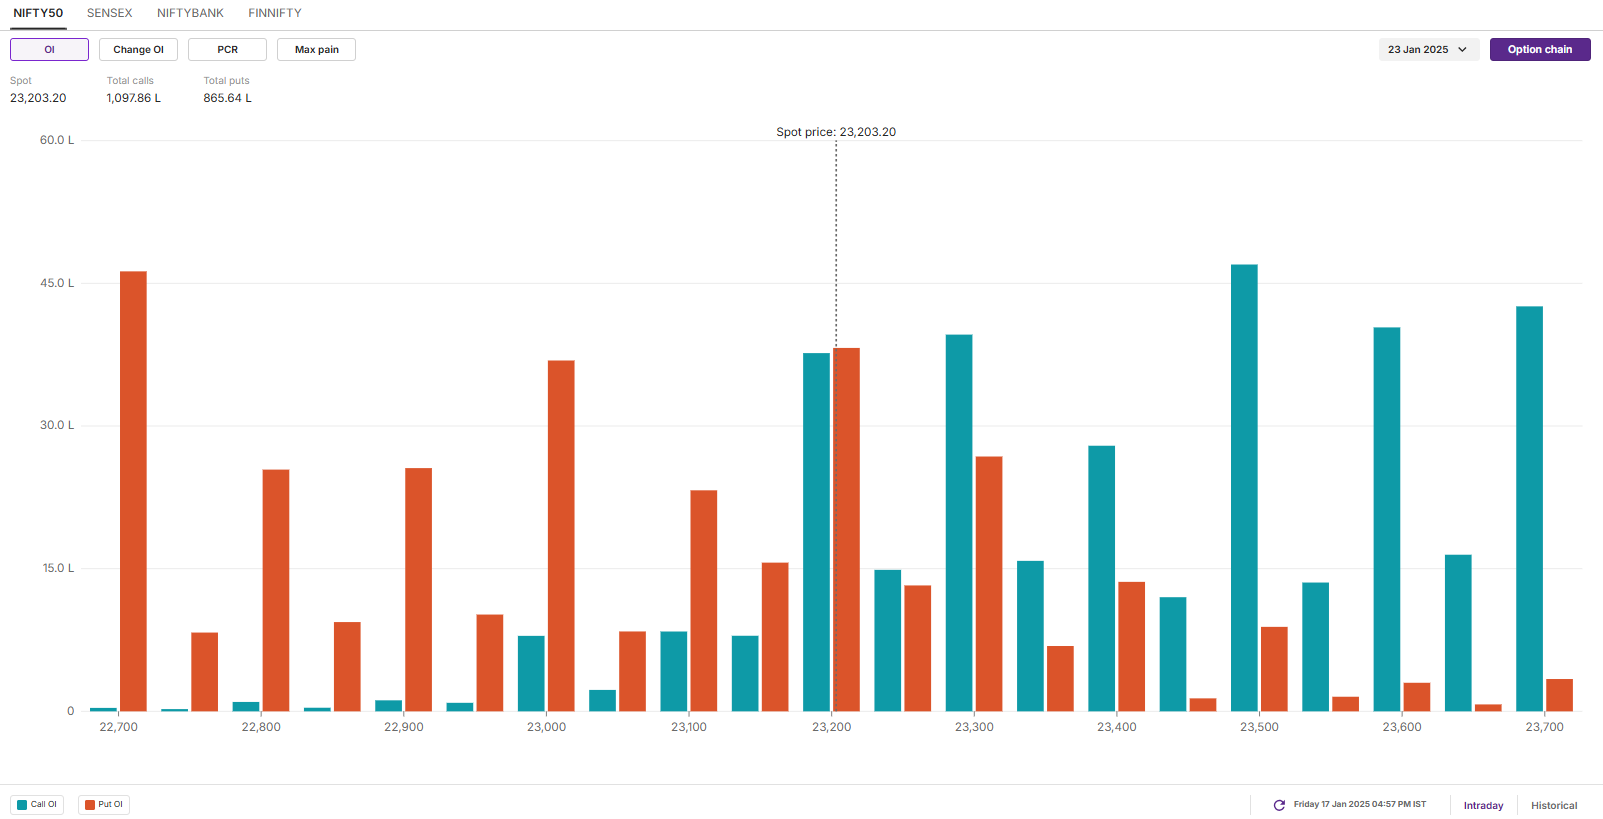
The open interest data for the 23 Januuary expiry saw significant call and put build-up at 23,200 strikes, suggesting consolidation around this zone. Additionally, the call and put bases were also established at 23,500 and 23,000 strikes, marking them as immediate resistance and support zones.
SENSEX
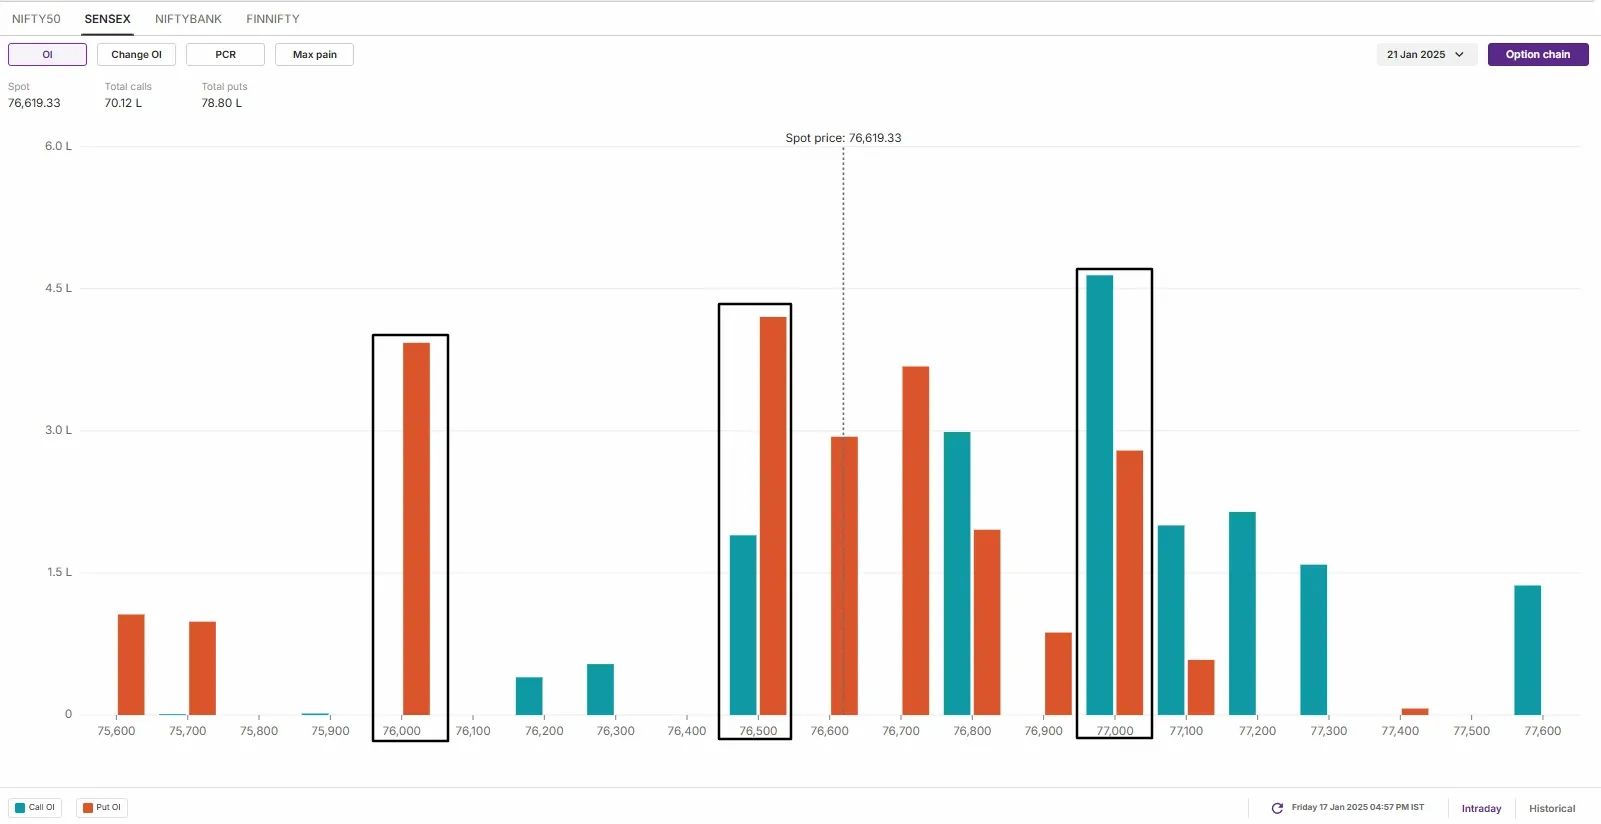
- Max call OI: 79,000
- Max put OI: 75,000
- (Expiry: 21 Jan)
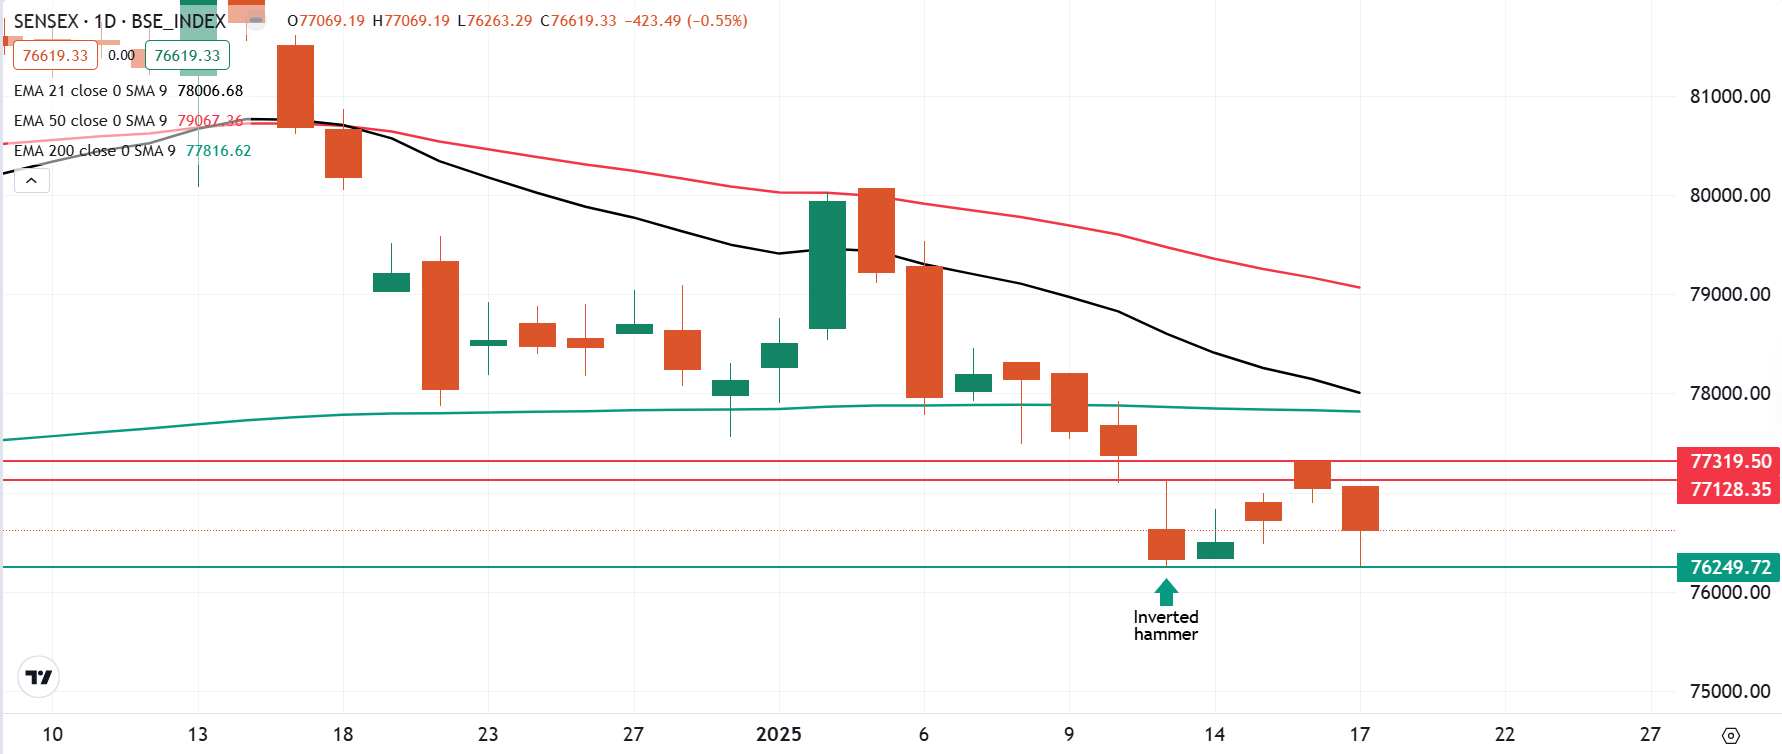
The SENSEX index continued its range-bound movement for the fourth consecutive day, consolidating within the tight range of 77,300 and 76,200. This sideways movement follows the inverted hammer candlestick pattern observed on January 13th, with the index unable to close above the high or below the low of this key reversal pattern on the daily chart.
As shown in the chart below, SENSEX remains confined within the 77,300 to 76,200 range. This range has become a critical zone for traders, as a decisive daily close above or below these levels could provide clear directional cues for the near term.
Despite this consolidation, the broader trend of the index remains weak. Immediate resistance is visible around the 21-day and 200-day Exponential Moving Averages (EMAs), adding to the challenges for upward momentum.
There is notable open interest at the 76,000 and 76,500 strikes, indicating support for the index around these levels. Conversely, a significant call base is observed at the 77,000 strike, suggesting that this level could act as a key resistance for the index.
FII-DII activity
Stock scanner
- Long build-up: Macrotech Developers, Godrej Consumer Products, L&T Technology Services and Reliance Industries
- Short build-up: Infosys, Axis Bank, Shriram Finance and Varun Beverages
- Under F&O ban: Aarti Industries, Aditya Birla Fashion and Retail, Angel One, Bandhan Bank, Kalyan Jewellers, Hindustan Copper, Manappuram Finance, L&T Finance and RBL Bank
- Out of F&O ban: NIL
In Futures and Options or F&O, long build-up means an increase in Open Interest (OI) along with an increase in price, and short build-up means an increase in Open Interest(OI) along with a decrease in price.
Source: Upstox and NSE.
Disclaimer: Derivatives trading must be done only by traders who fully understand the risks associated with them and strictly apply risk mechanisms like stop-losses. The information is only for consumption by the client and such material should not be redistributed. We do not recommend any particular stock, securities and strategies for trading. The securities quoted are exemplary and are not recommendatory. The stock names mentioned in this article are purely for showing how to do analysis. Take your own decision before investing.
About The Author
Next Story
