Market News
Trade setup for Jan 10: Can NIFTY50 defend 23,500 support zone?
.png)
3 min read | Updated on January 10, 2025, 07:14 IST
SUMMARY
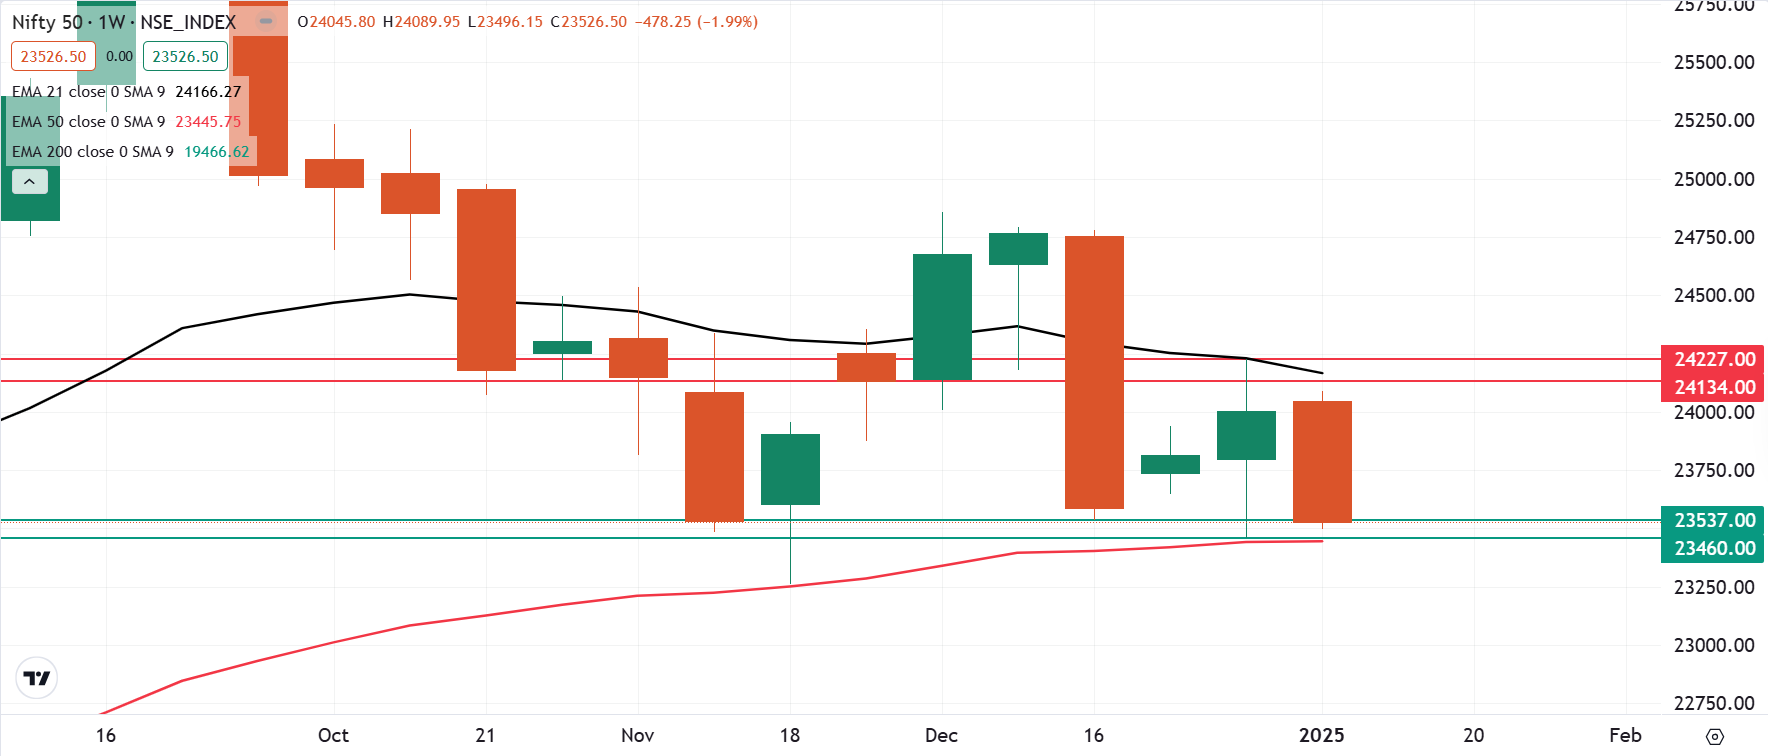
The NIFTY50 index is currently trading within last week’s range, showing early signs of a potential bearish close. A close below 23,500 could indicate further weakness, potentially extending down to the 22,800 zone. Conversely, a close above 23,800 would shift momentum in favour of the bulls.
Stock list

The NIFTY50 index remained under pressure on the weekly expiry of its options contracts and ended the day in red.
Asian markets @ 7 am
- GIFT NIFTY: 23,582.50 (-0.33%)
- Nikkei 225: 39,275.56 (-0.84%)
- Hang Seng: 19,322.54 (+0.42%)
U.S. market update
U.S. stock markets were closed on Thursday, January 9, in observance of a National Day of Mourning honoring former President Jimmy Carter.
NIFTY50
- January Futures: 23,648 (▼0.4%)
- Open interest: 5,45,648 (▲5.5%)
The NIFTY50 index remained under pressure on the weekly expiry of its options contracts and ended the day in red. The index failed to close above 8 January’s high, invalidating the hammer candlestick pattern formed on daily chart.
As per the weekly chart, the index is giving early indication of the formation of bearish candle. A close below previous week’s low and 50 weekly exponential moving average (EMA) will signal weakness. However, if the index protects crucial support zone of 23,500 and 23,300 on closing basis, the trend may remain range-bound.

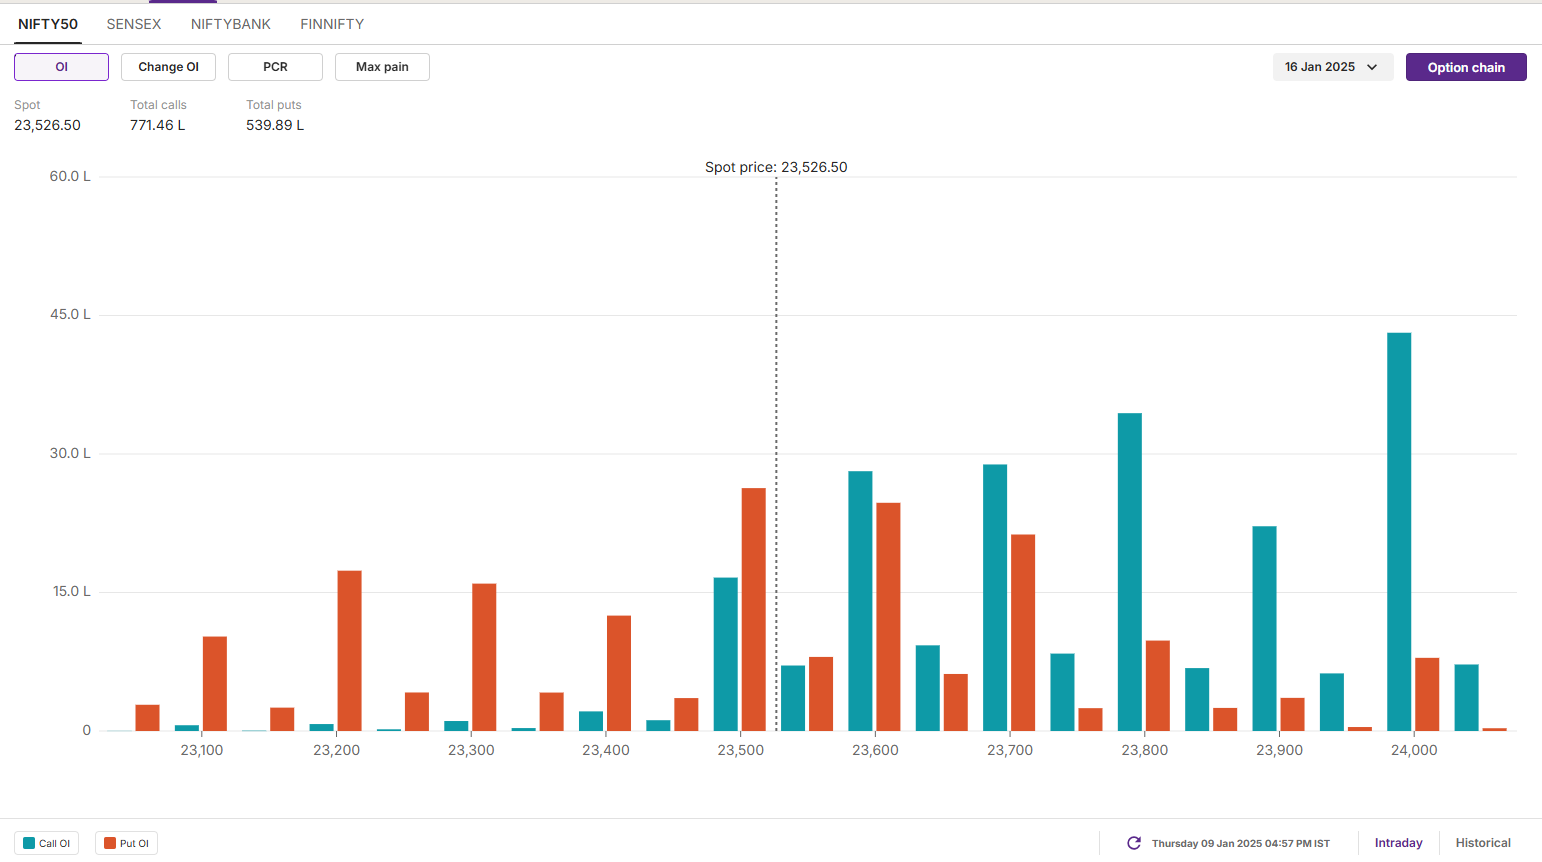
The open interest data for the 16 January expiry provides key insights. A significant call base was sustained at the 24,000 strike, suggesting that market participants anticipate resistance around this level. Conversely, the put base has been established at 23,500, albeit with relatively lower volume, indicating a less robust support zone.

SENSEX
- Max call OI: 80,000
- Max put OI: 75,500
- (Expiry: 14 Jan)
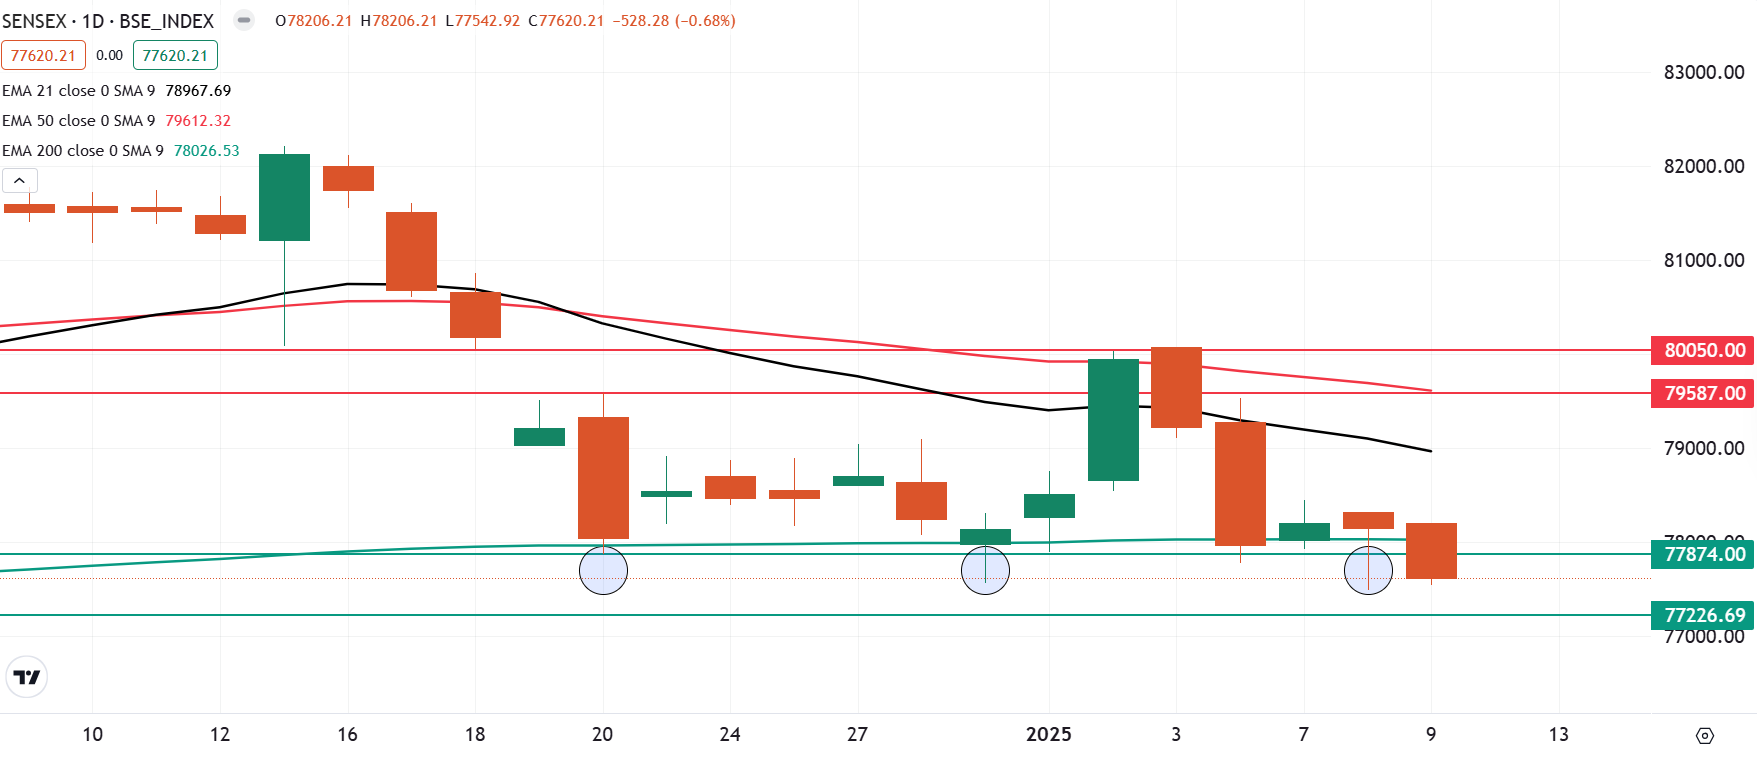
The SENSEX also ended the Thursday’s session near day’s low, invalidating the hammer candlestick formed on 8 January. The index also surrendered crcuial support of 200 EMA on the daily chart, indicating weakness during upcoming sessions.
The daily chart reveals that the index invalidated the hammer candlestick pattern and lost the critical support level of 77,800, which corresponds to the low of the December 20 candle, on a closing basis.
While the broader trend remains bearish, traders should focus on the weekly closing. If SENSEX ends the week below 77,500 zone, this will signal weakness. On the flip side, a close below 78,500 will indicate range-bound activity for the upcoming session.

FII-DII activity
Stock scanner
- Long build-up: Navin Fluorine, Indraprastha Gas and Aditya Birla Fashion and Retail
- Short build-up: Kalyan Jewellers, JSW Energy, Ashok Leyland, Info-Edge (Naukri) and Prestige Estates
- Under F&O ban: Bandhan Bank, Hindustan Copper, Manappuram Finance, L&T Finance and RBL Bank
In Futures and Options or F&O, long build-up means an increase in Open Interest (OI) along with an increase in price, and short build-up means an increase in Open Interest(OI) along with a decrease in price.
Source: Upstox and NSE.
Disclaimer: Derivatives trading must be done only by traders who fully understand the risks associated with them and strictly apply risk mechanisms like stop-losses. The information is only for consumption by the client and such material should not be redistributed. We do not recommend any particular stock, securities and strategies for trading. The securities quoted are exemplary and are not recommendatory. The stock names mentioned in this article are purely for showing how to do analysis. Take your own decision before investing.
About The Author
Next Story

