Market News
Trade setup for Feb 6: NIFTY50 consolidates around 23,700 as RBI policy looms
.png)
4 min read | Updated on February 06, 2025, 07:21 IST


SUMMARY
The NIFTY50 index traded in a narrow range of 100 points ahead of the weekly expiry of its options contracts and consolidated around the 23,700 mark. For today’s expiry, the index has immediate resistance around the 23,800 mark, while the support is around the 23,500 zone.
Stock list
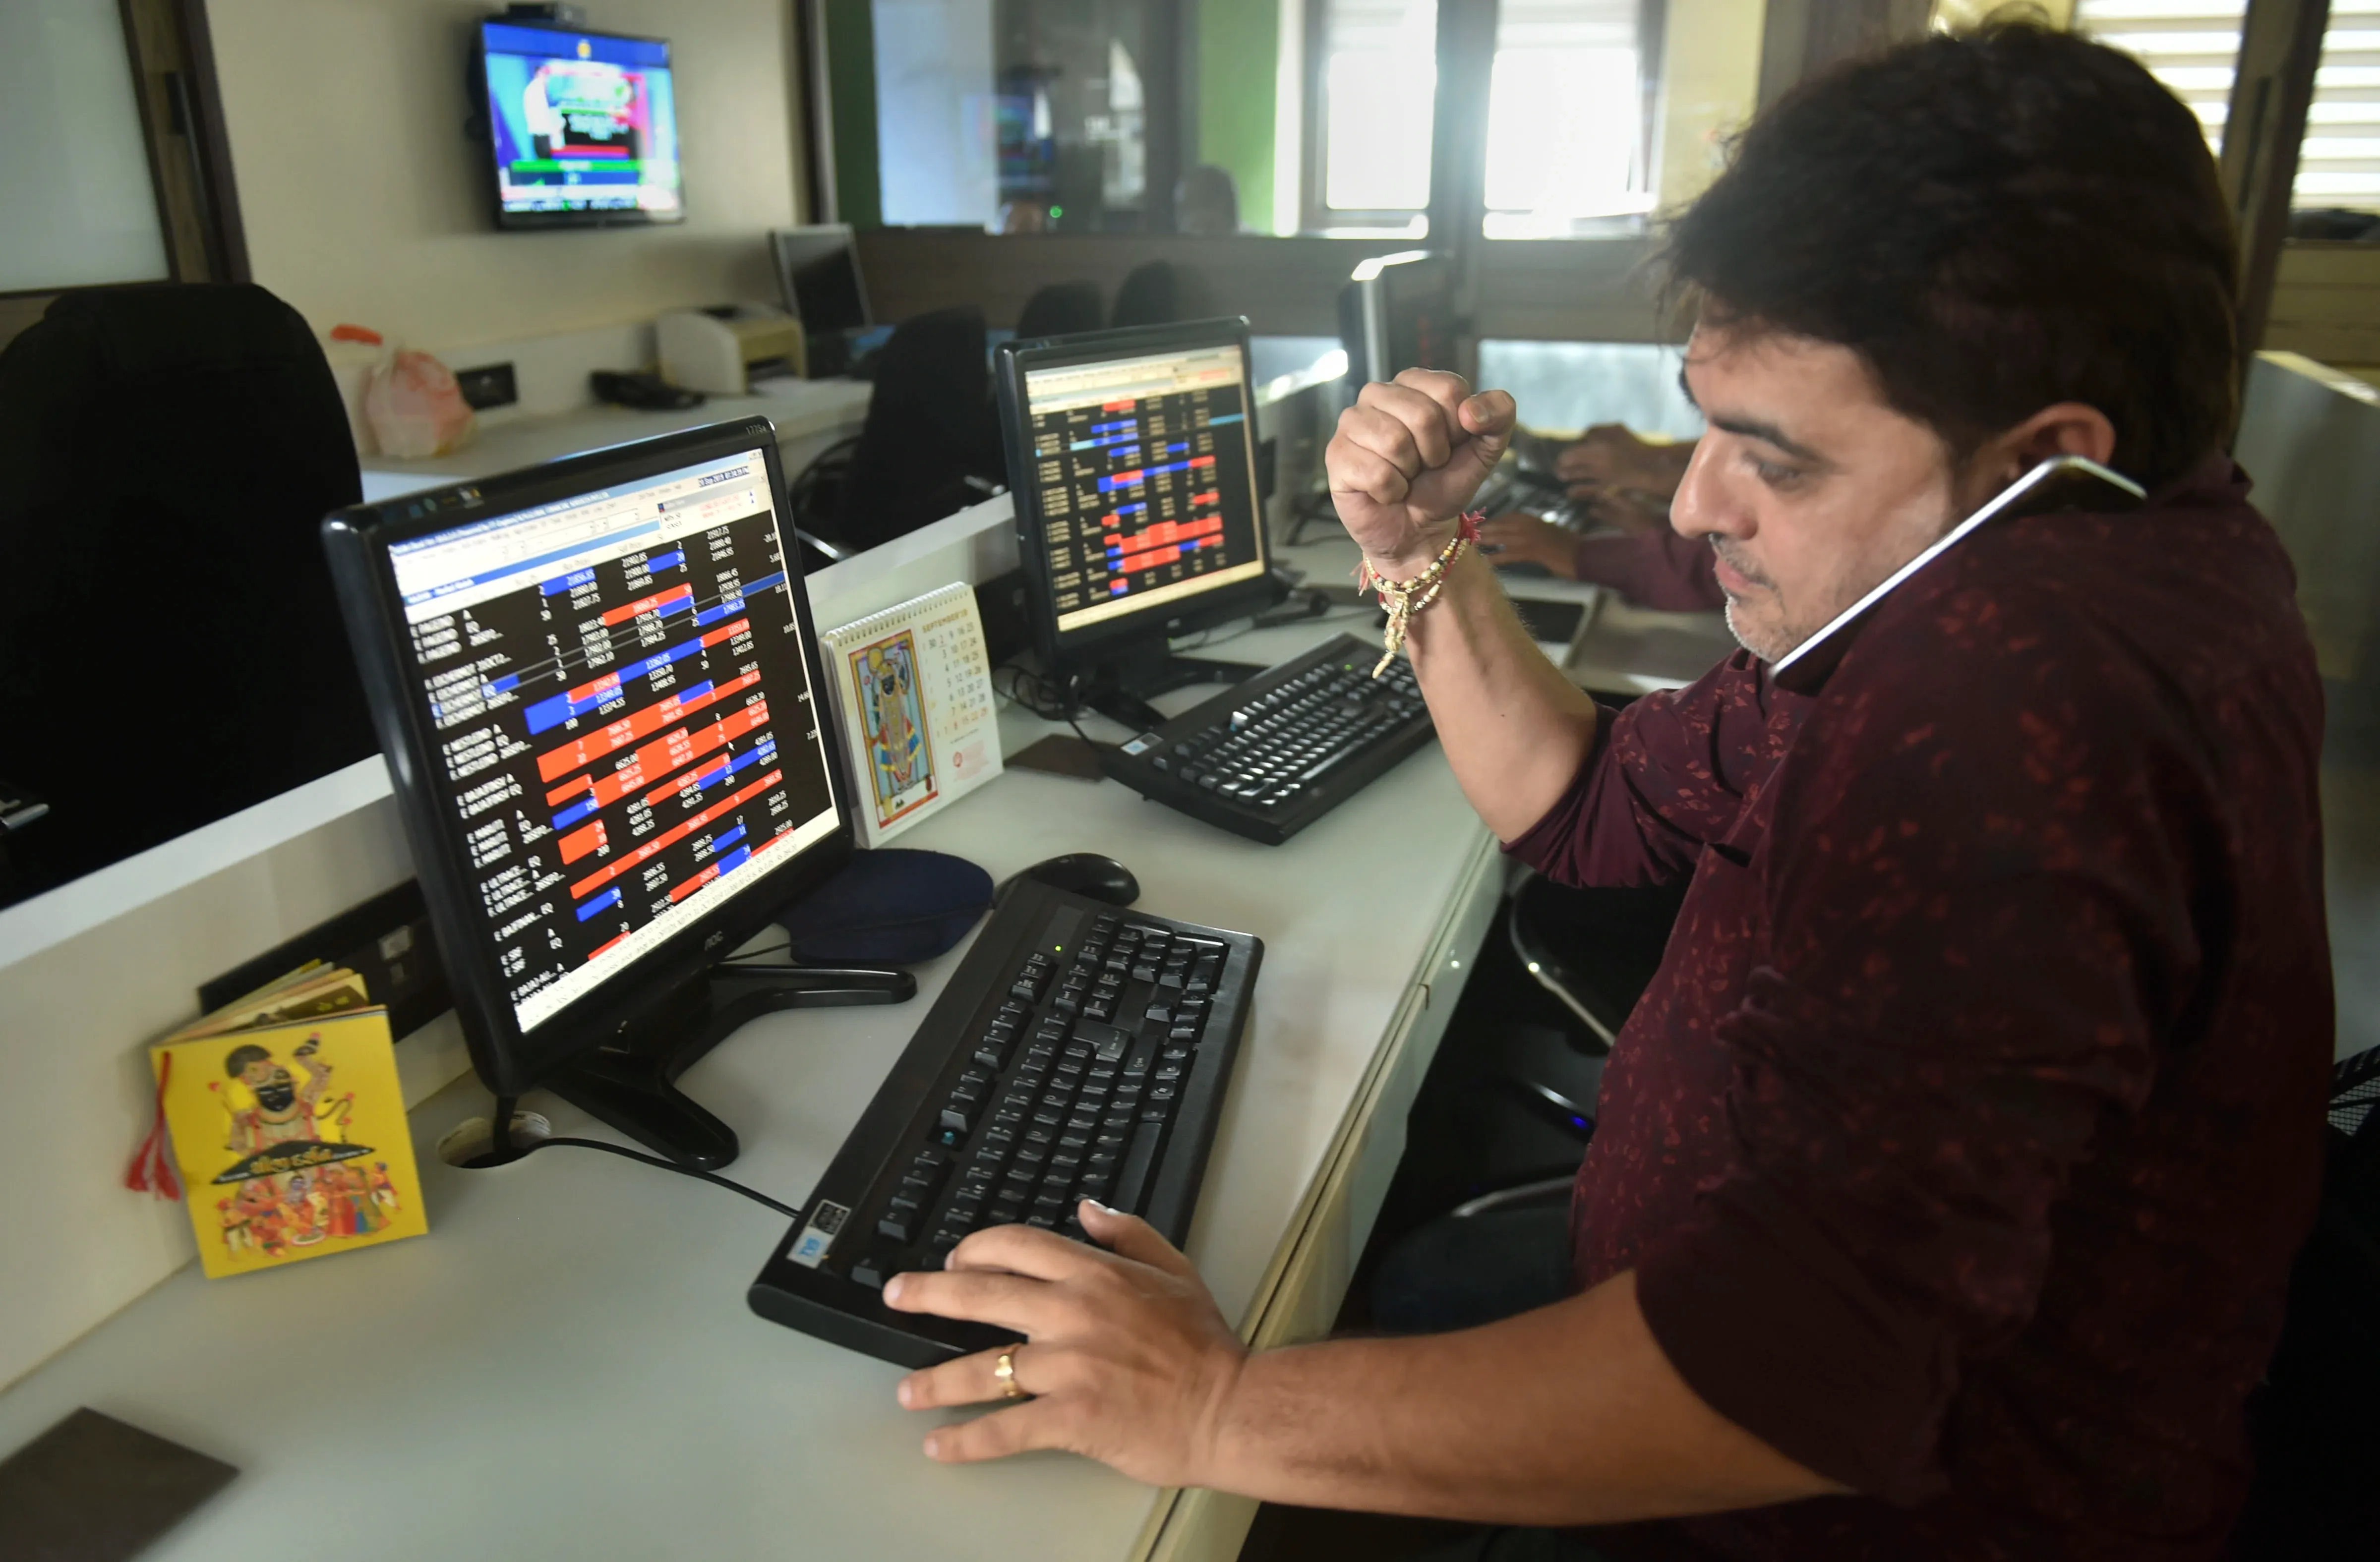
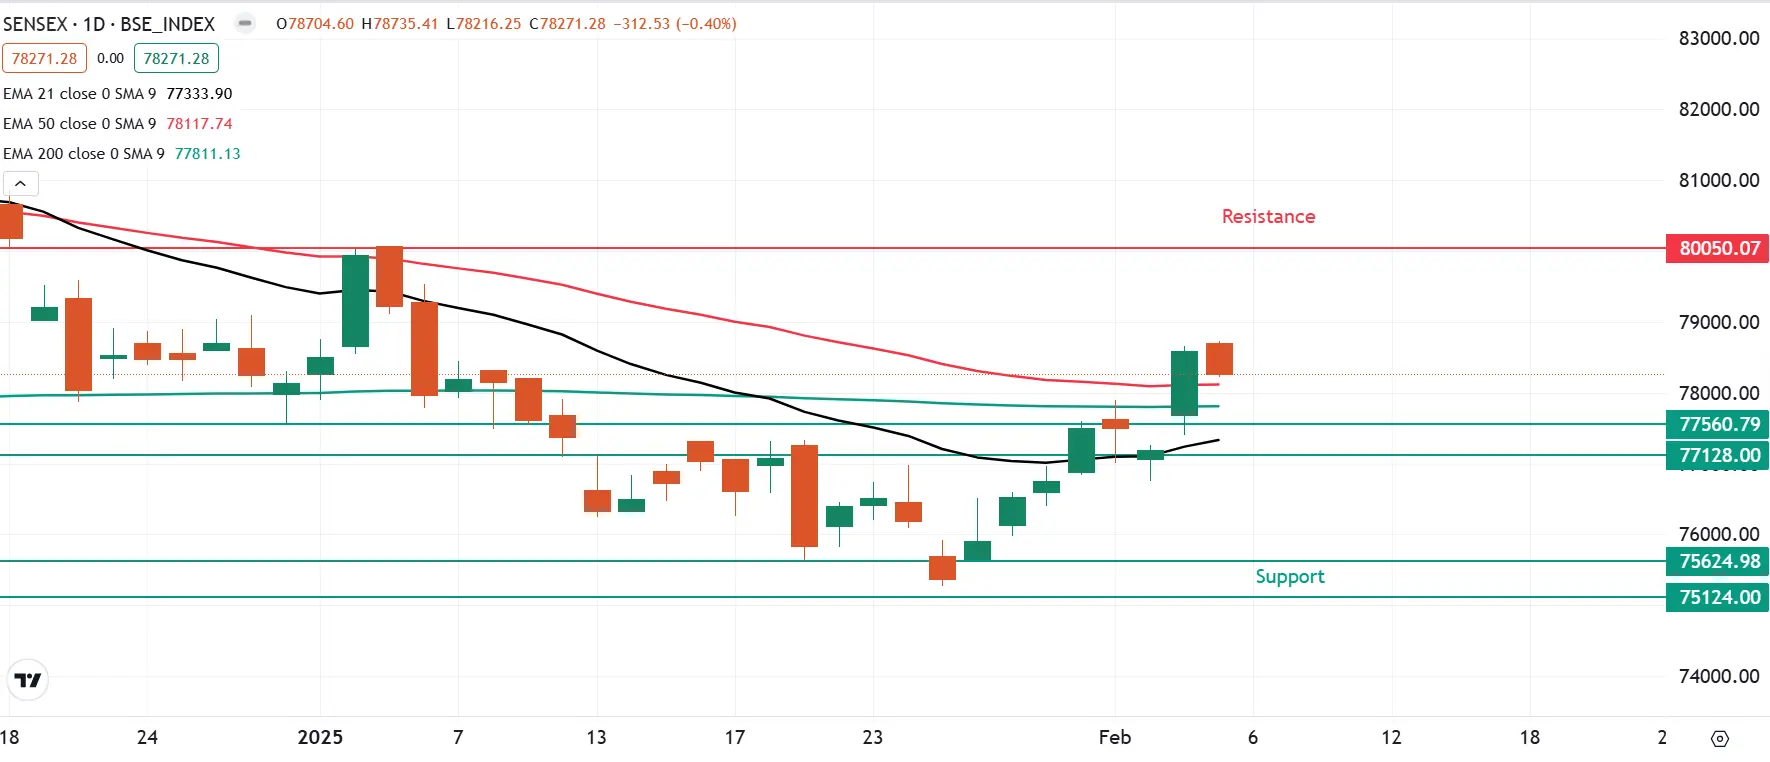
The SENSEX traded within a narrow range on February 5th, briefly surpassing the 78,700 resistance level before retreating. | Image: PTI
Asian markets @ 7 am
- GIFT NIFTY: 23,804 (+0.23%)
- Nikkei 225: 38,922 (+0.23%)
- Hang Seng: 20,585 (-0.06%)
U.S. market update
- Dow Jones: 44,873 (▲0.7%)
- S&P 500: 6,061 (▲0.3%)
- Nasdaq Composite: 19,692 (▲0.1%)
U.S. indices closed higher on Wednesday, boosted by a sharp drop in Treasury yields, which fell to their lowest level since mid-December. The bond market rallied after the U.S. government said it wouldn't accelerate the pace of debt issuance, easing concerns about rising borrowing costs.
Meanwhile, technology stocks had a mixed day. Shares of Alphabet, the parent company of Google, fell nearly 7% after its fourth quarter cloud revenue missed expectations. However, the broader tech sector found support, with Nvidia rallying after Alphabet revealed plans to invest $75 billion in capital expenditure in 2025.
NIFTY50
- February Futures: 23,472 (▼0.1%)
- Open interest: 2,21,509 (▼0.5%)
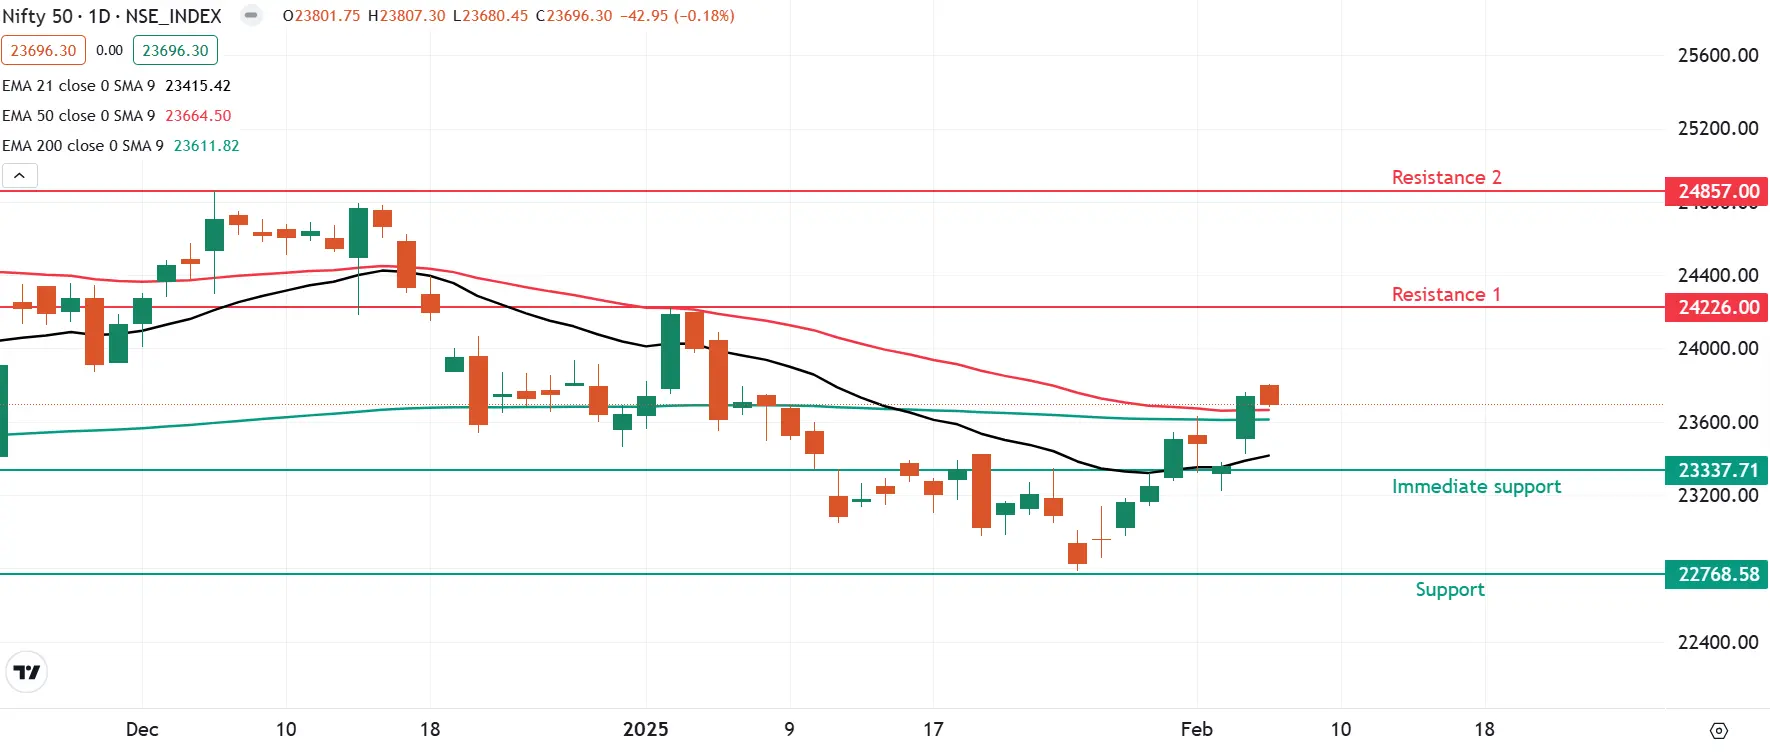
The NIFTY50 index upward momentum hit a snag on February 5th, despite an initial surge past the key 23,800 resistance level. The index witnessed profit-booking at higher levels and consolidated broadly in a 100 point range ahead of the expiry of its weekly options contracts.
Meanwhile, the technical structure of the index as per the daily chart remains positive with immediate support for the index around its 21-day exponential moving average zone. Conversely, a decisive close above the 23,800 zone could reignite the momentum.
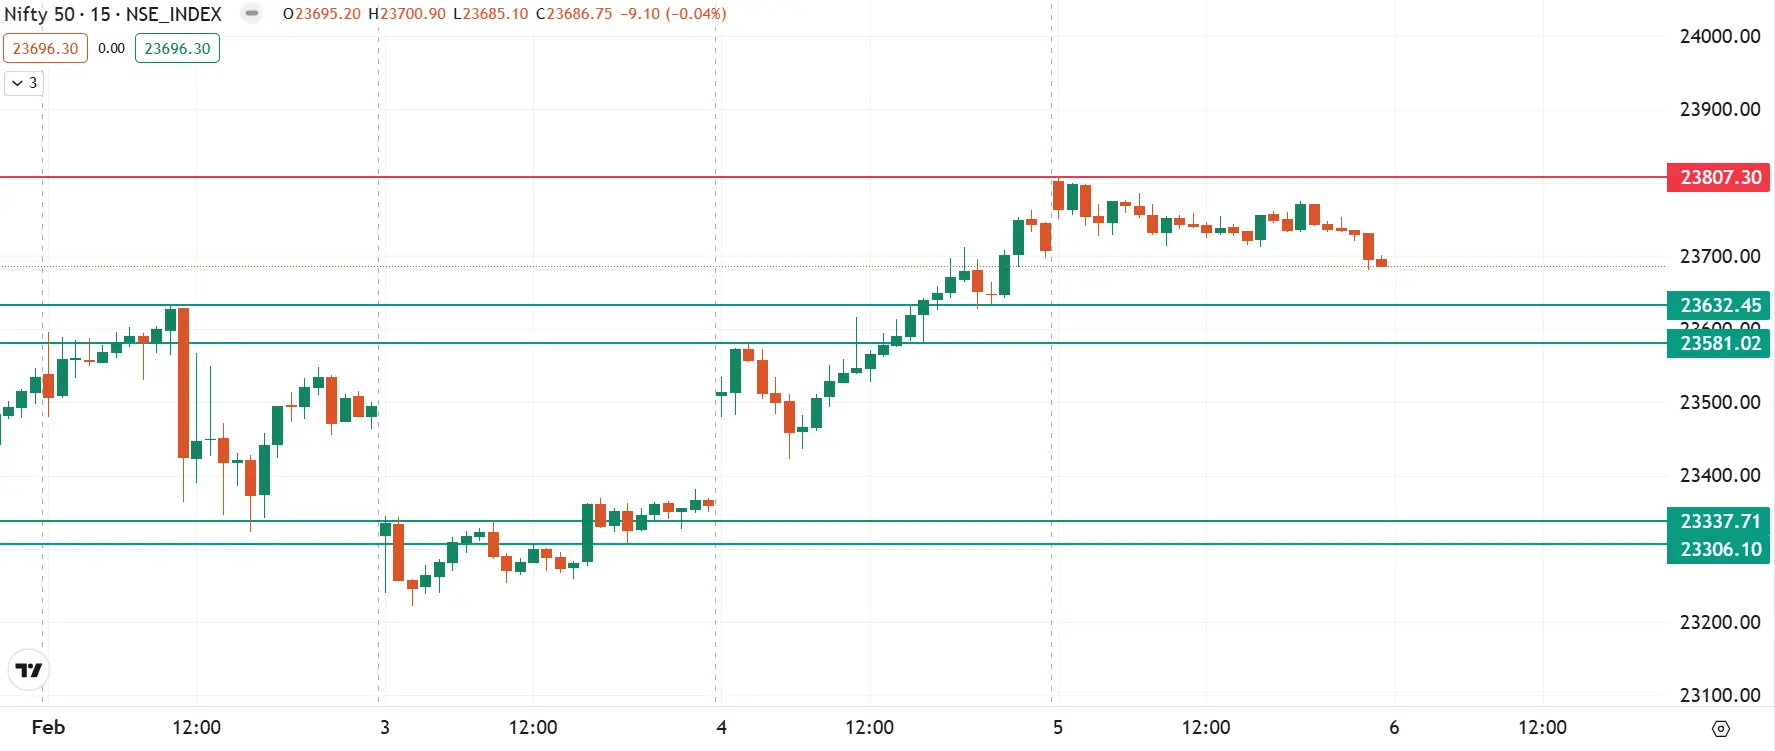
As per the 15-minute time frame, the index has immediate resistance around the 23,800 zone and the support is visible around the 23,500 level. Traders can closely monitor this range as a decisive break of this range will provide further directional clues.
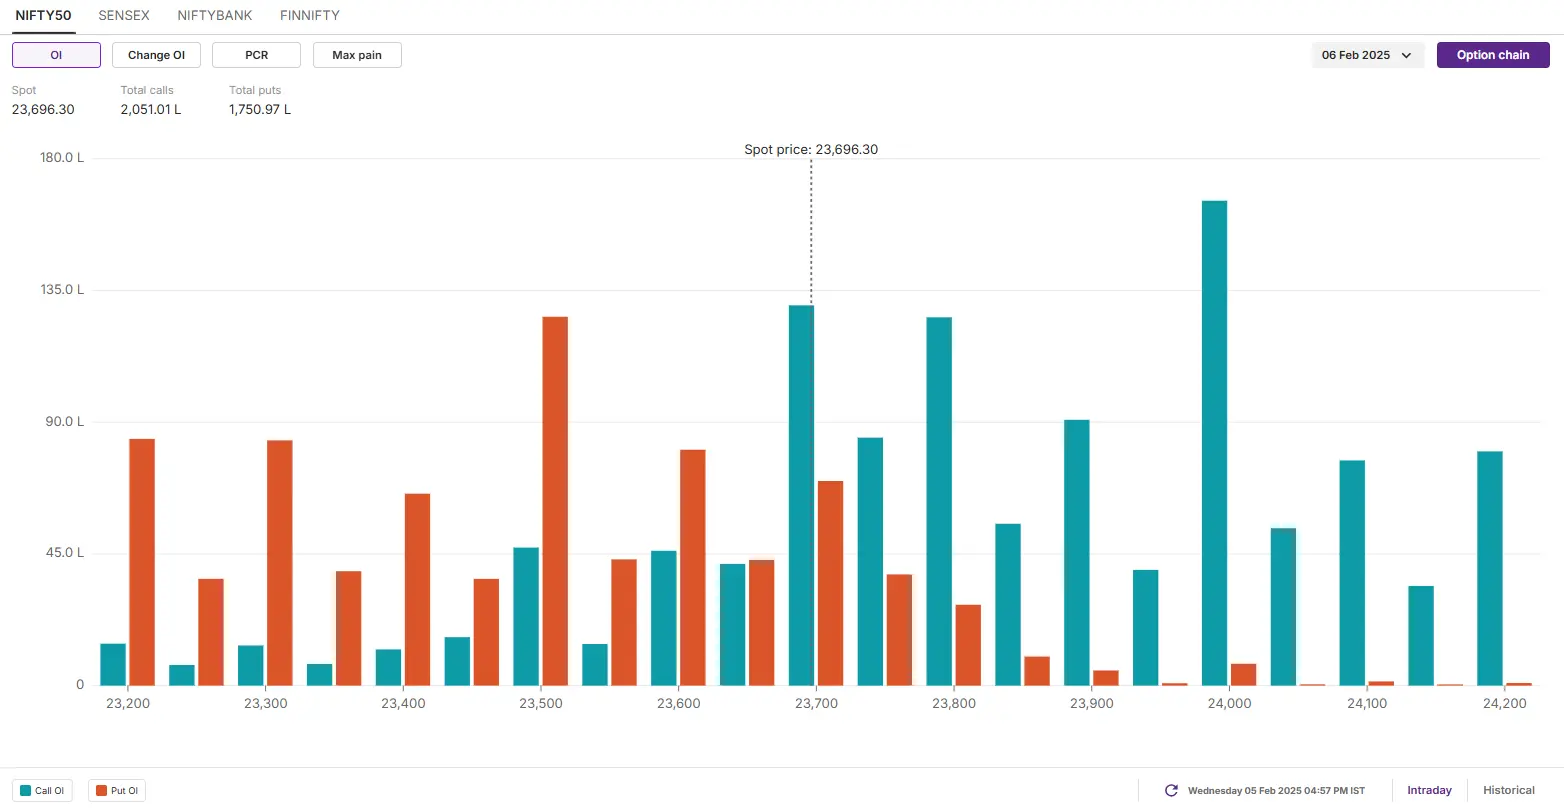
The open interest data for the 6 February expiry saw a significant call base at the 24,000 strike, indicating resistance for the index around this zone. On the flip side, the put base was seen at 23,500 strike, suggesting support for the index around this zone.
SENSEX
- Max call OI: 78,500
- Max put OI: 77,000
- (30 Strikes from ATM, Expiry: 11 Feb)
The SENSEX traded within a narrow range on February 5th, briefly surpassing the 78,700 resistance level before retreating. Profit-taking ultimately pushed the index into negative territory by the close. This price action resulted in a pause candle on the daily chart, signaling a period of consolidation following the recent upward trend.
Despite this pause, the SENSEX's technical outlook remains positive. The 21-day exponential moving average (EMA) is providing immediate support, and the index's positive trend and breadth are expected to continue as long as it holds above this key level on a closing basis. Looking ahead, the 80,000 zone represents a significant resistance barrier.
FII-DII activity
Stock scanner
- Long build-up: Union Bank, Abbott India, Angel One, Glenmark Pharmaceuticals and Apollo Hospitals
- Short build-up: Godrej Properties, Asian Paints, Page Industries, Torrent Power and Phoenix Mills
- Top traded futures contracts: State Bank of India, HDFC Bank, Titan, Bajaj Finance and Asian Paints
- Top traded options contracts: Bajaj Finance 8500 CE, Kalyan Jewellers 600 CE, Kalyan Jewellers 580 CE, Titan 3500 PE and BSE 5700 CE
- Under F&O ban: Nil
In Futures and Options or F&O, long build-up means an increase in Open Interest (OI) along with an increase in price, and short build-up means an increase in Open Interest(OI) along with a decrease in price. Source: Upstox and NSE.
Disclaimer: Derivatives trading must be done only by traders who fully understand the risks associated with them and strictly apply risk mechanisms like stop-losses. The information is only for consumption by the client and such material should not be redistributed. We do not recommend any particular stock, securities and strategies for trading. The securities quoted are exemplary and are not recommendatory. The stock names mentioned in this article are purely for showing how to do analysis. Take your own decision before investing.
About The Author
Next Story


