Market News
Trade setup for Feb 28: Fifth month in the red? NIFTY50 awaits key monthly close
.png)
4 min read | Updated on February 28, 2025, 08:24 IST


SUMMARY
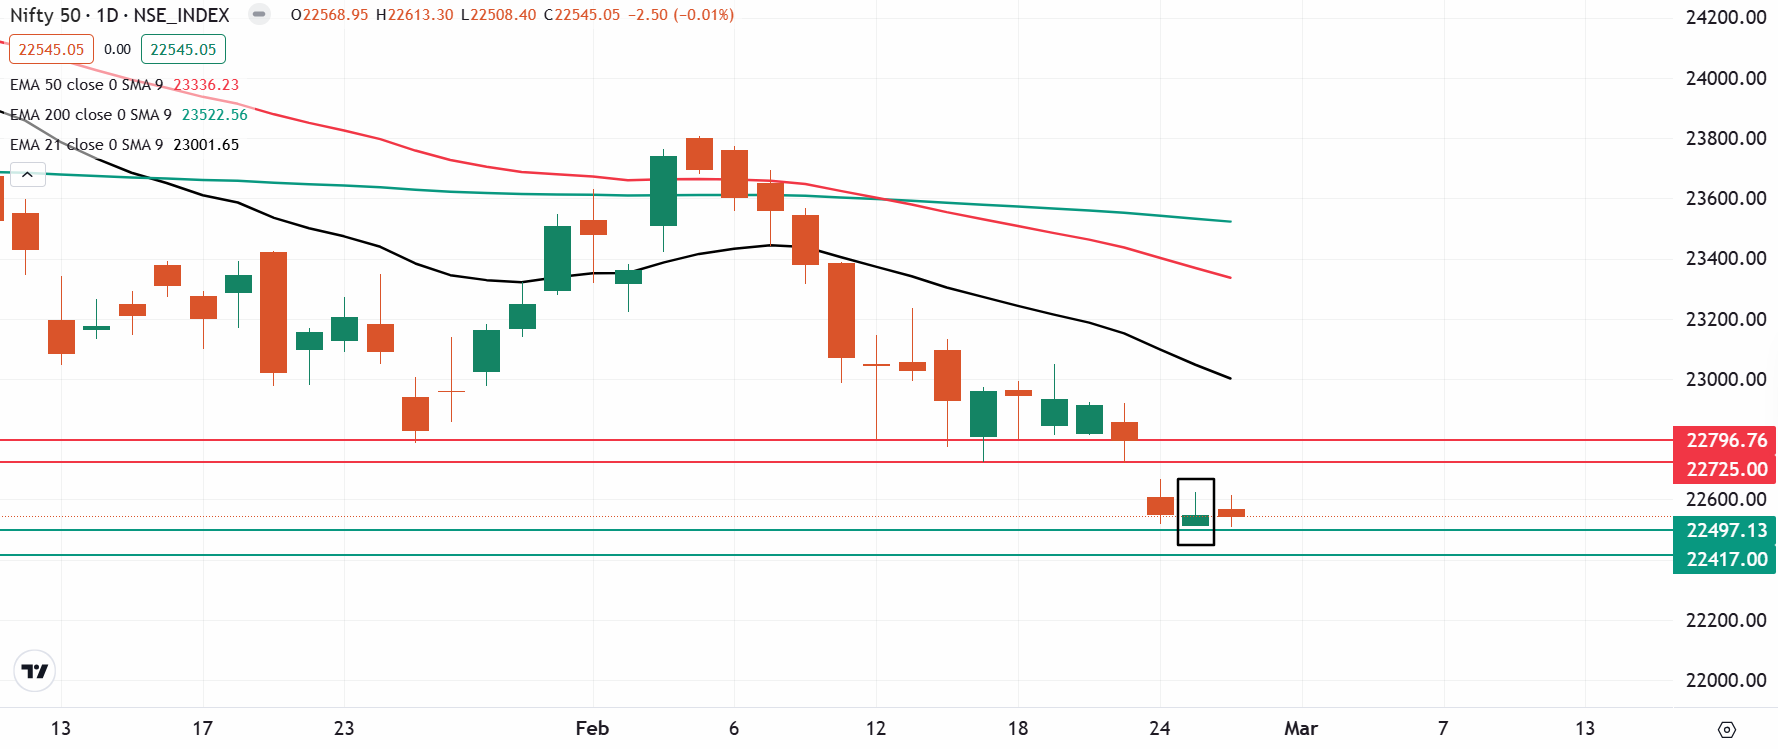
The NIFTY50 index has slipped below its January low of 22,786 and is currently hovering around the critical support zone of 22,500. It has remained in negative territory for four consecutive months and is on track for another weak close in February. Traders should closely watch today’s price action, as a close below the previous month's low could signal further downside momentum.
Stock list

The NIFTY50 index traded within a narrow range for the second consecutive day, closing the February monthly expiry on a flat-to-negative note. | Image: Shutterstock
Asian markets @ 7 am
- GIFT NIFTY: 22,530 (-0.53%)
- Nikkei 225: 37,182 (-2.89%)
- Hang Seng: 23,367 (-1.48%)
U.S. market update
- Dow Jones: 43,239 (▼0.4%)
- S&P 500: 5,861 (▼1.5%)
- Nasdaq Composite: 18,544 (▼2.7%)
U.S. indices closed lower on Thursday in a volatile session after U.S. President Donald Trump declared that his proposed tariffs on Mexico and Canada will go into effect from March 4. Moreover, he announced additional 10% tariff on China.
Meanwhile, shares of Nvidia slipped over 7% despite the AI chip giant exceeding fourth-quarter estimates. The company issued strong guidance reflecting robuts demand but missed gross margins for the quarter and reported lowest revenue bear in two years.
NIFTY50
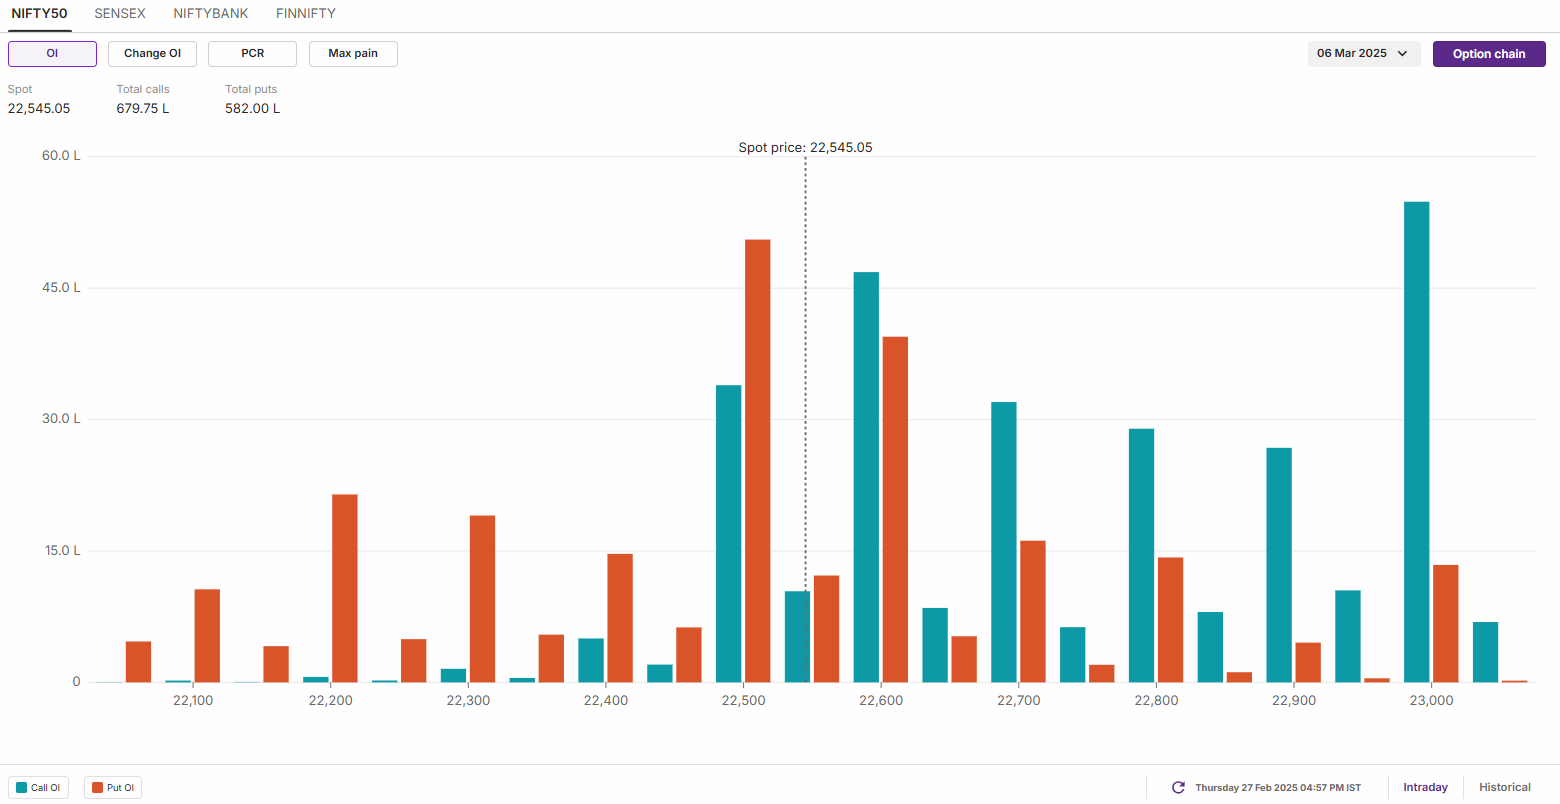
- Max call OI: 23,000
- Max put OI: 22,500
- (10 Strikes from ATM, Expiry: 6 March)
The NIFTY50 index traded within a narrow range for the second consecutive day, closing the February monthly expiry on a flat-to-negative note. On the daily chart, it formed a doji candlestick pattern, signaling indecision among traders.
This follows the formation of an inverted hammer candlestick pattern on February 25—a bullish reversal signal that typically appears after a downtrend. The pattern consists of a small body and a long upper wick, suggesting potential buying interest. However, confirmation remains pending, as the index has yet to close above the high or below the low of the pattern.
In the upcoming sessions, traders should watch these key levels closely. A close above the high of the inverted hammer could drive a rebound toward the 22,800 zone, while a close below the low would indicate further weakness.
The initial open interest (OI) data for the March 6th expiry saw significant call OI build-up at 23,000 strike, suggesting resistance for the index around this zone. On the flip side, the put base was observed at 22,500 strike, pointing support for the index around this level.
SENSEX
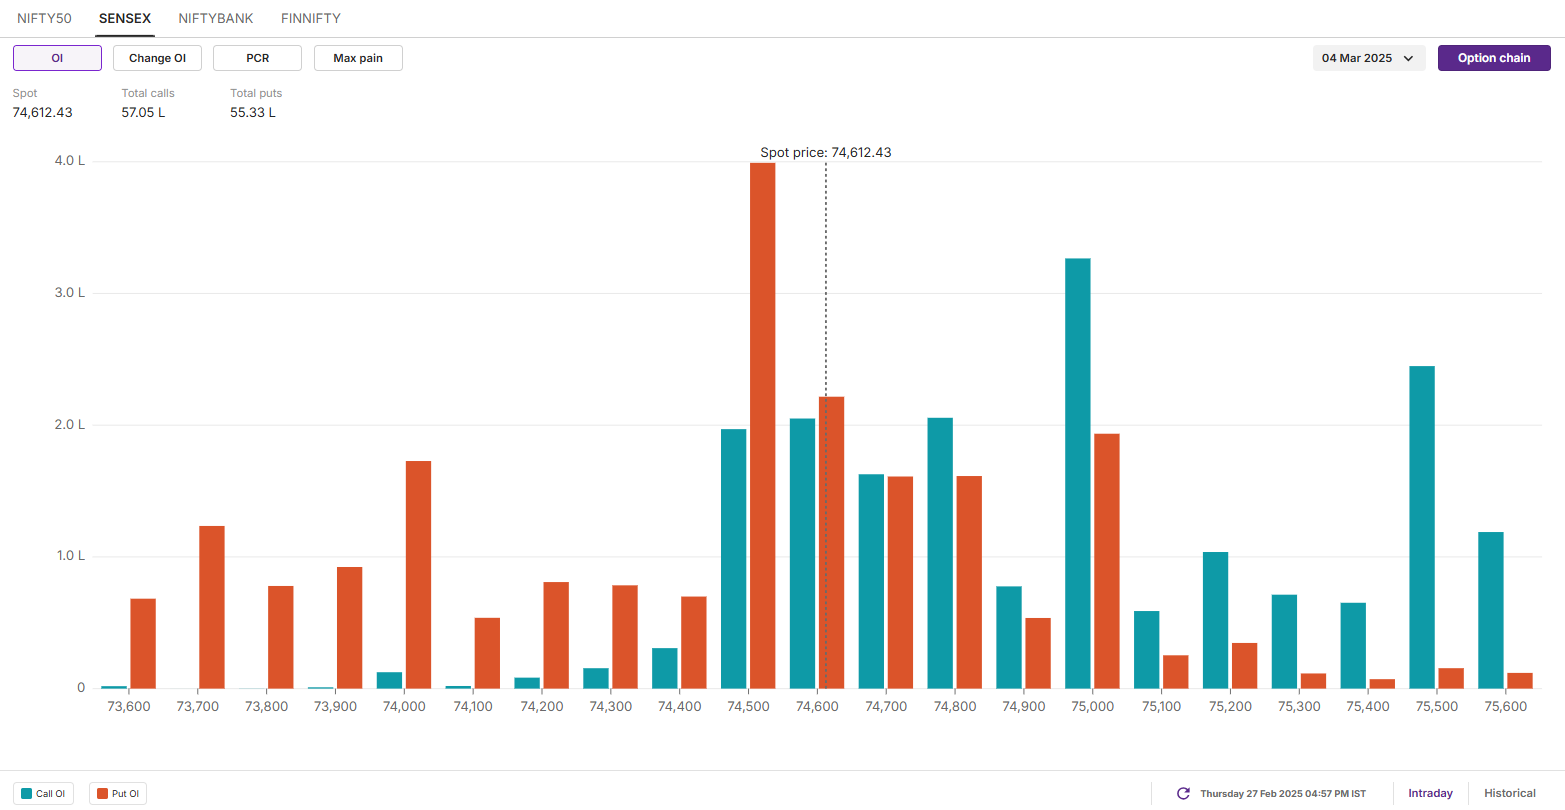
- Max call OI: 75,000
- Max put OI: 74,500
- (20 Strikes from ATM, Expiry: 4 March)
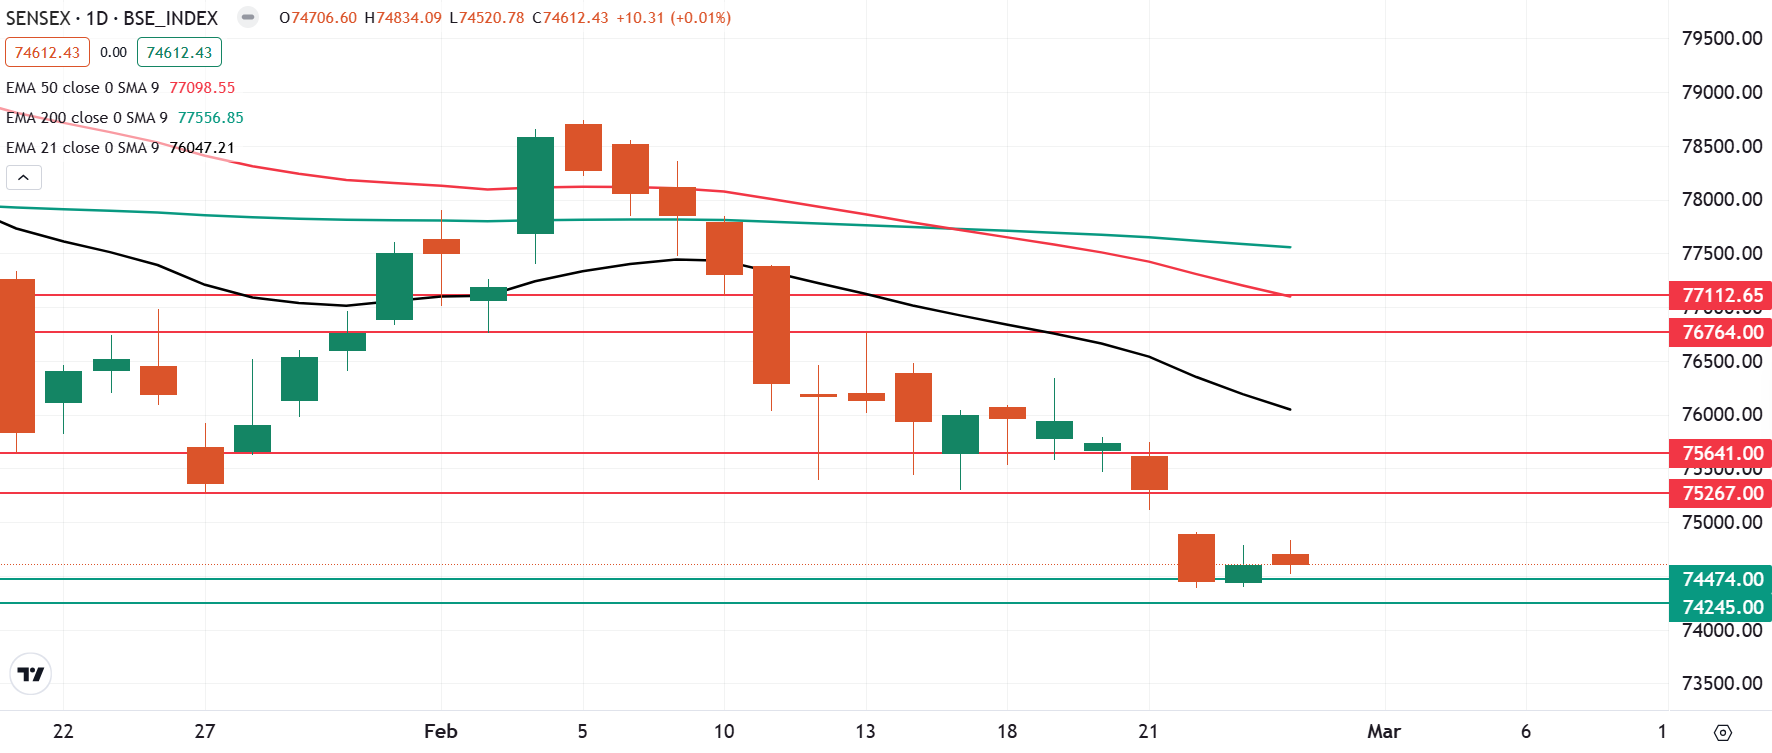
The SENSEX continued its range-bound movement for the second consecutive day, consolidating around the immediate support zone of 74,500. The index also formed a doji candlestick pattern, following the inverted hammer formation on February 25.
From a technical standpoint, the broader trend of the SENSEX remains weak, with immediate support near the 74,400 zone. However, in the short term, the index is in oversold territory, having failed to close above the previous session’s high for the last sixteen trading sessions.
In the coming sessions, traders should closely monitor the high and low of the inverted hammer candlestick pattern. A decisive close above or below these levels will offer clearer directional signals.
The open interest (OI) data for the March 4 expiry saw significant put OI at74,500 strike, suggesting support for the index around this level. On the other hand, the call base was seen at 75,000 strike, pointing resistance for the index around this zone.
FII-DII activity
Stock scanner
- Long build-up: Cholamandalam Investment, AB Capital, Voltas, Petronet LNG and SRF
- Short build-up: KEI Industries, Polycab, BSE, Havells, Varun Beverages and Indian Energy Exchange
- Top traded futures contracts: HDFC Bank, IDFC First Bank, Yes Bank, Canara Bank and Punjab National Bank
- Top traded options contracts: Polycab 5000 CE, Polycab 5000 PE, Bajaj Finance 8700 CE, BSE 5000 PE and Bajaj Finance 8500 CE
- Under F&O ban: N/A
In Futures and Options or F&O, long build-up means an increase in Open Interest (OI) along with an increase in price, and short build-up means an increase in Open Interest(OI) along with a decrease in price. Source: Upstox and NSE.
Disclaimer: Derivatives trading must be done only by traders who fully understand the risks associated with them and strictly apply risk mechanisms like stop-losses. The information is only for consumption by the client and such material should not be redistributed. We do not recommend any particular stock, securities and strategies for trading. The securities quoted are exemplary and are not recommendatory. The stock names mentioned in this article are purely for showing how to do analysis. Take your own decision before investing.
About The Author
Next Story


