Market News
Trade setup for Feb 24: NIFTY50 set for a move after six days of consolidation; can it hold 22,500?
.png)
4 min read | Updated on February 24, 2025, 07:17 IST


SUMMARY
The NIFTY50 index has immediate support in the zone of 22,500 to 22,400. A close below 22,500 could trigger further correction toward 22,200. On the upside, the 23,100 range will act as a key resistance level for the index.
Stock list
The NIFTY50 index closed on a negative note on February 21, breaking below the lows of the previous three sessions and signaling weakness. | Image: Shutterstock
Asian markets @ 7 am
- GIFT NIFTY: 22,683 (-0.48%)
- Nikkei 225: Closed
- Hang Seng: 23,472 (-0.02%)
U.S. market update
- Dow Jones: 43,428 (▼1.6%)
- S&P 500: 6,013 (▼1.7%)
- Nasdaq Composite: 19,524 (▼2.2%)
U.S. indices tumbled on Friday, posting their steepest declines since December 18, as economic and concerns the tariffs weighed on investor sentiment. Market sentiment weakened after S&P Global’s survey showed disappointing activity in the manufacturing and services sectors.
This comes after investors digested Walmart’s weak outlook on Thursday, further dampening confidence. Furthermore, shares of UnitedHealth Group (UNH) fell over 7% after reports surfaced that the Department of Justice is investigating the company’s Medicare billing practices, adding pressure to the broader healthcare sector.
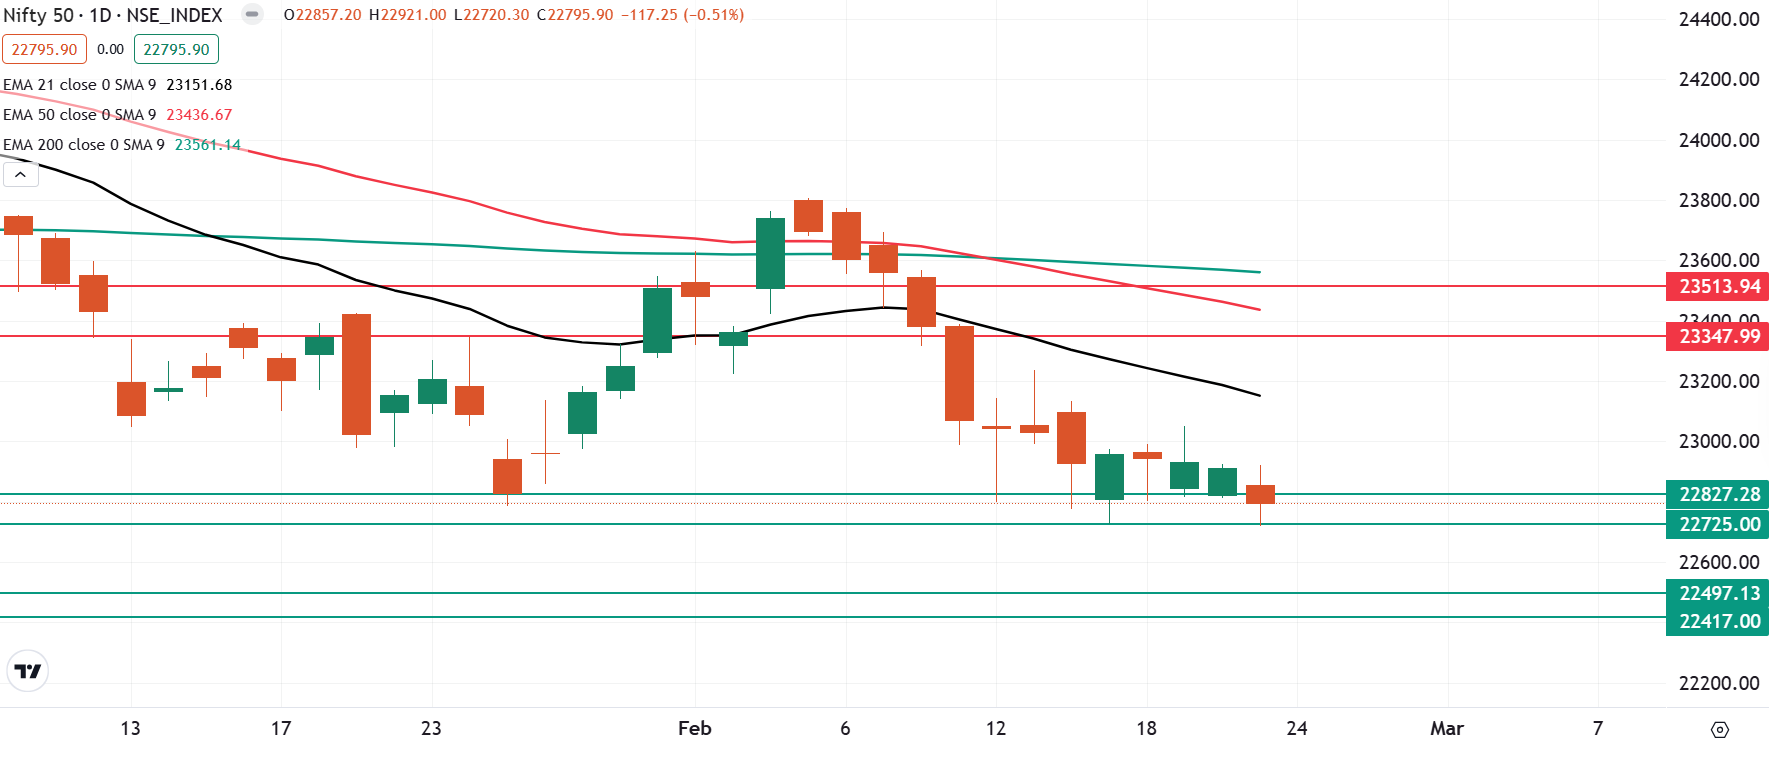
NIFTY50
- February Futures: 22,822 (▼0.6%)
- Open interest: 2,01,100 (▼7.9%)
The NIFTY50 index closed on a negative note on February 21, breaking below the lows of the previous three sessions and signaling weakness. It also ended at its lowest level in eight months, reinforcing a bearish outlook for the broader market.
From the technical standpoint, the index broke the six-day consolidation and closed below the crucial 22,800 level. However, it is important to note that the short-term structure remains oversold as the index has failed to close above the previous session’s high for the last thirteen trading sessions.
In the upcoming sessions, traders can monitor the price action of the index around the crucial support zone of 22,400-22,500. A close and breakdown of this zone could signal further weakness. On the flip side, if the index holds this zone on a closing basis, it may consolidate between 22,400 and 23,100 range. A close above the immediate resistance zone of 23,100 will lead to further pullback rally.
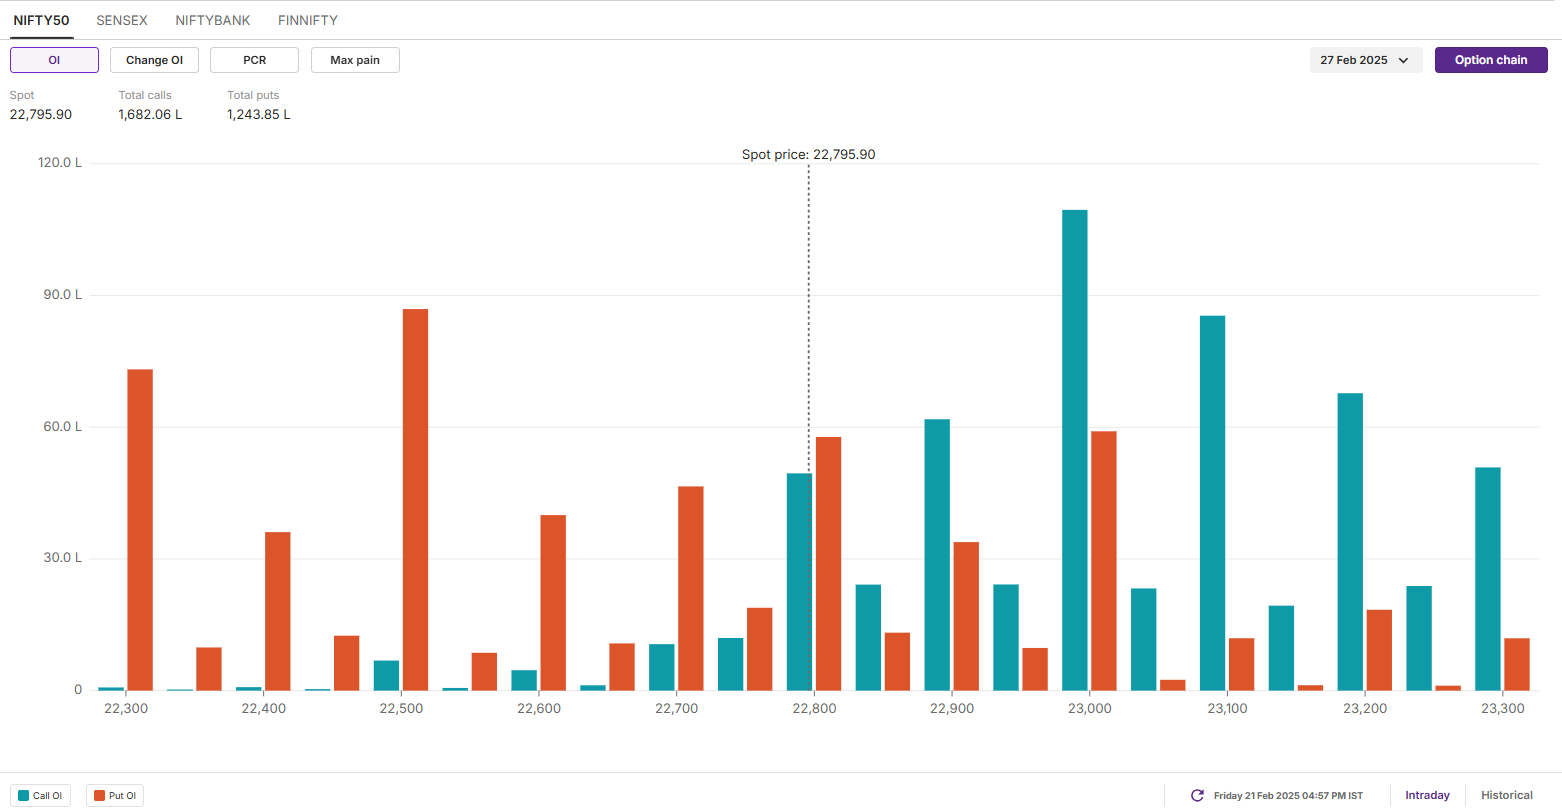
The open interest data for the 27 February expiry saw significant call options build-up at 23,000 strike, indicating resistance for the index around this zone. Conversely, the base of the put options was observed at 22,500 strike, pointing at support for the index around this zone.
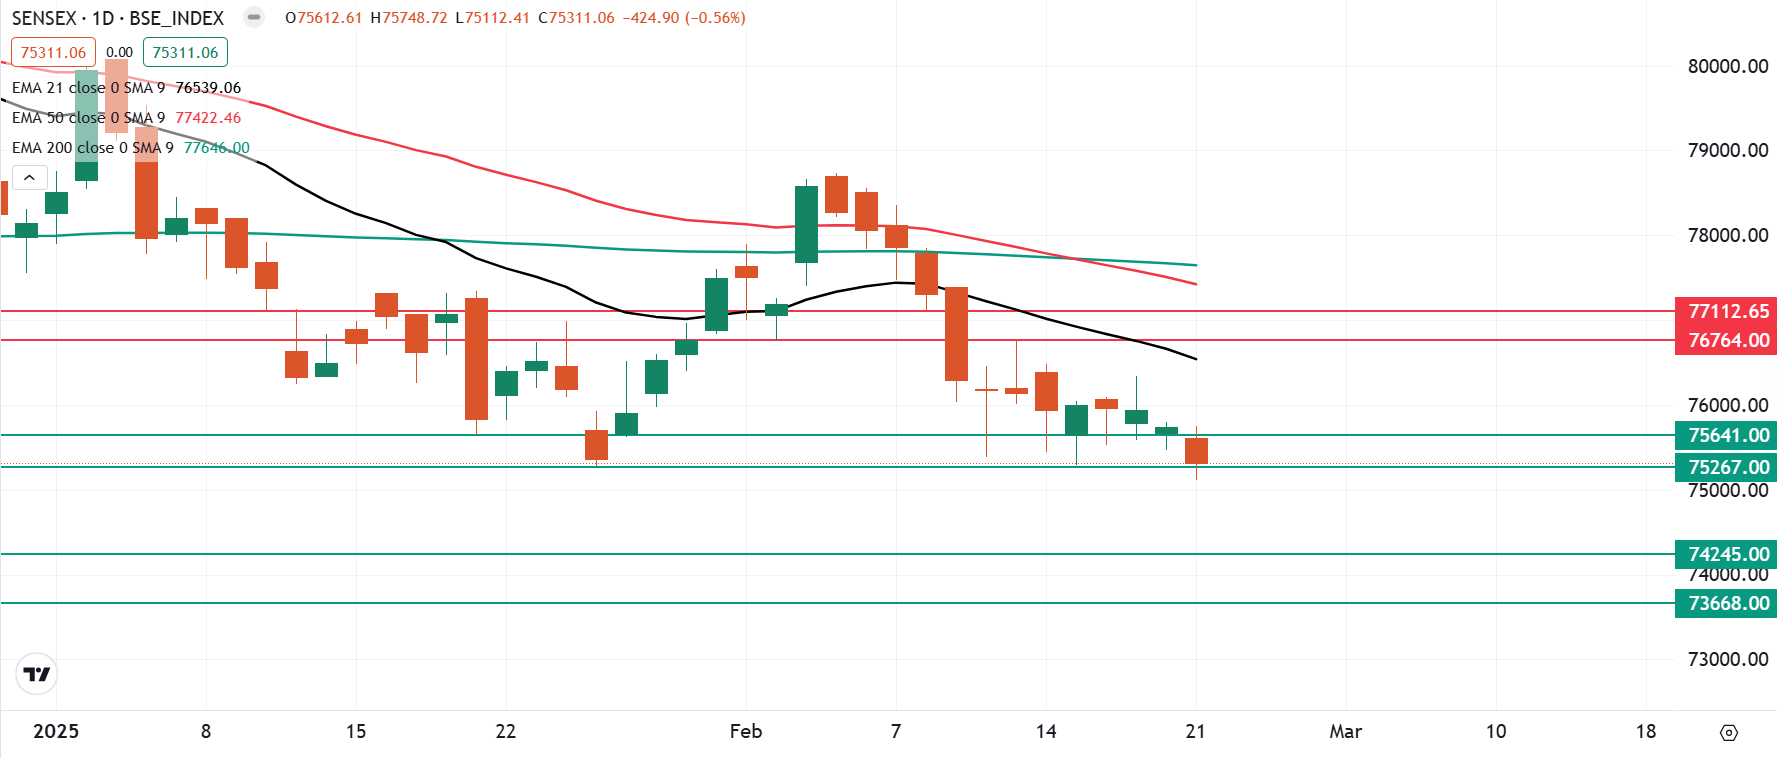
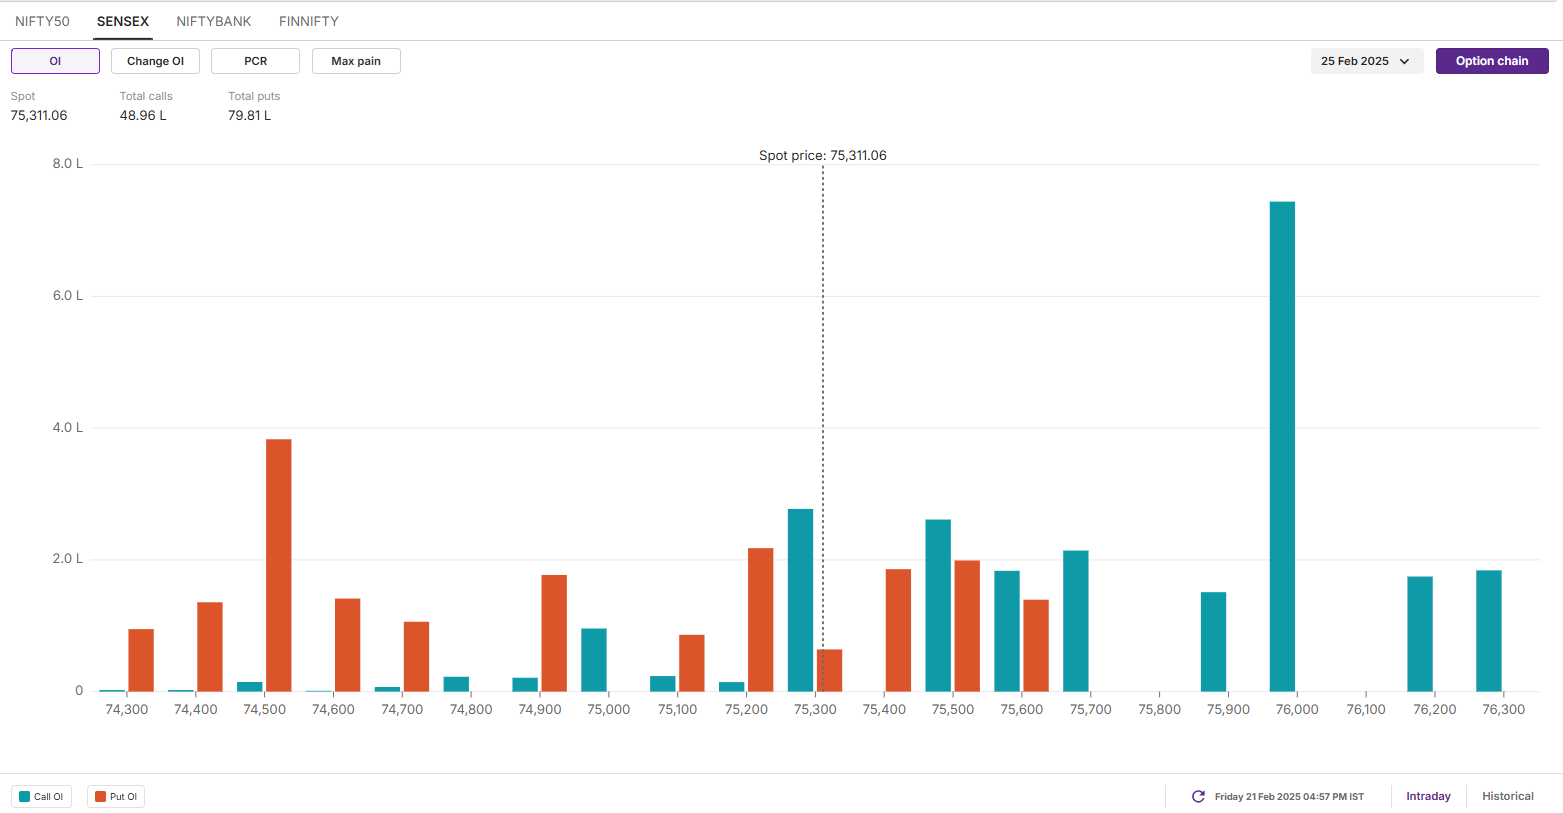
SENSEX
- Max call OI: 76,000
- Max put OI: 73,500
- (20 Strikes from ATM, Expiry: 25 Feb)
The SENSEX extended its losing streak for the fourth consecutive session, closing in the red on February 21. It broke out of a six-day consolidation phase and ended below the lows of the previous three sessions, marking its weakest close since June 2024.
The technical structure of the index remains weak on the daily chart, as it closed near last week’s low and just above the critical support zone of 75,200. A decisive break and close below this level could trigger further downside, potentially extending the decline toward the 74,500 zone. The next major support lies around 74,200, and a breakdown below this level could accelerate bearish momentum. On the upside, immediate resistance is seen near the 76,500 zone.
The open interest (OI) build-up for the February 25th expiry saw significant call OI build-up at the 76,000 strike. This indicates that the index may face resistance around this zone. On the flip side, the base of the put options was seen at 74,500 strike but with relatively low volume.
FII-DII activity
Stock scanner
- Long build-up: JSW Energy, KEI Industries and Varun Beverages
- Short build-up: Mahindra and Mahindra, Cyient, Divi’s Laboratories, Bharat Petroleum and Wipro
- Top traded futures contracts: HDFC Bank, Axis Bank, Reliance Industries, ICICI Bank and State Bank of India
- Top traded options contracts: BSE 6,000 CE, M&M 2,700 PE, TCS 3,800 CE and RELIANCE 1,230 CE
- Under F&O ban: Chambal Fertilisers and Manappuram Finance
- Added under F&O ban: Chambal Fertilisers
In Futures and Options or F&O, long build-up means an increase in Open Interest (OI) along with an increase in price, and short build-up means an increase in Open Interest(OI) along with a decrease in price. Source: Upstox and NSE.
Disclaimer: Derivatives trading must be done only by traders who fully understand the risks associated with them and strictly apply risk mechanisms like stop-losses. The information is only for consumption by the client and such material should not be redistributed. We do not recommend any particular stock, securities and strategies for trading. The securities quoted are exemplary and are not recommendatory.

About The Author
Next Story


