Market News
Trade setup for Feb 13: NIFTY50 bounces back from January lows, forms Doji on daily chart
.png)
5 min read | Updated on February 13, 2025, 07:23 IST


SUMMARY
The NIFTY50 index took support from the crucial support zone of 22,700 and rebounded over 1%. However, the index formed a doji candlestick pattern on the daily chart, indicating indecision around current levels. For further clues, traders should monitor the high and the low of the doji candle. A close above or below these levels will provide further clues.
Stock list
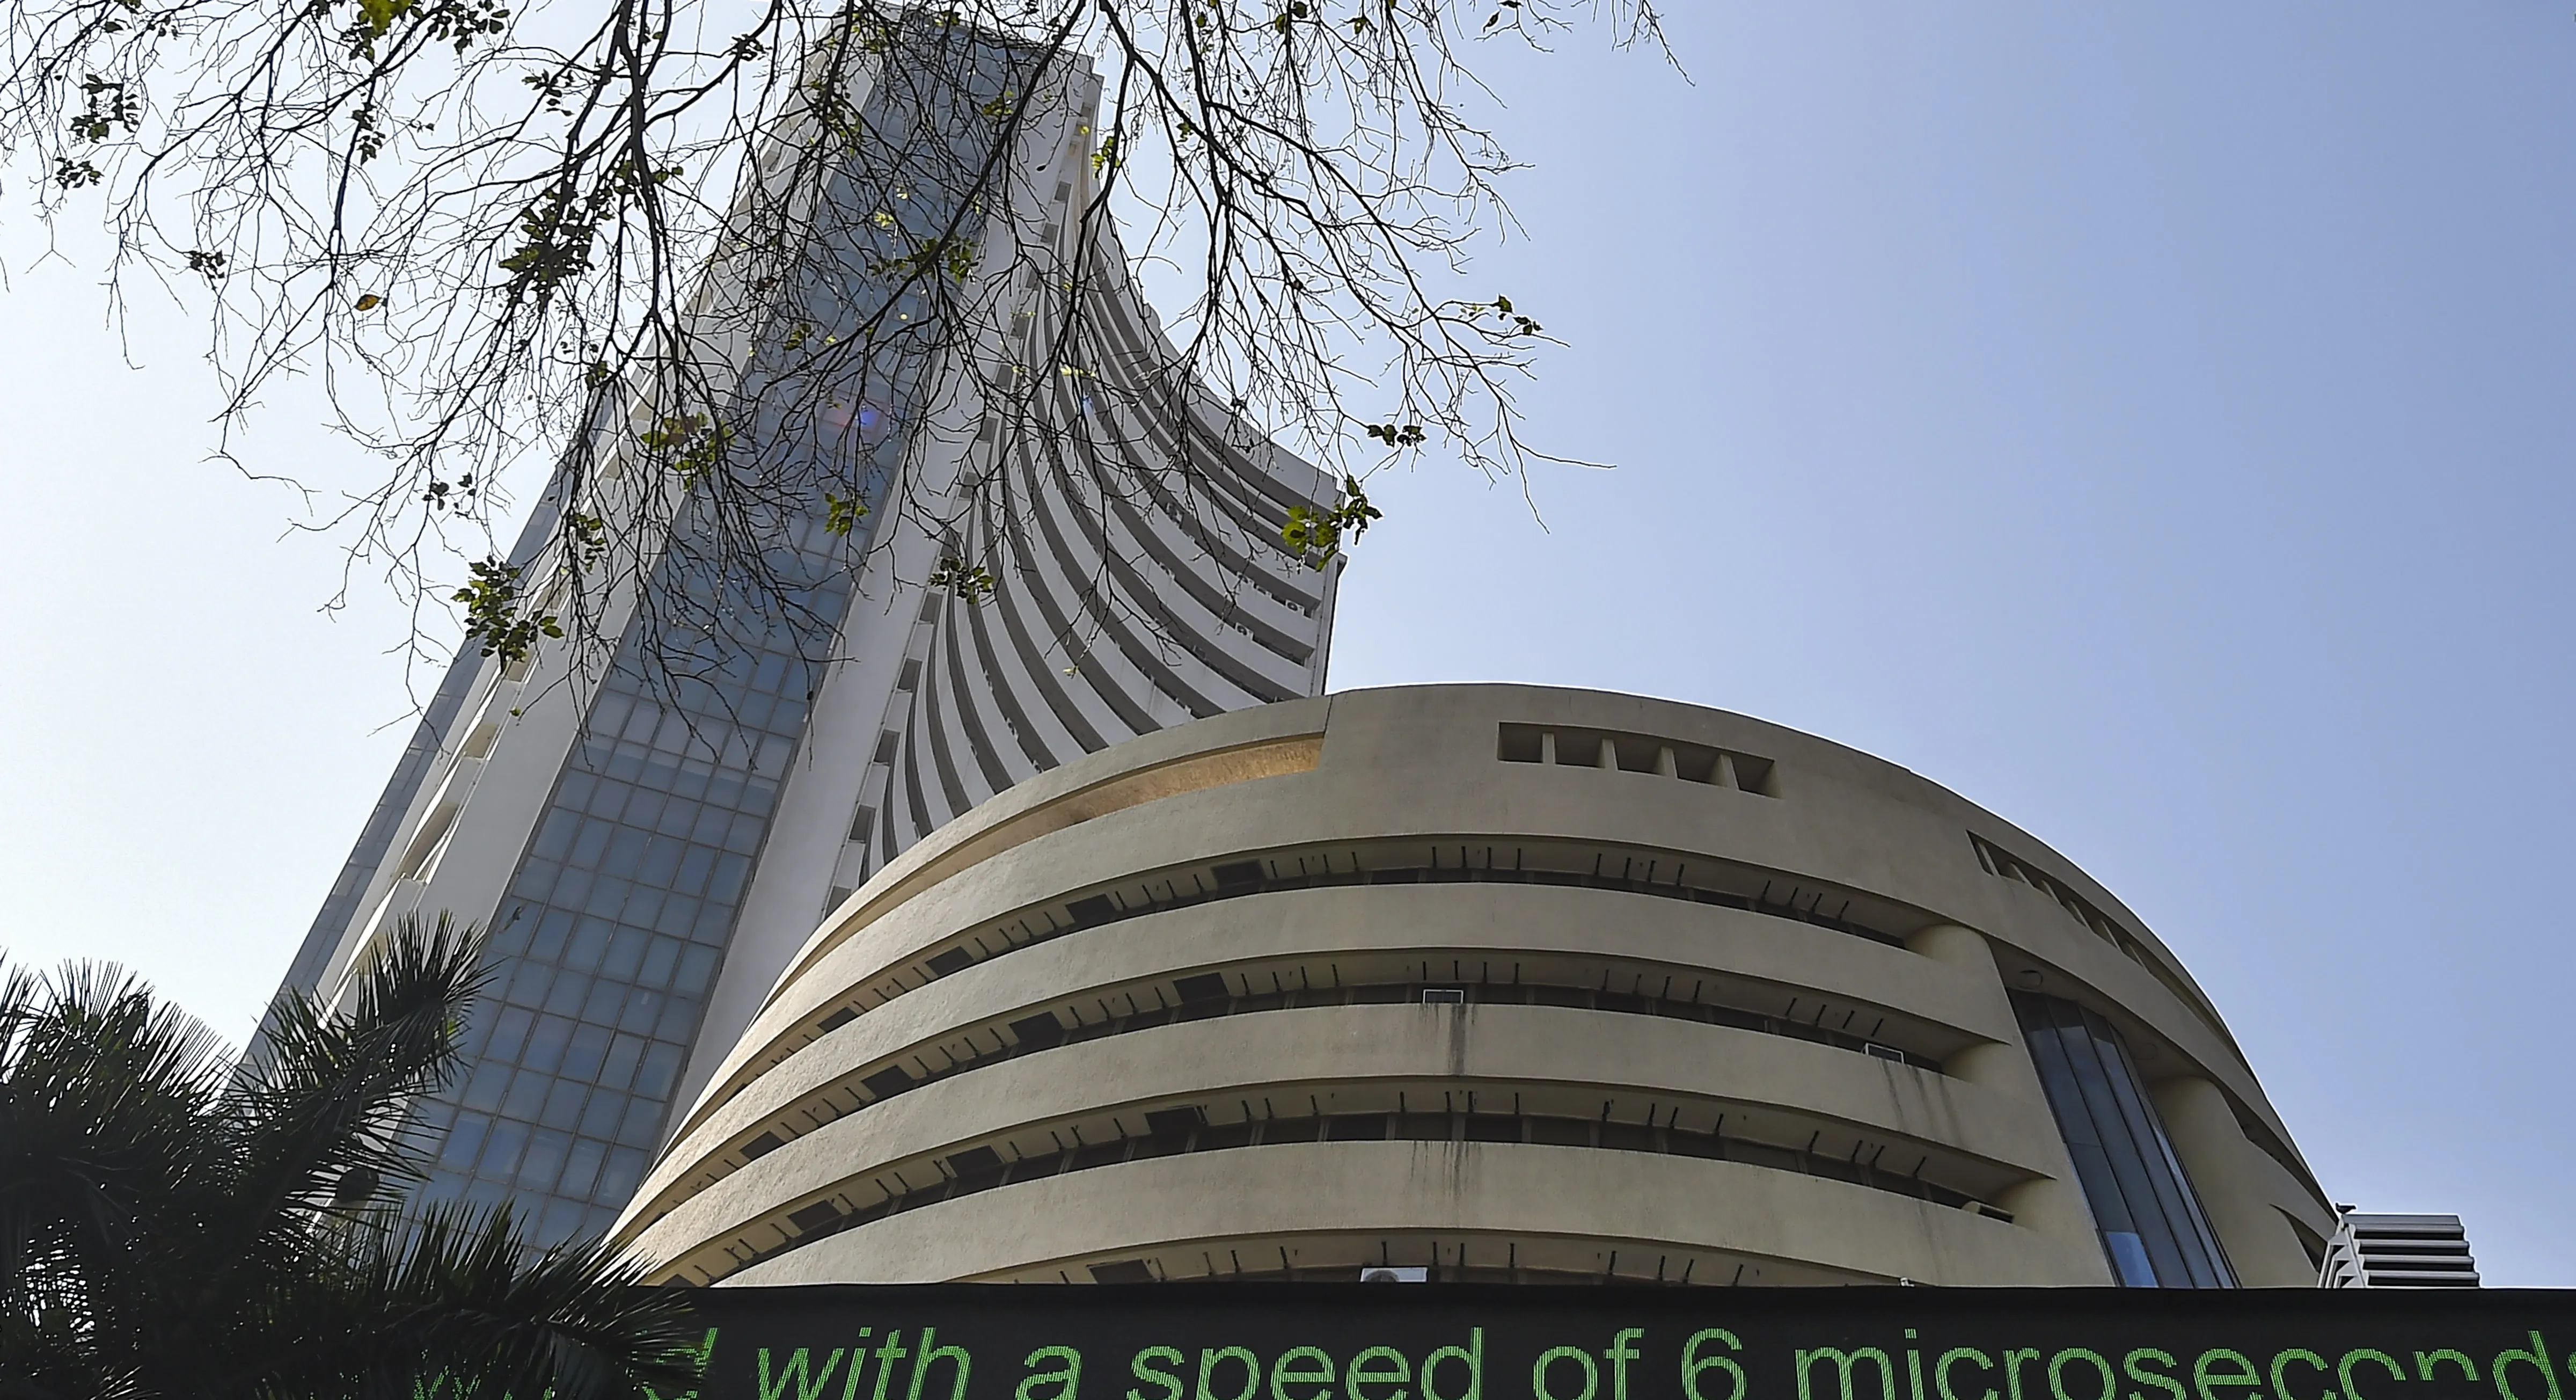
The NIFTY 50 index staged a notable intraday recovery from its session lows, aligning with January’s bottom. | Image: PTI
Asian markets @ 7 am
- GIFT NIFTY: 23,145 (+0.24%)
- Nikkei 225: 39,404 (+1.13%)
- Hang Seng: 22,061 (+0.63%)
U.S. market update
- Dow Jones: 44,368 (▼0.5%)
- S&P 500: 6,051 (▼0.2%)
- Nasdaq Composite: 19,649 (▲0.0%)
U.S. indices closed lower on Wednesday as investors reacted to a hotter-than-expected January inflation report, leading to a reassessment of Federal Reserve rate-cut expectations for 2025.
The Consumer Price Index (CPI) data showed a 3% annual increase in January, slightly higher than December's 2.9% gain. Core inflation, which excludes food and energy, rose 3.3% year-over-year, up from December's 3.2%, marking the first acceleration in core inflation since July.
The unexpected inflation uptick led traders to scale back their expectations for rate cuts. By Wednesday, markets were pricing in just one rate cut for 2025, down from the two that had been widely anticipated earlier in the year.
NIFTY50
- February Futures: 23,153 (▼0.0%)
- Open interest: 2,34,296 (▲1.9%)
The NIFTY 50 index staged a notable intraday recovery from its session lows, aligning with January’s bottom. However, it extended its losing streak to six consecutive sessions, forming a doji candlestick pattern on the daily chart—an indicator of a indecision.
From a technical standpoint, the index remains weak on the daily chart, with immediate support around the 22,700 zone and resistance near 23,600. Unless a decisive breakout occurs beyond this range on a closing basis, the index is likely to stay range-bound.
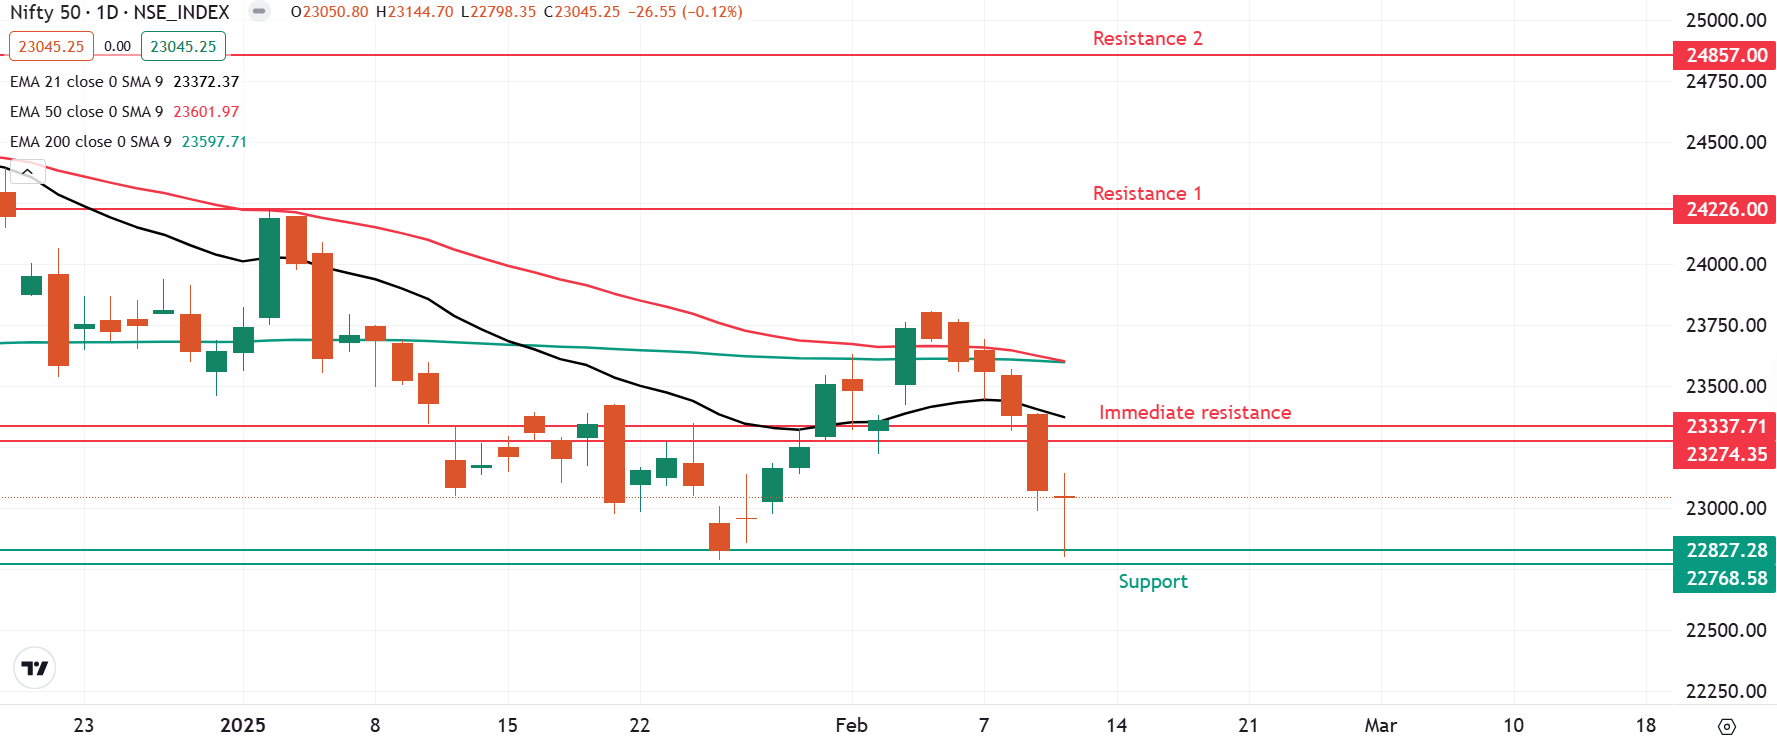
For intraday traders, the 15-minute chart highlights a key range between 23,400 and 22,700 for today’s expiry. A strong breakout beyond this zone could provide further directional cues, while movement within this range suggests continued consolidation.
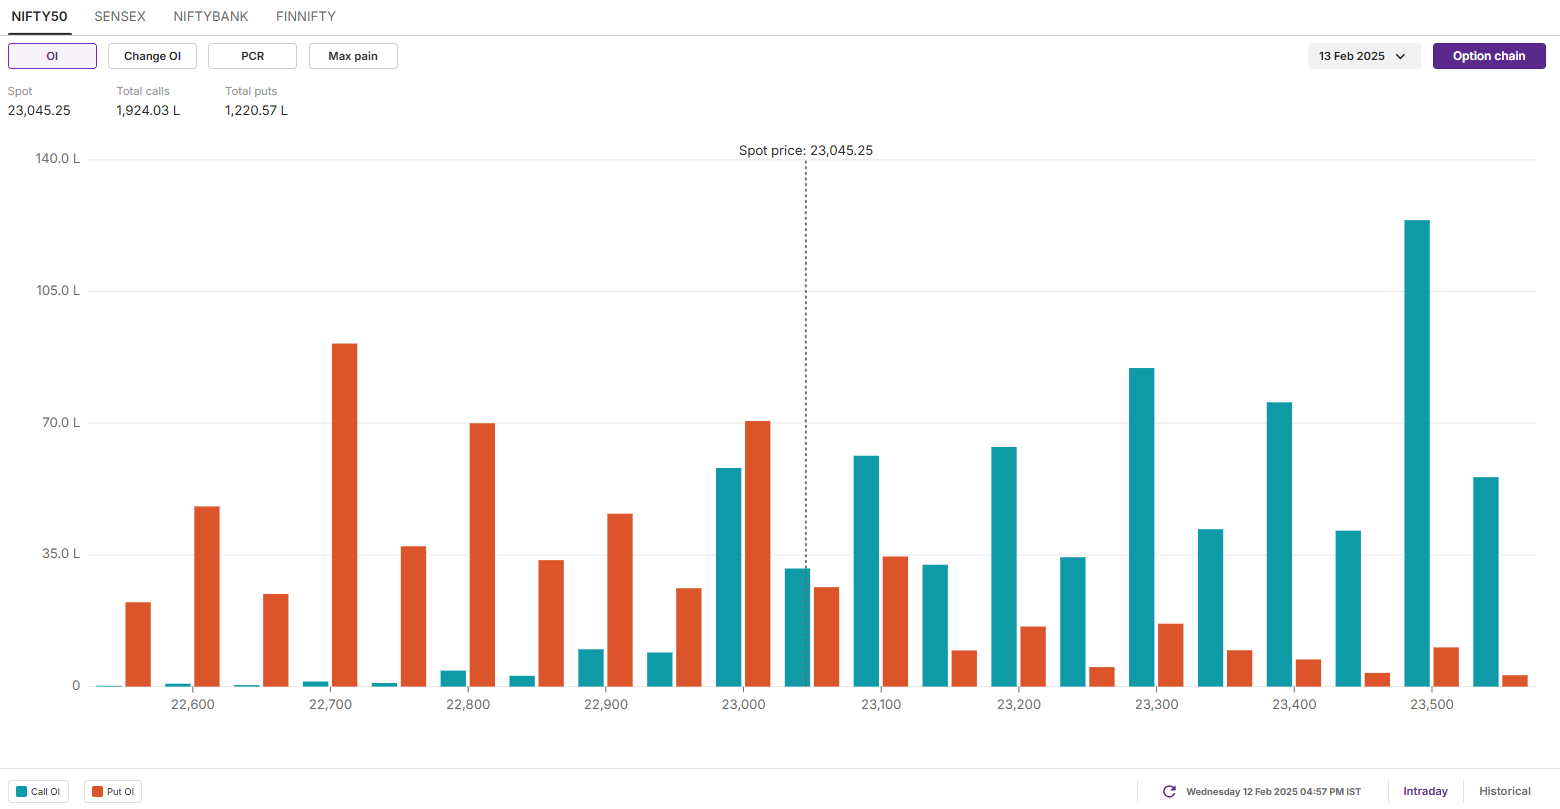
The open interest data for the 13 February expiry sustained the significant call options base at 23,500 strike, pointing at immediate resistance zone for the index around this zone. On the flip side, the put base also remained at 22,700 strike, pointing at support for the index around this zone. Additionally, the index also witnessed open interest addition at the 23,000 strike, indicating likely range-bound activity around this zone.
SENSEX
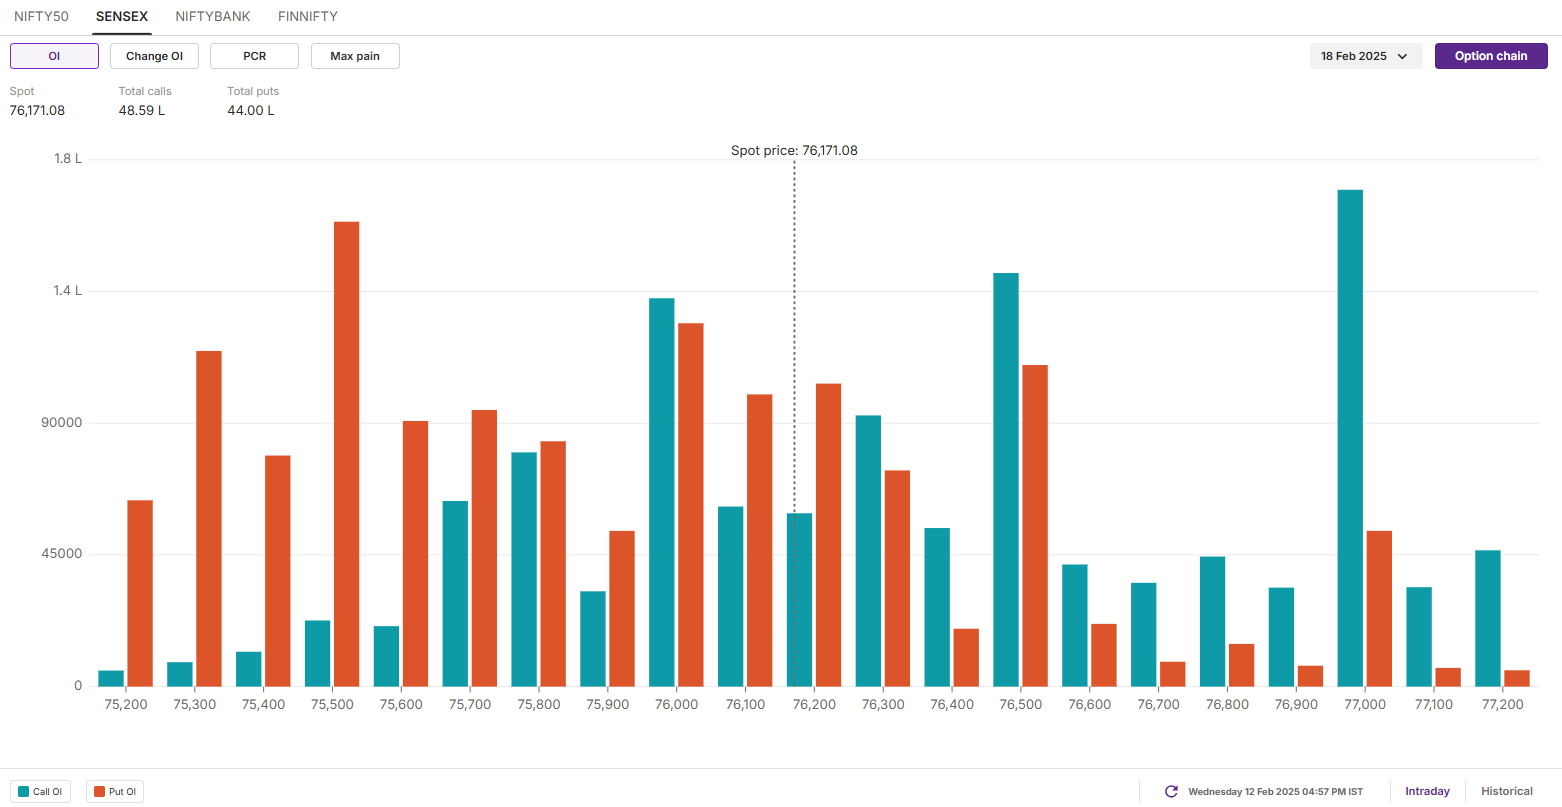
- Max call OI: 77,000
- Max put OI: 75,000
- (30 Strikes from ATM, Expiry: 18 Feb)
After a negative start, SENSEX took support from the lows of the January month and recovered over 1% from the day’s low. The index also formed a doji candlestick pattern on the daily chart, pointing at indecision among investors around current levels.
From the technical standpoint, the SENSEX is currently trading below its 21, 50 and 200-day exponential moving averages (EMAs), indicating that the broader trend of the index remains weak. Positional traders can monitor the range of 78,000 (around 50 EMA) and 75,100 ( January lows). The index is likely to remain range-bound within this zone, while a break of this range on closing basis will provide further directional clues.
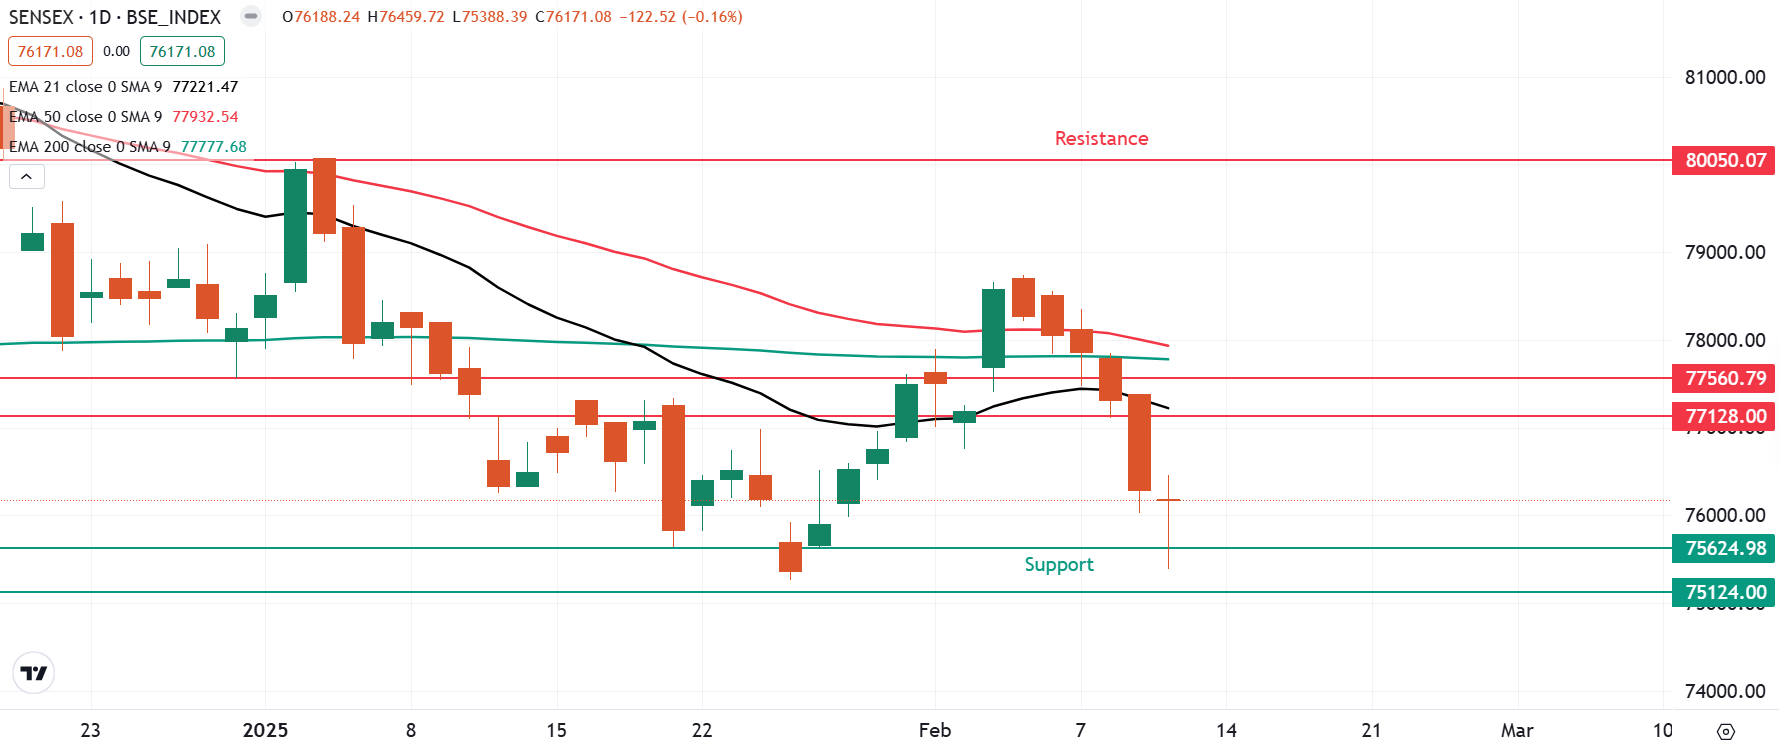
The open interest (OI) data for the 18 February expiry saw significant call OI build-up at 77,000 strike, indicating resistance for the index around this zone. On the flip side, the put OI base was established at 75,500 strike, suggesting support for the index around this zone. Additionally, the index also witnessed significant call and put additions at 76,000 strike, pointing at consolidation around this zone.
FII-DII activity
Stock scanner
- Long build-up: Angel One, PB Fintech, SBI Card, BSE and SBI Life
- Short build-up: Prestige Estates, Godrej Properties, Oberoi Realty, DLF and Jio Financials
- Top traded futures contracts: Reliance Industries, HDFC Bank, ICICI Bank, State Bank of India and Infosys
- Top traded options contracts: Dixon 14,000 PE, BSE 5,300 CE, HAL 3,600 CE, HAL 3,500 PE and Bharti Airtel 1,700 CE
- Under F&O ban: Manappuram Finance
In Futures and Options or F&O, long build-up means an increase in Open Interest (OI) along with an increase in price, and short build-up means an increase in Open Interest(OI) along with a decrease in price. Source: Upstox and NSE.
Disclaimer: Derivatives trading must be done only by traders who fully understand the risks associated with them and strictly apply risk mechanisms like stop-losses. The information is only for consumption by the client and such material should not be redistributed. We do not recommend any particular stock, securities and strategies for trading. The securities quoted are exemplary and are not recommendatory. The stock names mentioned in this article are purely for showing how to do analysis. Take your own decision before investing.

About The Author
Next Story


