Market News
Trade Setup for Dec 11: NIFTY50 takes support around 24,500, extends consolidation for the third day
.png)
4 min read | Updated on December 11, 2024, 08:53 IST
SUMMARY
The NIFTY50 continued to trade in a defined range, finding support at 24,500 and resistance at 24,800. A decisive break above this range in either direction could set the stage for the market's next move.
Stock list
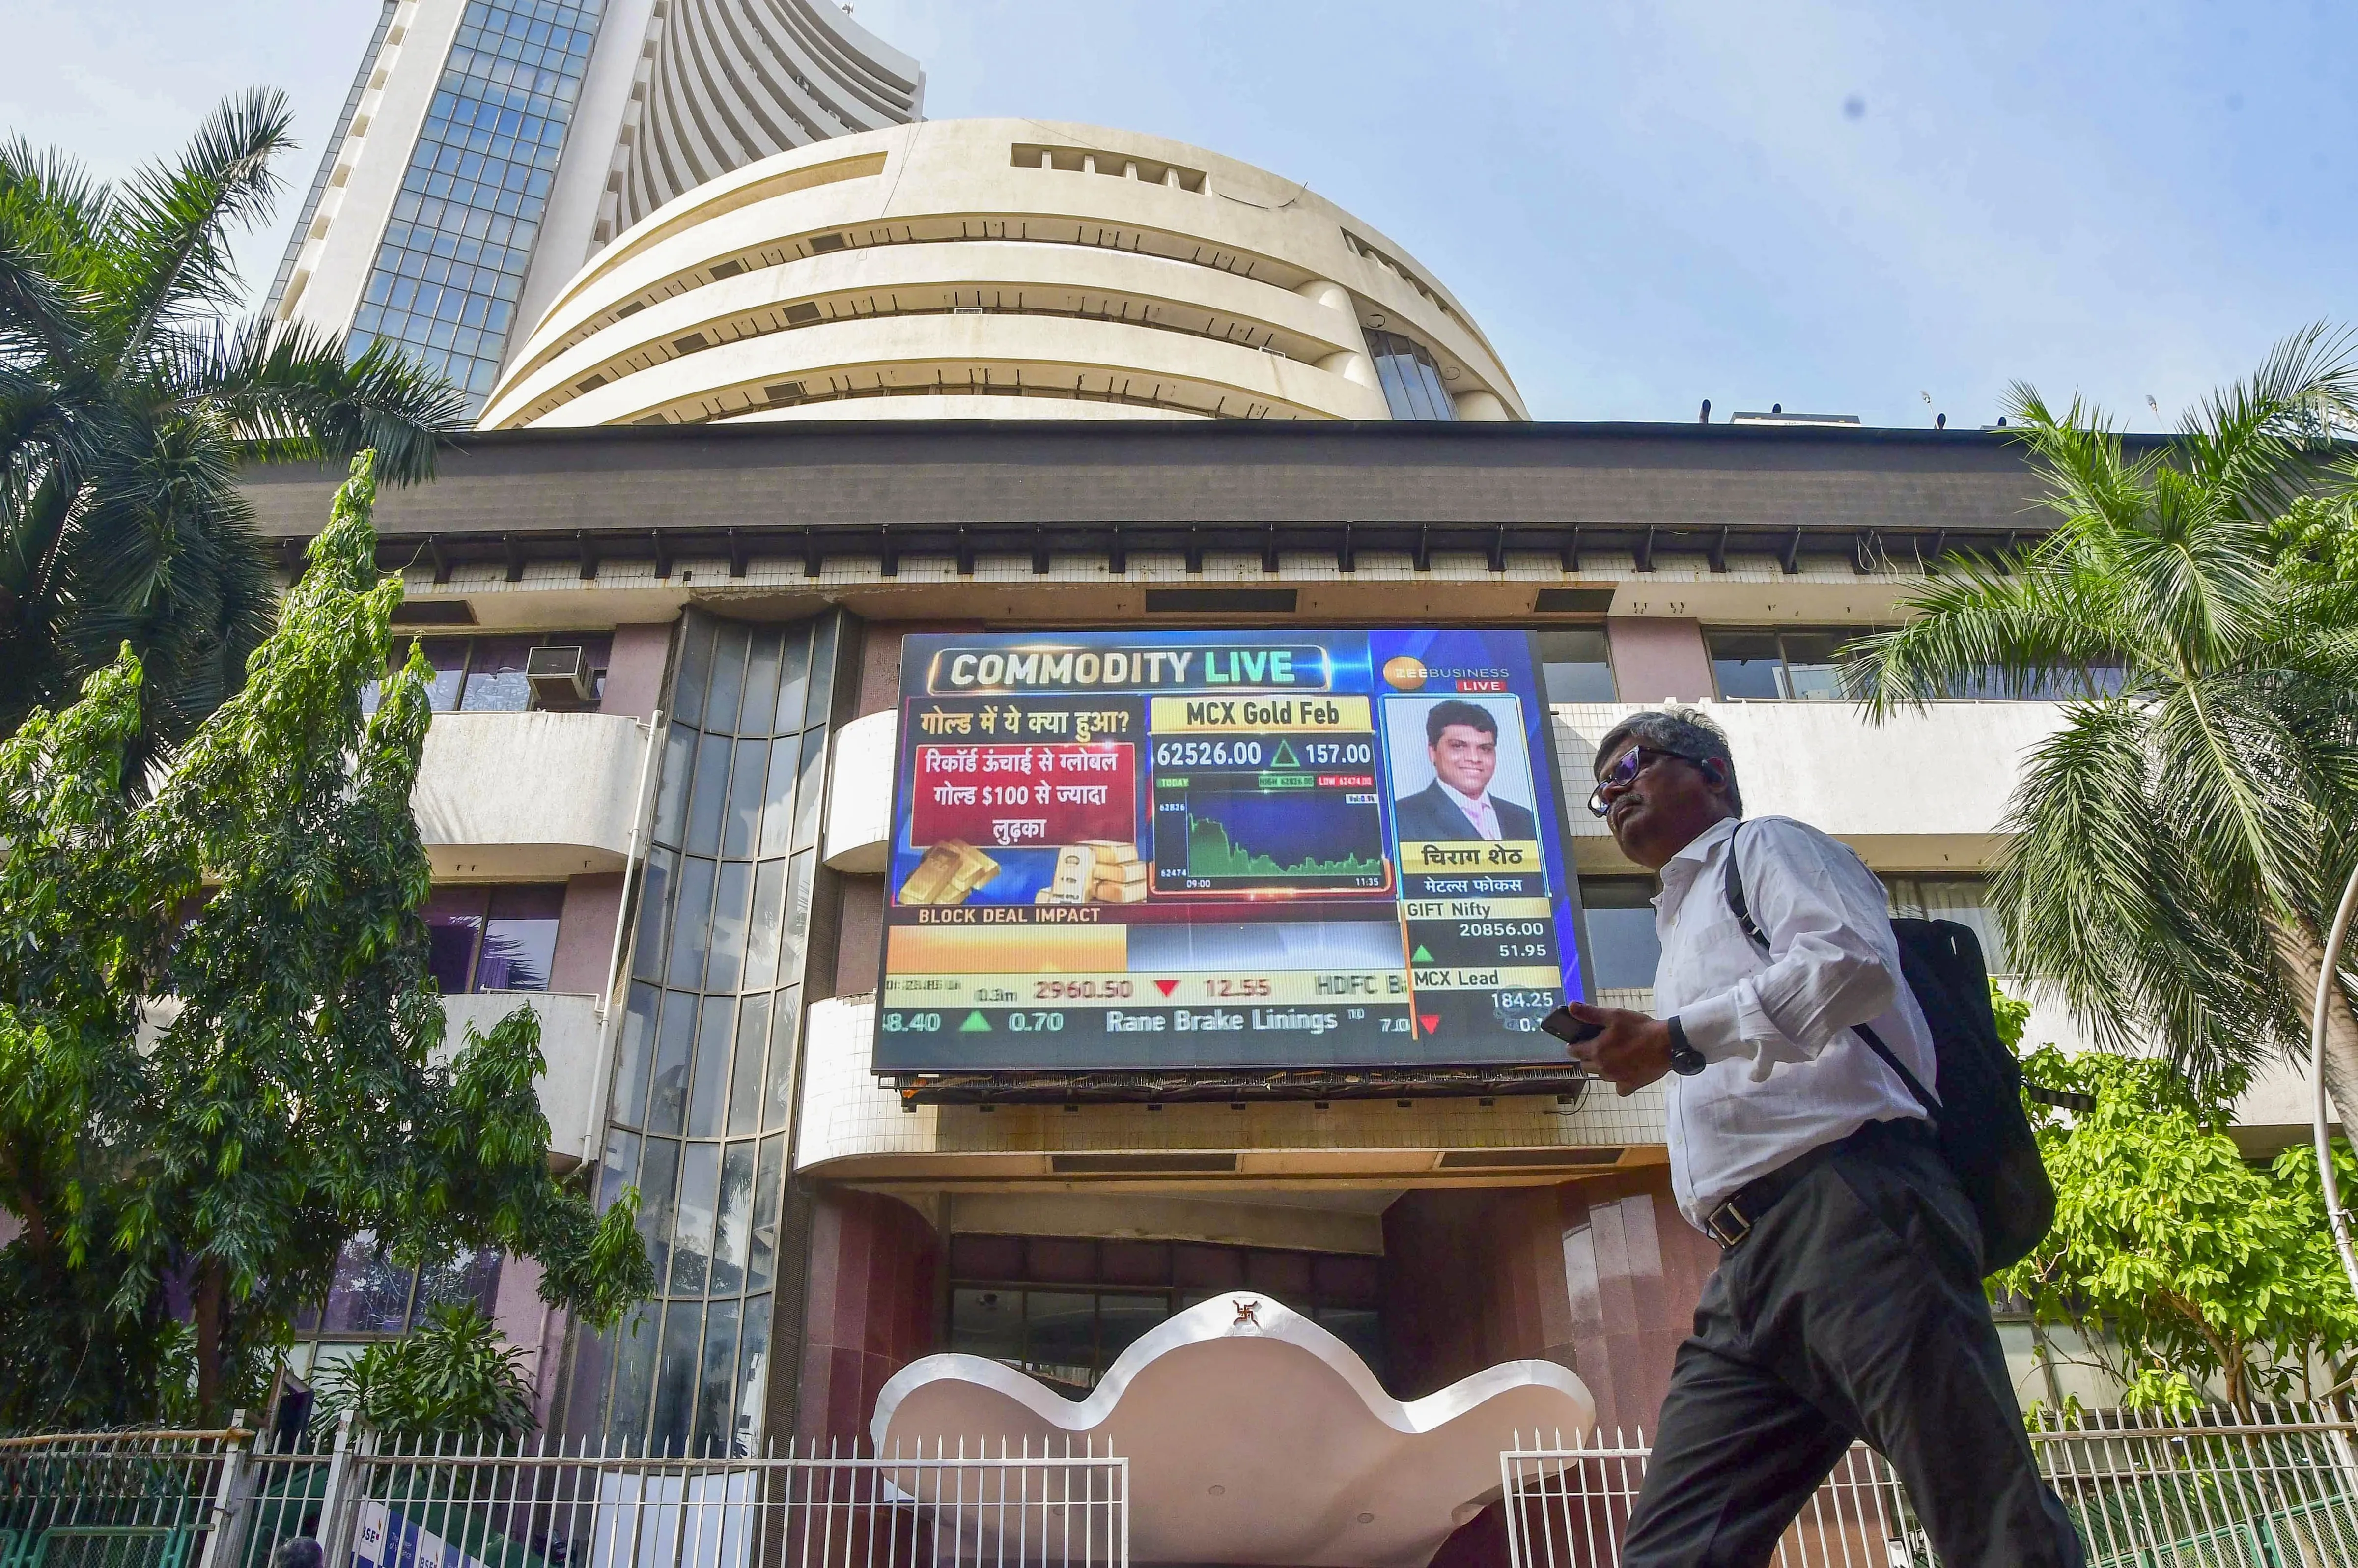
The NIFTY50 remained range-bound and volatile on December 10, ending flat with a slight negative bias, extending its downtrend for the third straight session.
Asian markets @ 8 am
- GIFT NIFTY: 24,682.00 (-0.1%)
- Nikkei 225: 39,112.80 (-0.65%)
- Hang Seng: 20,470.88 (+0.79%)
U.S. market update
- Dow Jones: 44,247 (▼0.3%)
- S&P 500: 6,034 (▼0.3%)
- Nasdaq Composite: 19,687 (▼0.2%)
U.S. stocks extended the losing streak for the second consecutive day ahead of the key consumer inflation report which will be released later today. The sharp fall in the indices was led by shares of Oracle after it slumped over 7% after the company’s second quarter results missed street estimates and issued a weaker-than-expected forecast.
NIFTY50
- December Futures: 24,682 (▼0.0%)
- Open interest: 4,49,272 (▼0.4%)
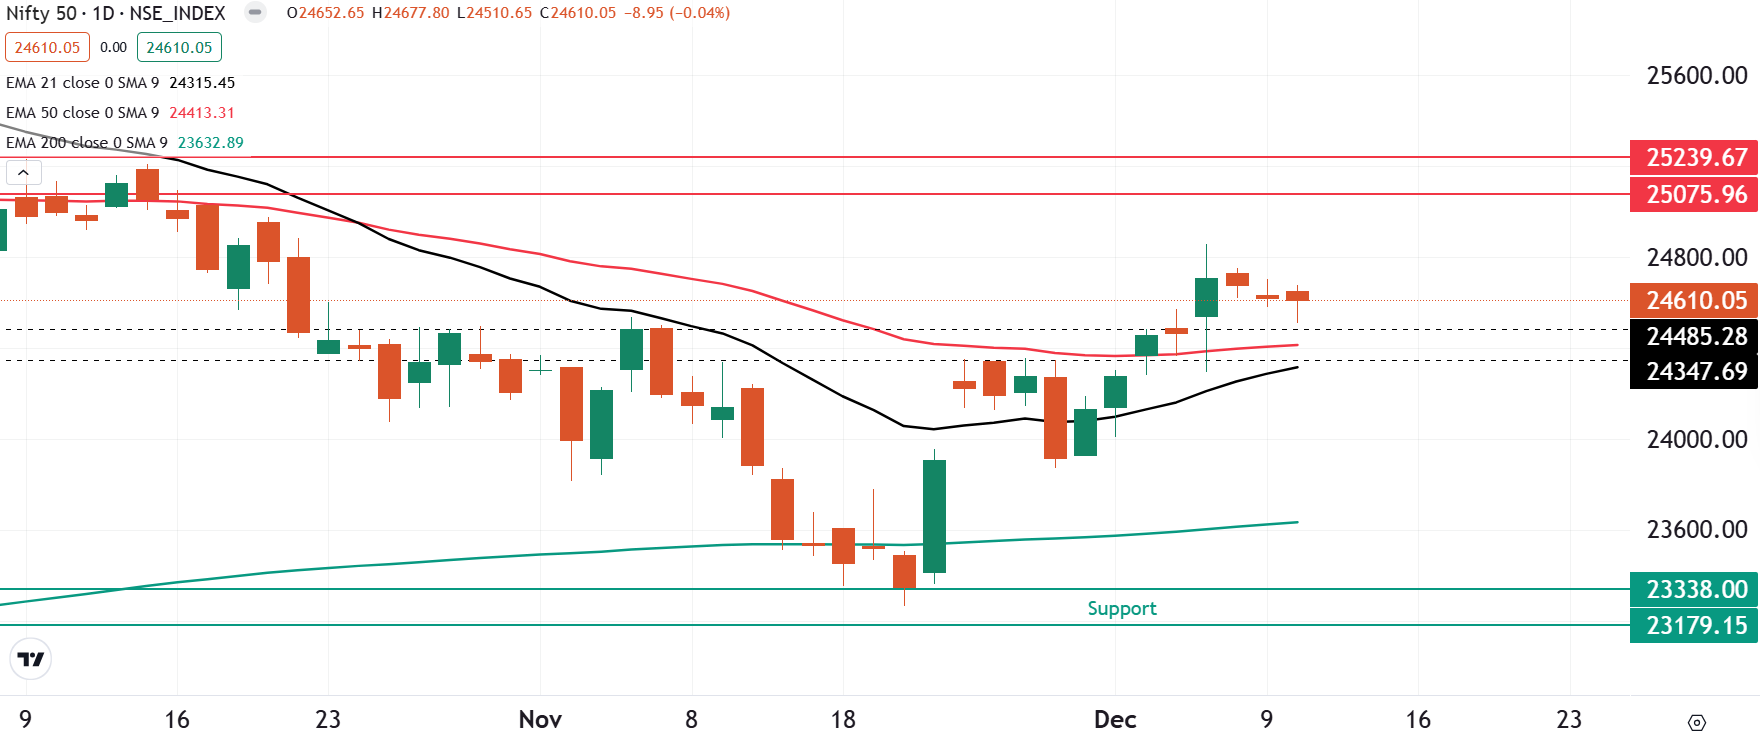
The NIFTY50 remained range-bound and volatile on December 10, ending flat with a slight negative bias, extending its downtrend for the third straight session. The index formed a inside candle on the daily chart and consolidated around the 24,600 zone.
The index took support from the crucial zone of 24,500 and formed a hammer candlestick pattern on the daily chart, which is a bullish reversal pattern. However, the pattern gets confirmed if the close of the subsequent candle is above the high of the reversal pattern. A close above the high will signal continuation of the bullish trend. On the other hand, a negative close will invalidate the pattern.
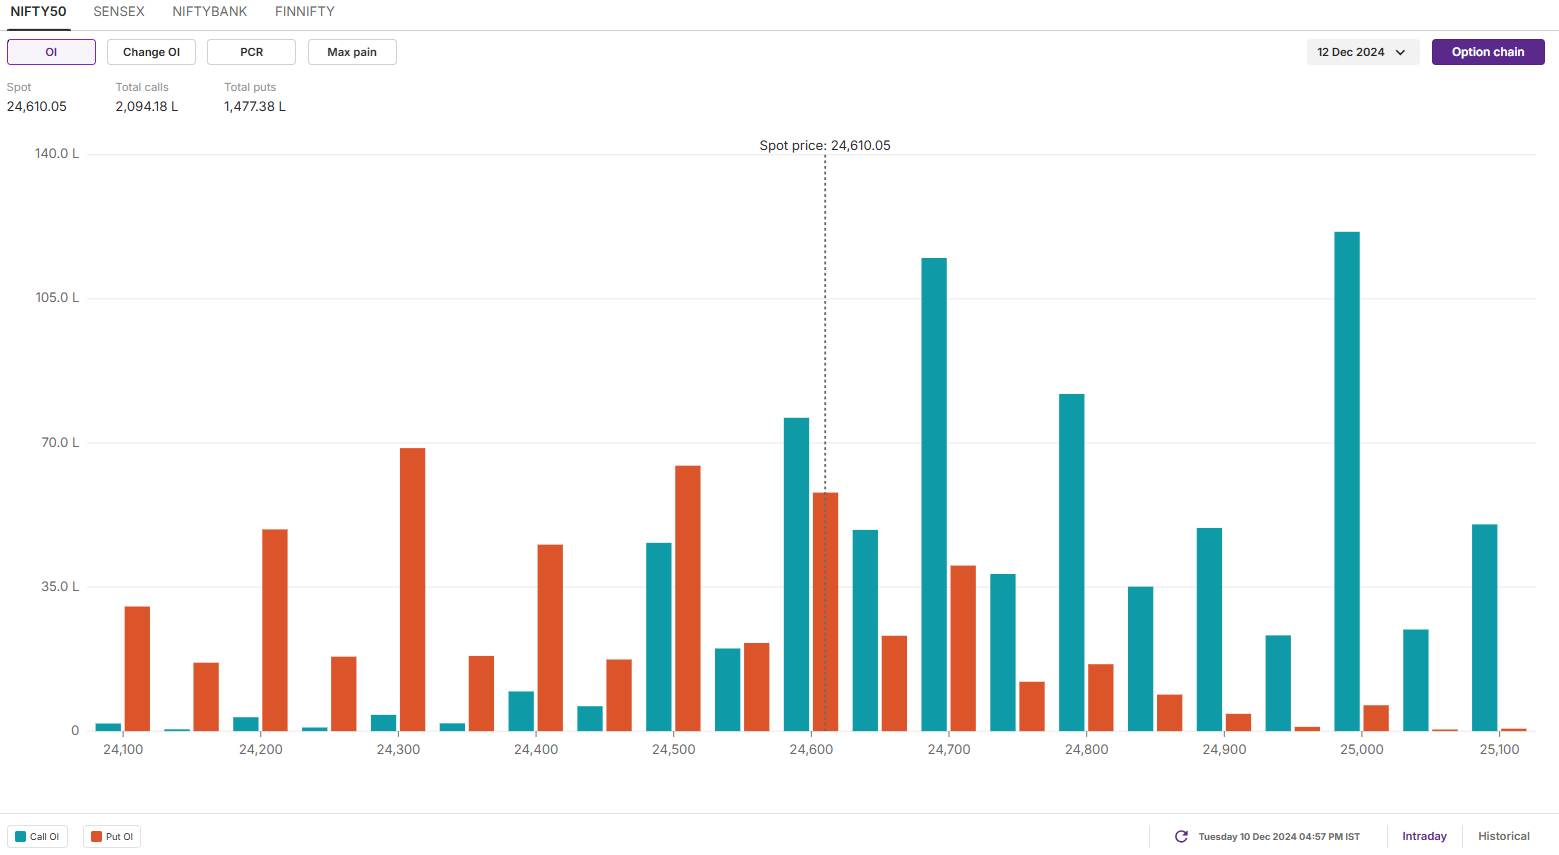
The positioning of the open interest for the 12 September expiry saw significant call build-up at 25,000 and 24,700 strikes, marking these as immediate resistance zones for the index. Conversely, the base for the put options was seen at 24,000 and 24,300 strikes, suggesting support for the index around these levels.
SENSEX
- Max call OI: 84,000
- Max put OI: 78,000
- (Expiry: 13 Dec)
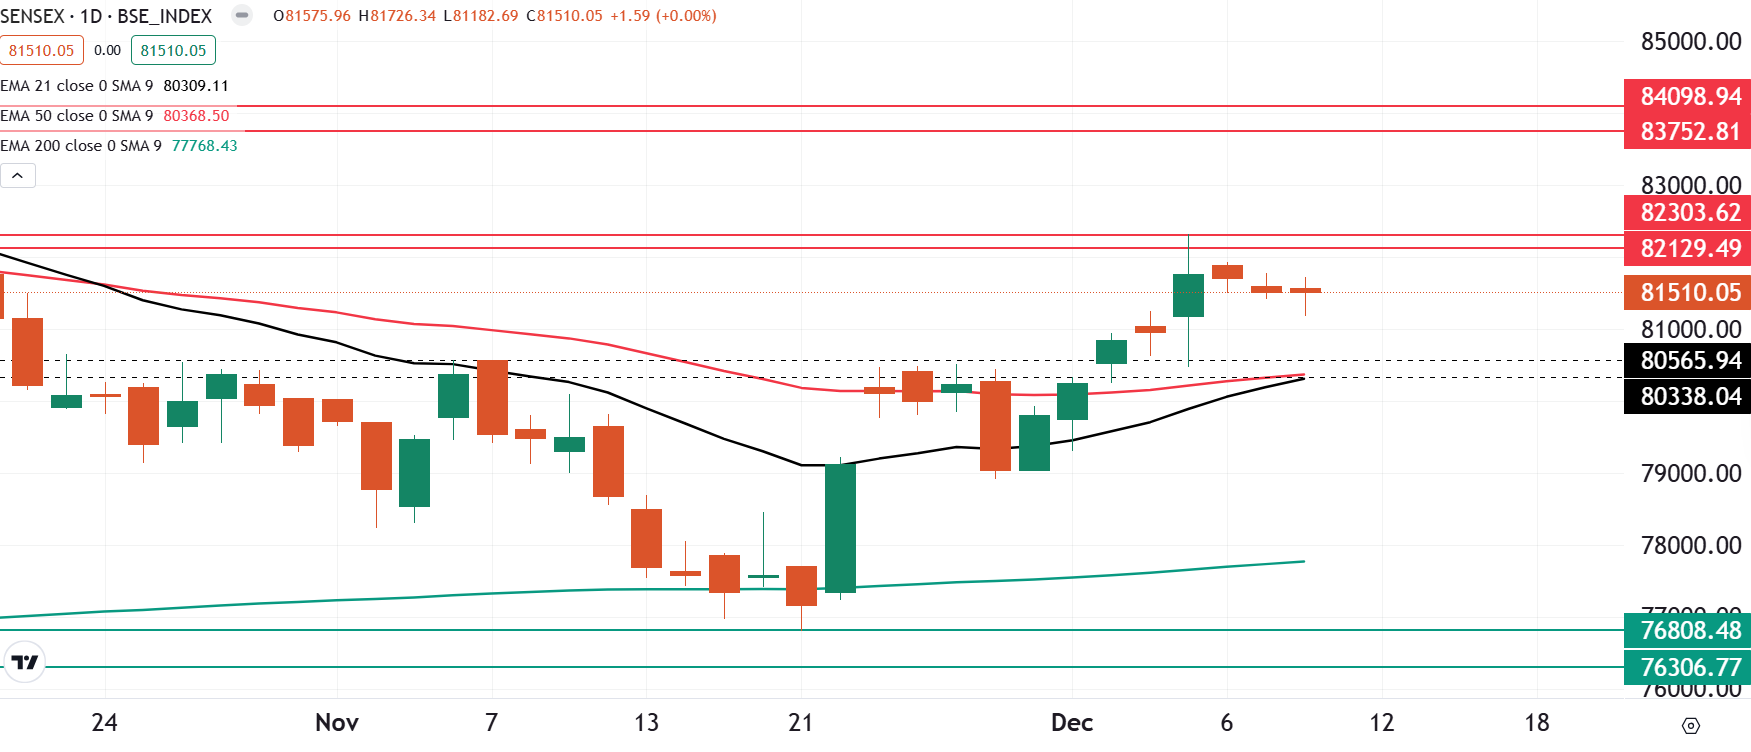
The SENSEX also extended the consolidation for the third day in a row, trading within the range of 5 December’s candle. The index formed a third inside candle on the daily chart, ending the 10 December’s day on a flat note.
The technical structure of the SENSEX, as observed on the daily chart, appears to be sideways to bullish, with buying activity emerging at lower levels. The index has found immediate support near the 80,300 level, corresponding to the low of the 5th December candle. Conversely, resistance is seen around the 82,300 level. Unless the index breaks out of this range on a closing basis, the trend is likely to remain range-bound, with a base forming around the 81,500 level.
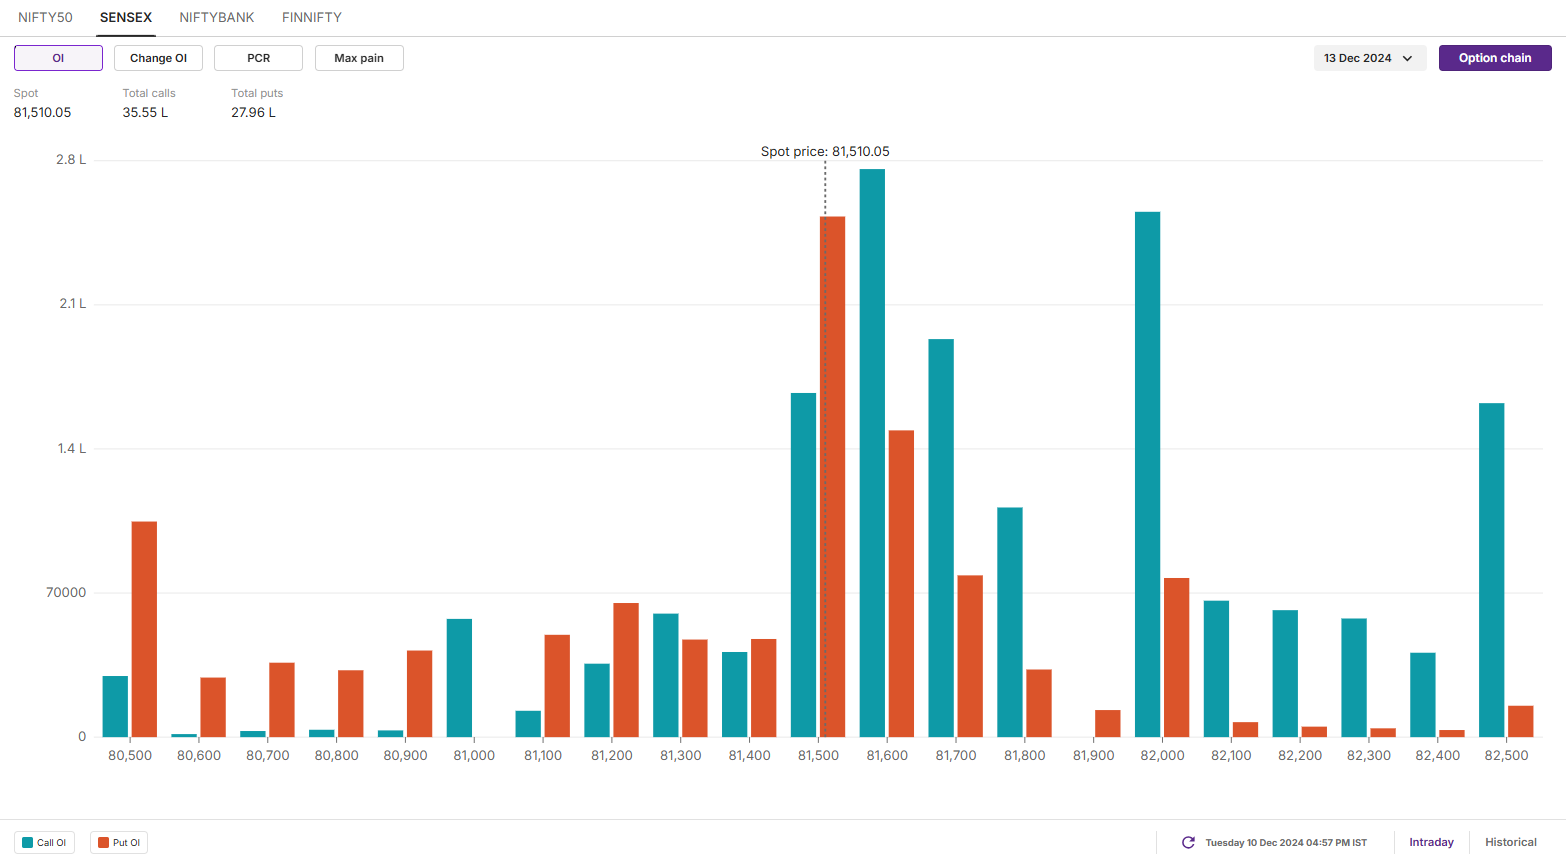
The open interest data for the 13 December expiry saw significant call base at 82,000 and 81,600 strikes, indicating resistance for the index around this level. On the other hand, the significant put base was seen at 81,500 and 81,000 strikes, suggesting support for the index around these levels.
FII-DII activity
Stock scanner
- Long build-up: FSN E-Commerce (Nykaa), Cyient, Glenmark Pharmaceuticals, Muthoot Finance and PB Fintech (Policy Bazaar)
- Short build-up: Life Insurance Corporation of India, HFCL, Sona BLW Precision and SJVN
- Under F&O ban: Granules India, Manappuram Finance, PVR Inox, Metropolis and RBL Bank
- Added under F&O ban: Metropolis
In Futures and Options or F&O, long build-up means an increase in Open Interest (OI) along with an increase in price, and short build-up means an increase in Open Interest(OI) along with a decrease in price. Source: Upstox and NSE.
Disclaimer: Derivatives trading must be done only by traders who fully understand the risks associated with them and strictly apply risk mechanisms like stop-losses. The information is only for consumption by the client and such material should not be redistributed. We do not recommend any particular stock, securities and strategies for trading. The securities quoted are exemplary and are not recommendatory. The stock names mentioned in this article are purely for showing how to do analysis. Take your own decision before investing.
About The Author
Next Story

