Market News
Trade setup for August 12: NIFTY50 forms hammer on weekly chart – Can it break the 20 DMA resistance?
.png)
4 min read | Updated on August 12, 2024, 08:29 IST


SUMMARY
The NIFTY50 index has formed a hammer candle on the weekly chart. A hammer is a bullish reversal pattern, formed after a downtrend, indicating emergence of buyers at lower levels. Traders should keep an eye on the high of the hammer pattern; if this level is breached, the NIFTY50 could potentially close the bearish gap that was created last week.
Stock list
The BANK NIFTY Index started Friday's session on a positive note and closed with small gains, closing above the previous two days' highs.
Asian markets update at 7 am
The GIFT NIFTY is trading flat, suggesting a subdued start for the NIFTY50 today. Meanwhile, Asian markets are showing mixed performance, with Japan’s Nikkei 225 up by 0.5% and Hong Kong’s Hang Seng index trading flat.
U.S. market update
- Dow Jones: 39,497 (▲0.1%)
- S&P 500: 5,344 (▲0.4%)
- Nasdaq Composite: 16,745 (▲0.5%)
The U.S. market closed higher on Friday, ending the week with minimal change after recovering almost all of its losses from Monday's decline. The sharp decline was triggered by recession fears and the unwinding of global yen-funded carry trades.
The sharp sell-off in the previous week, driven by a weaker-than-expected July jobs report, heightened recession fears and prompted investors to unwind currency carry trade positions in the Japanese Yen.
NIFTY50
- August Futures: 24,401 (▲1.1%)
- Open Interest: 4,68,363 (▼5.1%)
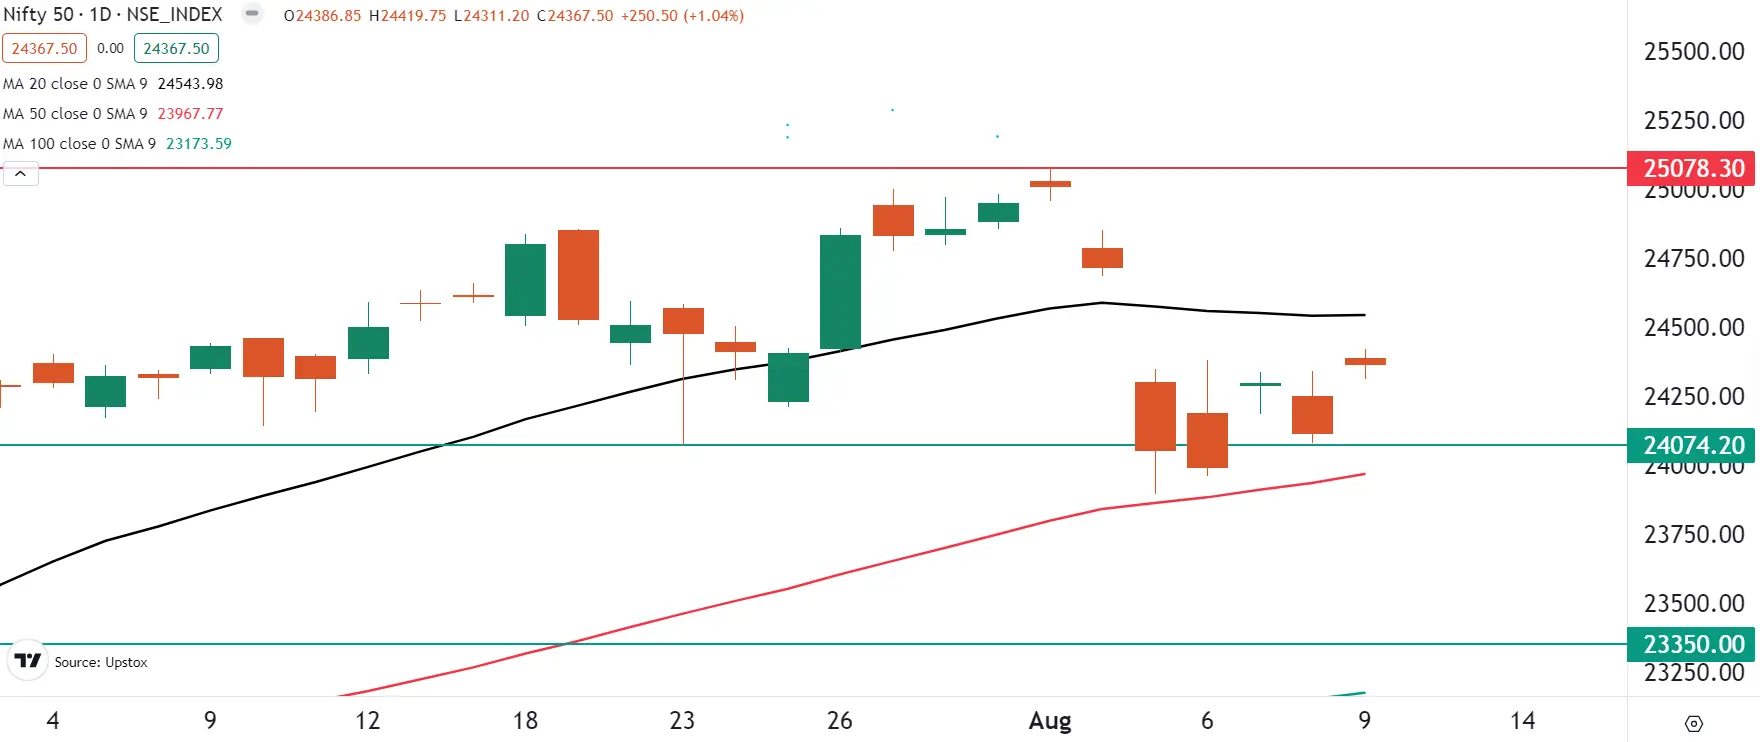
The NIFTY50 index started the Friday, August 9 session on a strong note and ended the session in green, above the crucial 24,350 mark. The index formed a small bodied candle on the daily chart, hinting at a pause before the its next move.
On the daily chart, the index is broadly consolidating between its 20-day and 50-day moving averages Until the index captures these levels on closing basis, the trend may remain range-bound. Additionally, traders can also keep an eye on the high and low of Friday’s candle. A break of the high or low of August 9, will provide directional clues to the traders.
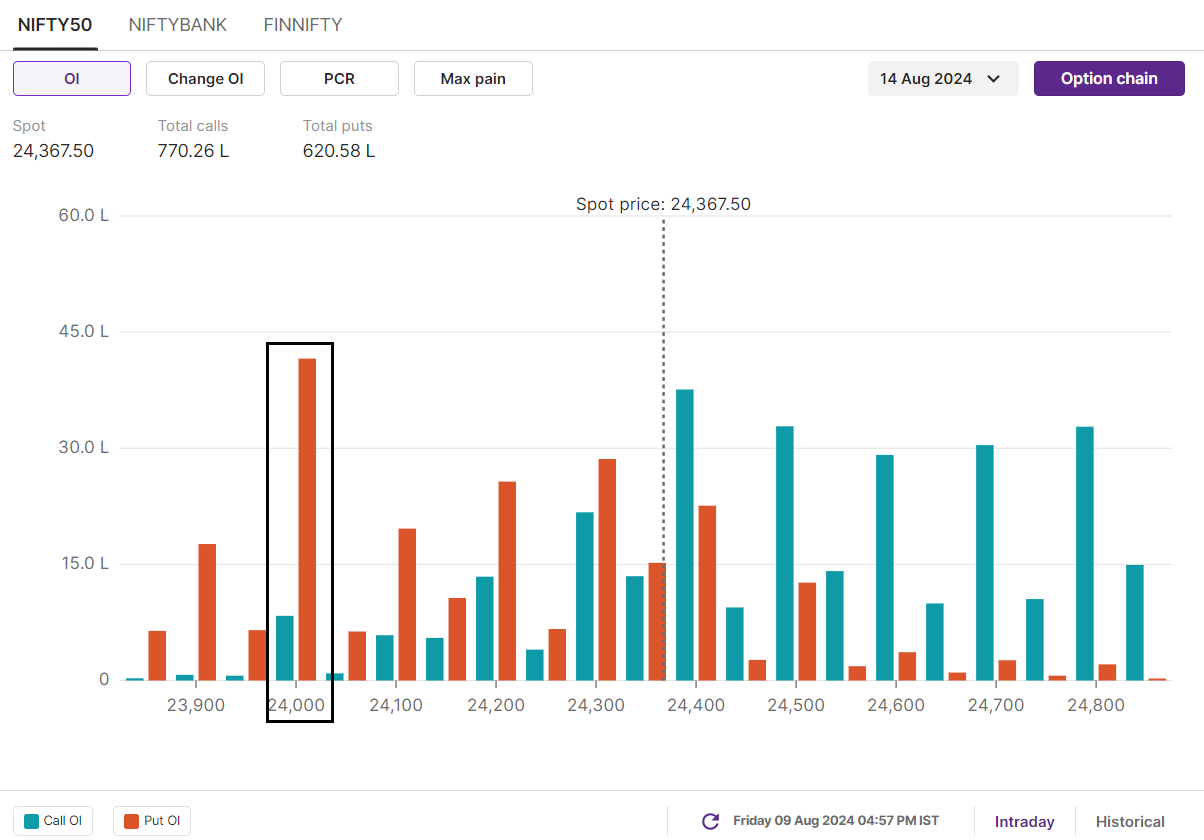
Meanwhile, the positioning of the open interest for 14 August expiry has highest call base at 25,000 and 24,400 strikes, pointing at these crucial resistance zone for the NIFTY50 index. Conversely, the put base is established at 24,000 and 23,500 strikes, making these as crucial support zones for the index.
BANK NIFTY
- August Futures: 50,574 (▲0.7%)
- Open Interest: 1,93,241 (▼4.9%)
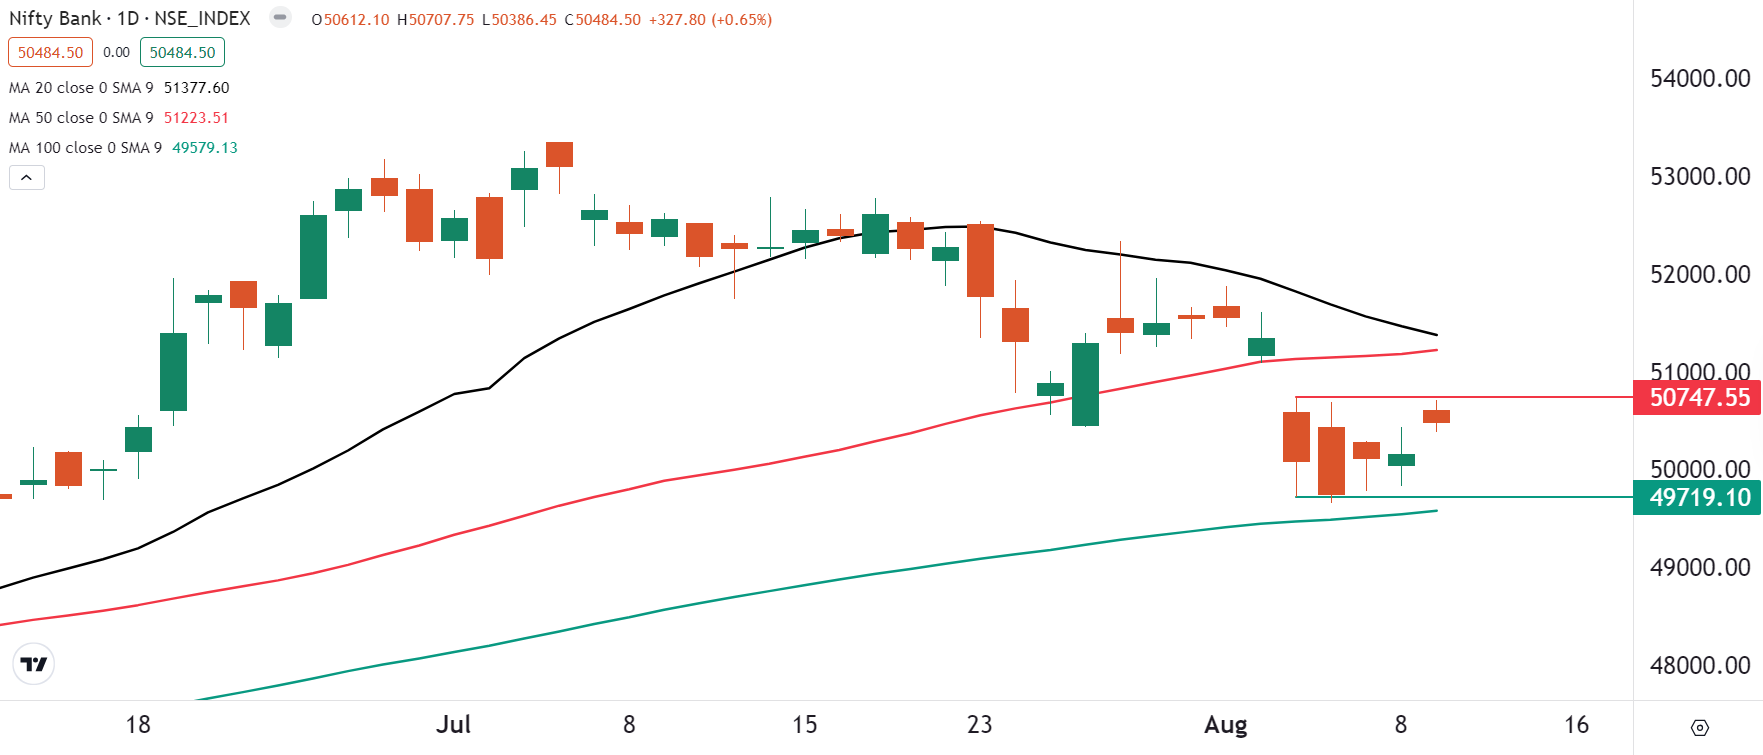
The BANK NIFTY Index started Friday's session on a positive note and closed with small gains, closing above the previous two days' highs. The index formed a small doji candlestick on the daily chart, indicating a pause and indecision among traders.
The index is consolidating with the narrow range of August 5 candle, indicating contraction of range around crucial support zone of 100 day moving average. In the coming week, traders can monitor the high and low of the Friday’s candle as break on the either side will provide traders will provide further directional clues.
It's also important to note that the BANK NIFTY is broadly trading between its 50-day and 100-day moving averages. Traders can consider directional strategies once the index breaks out of this range.
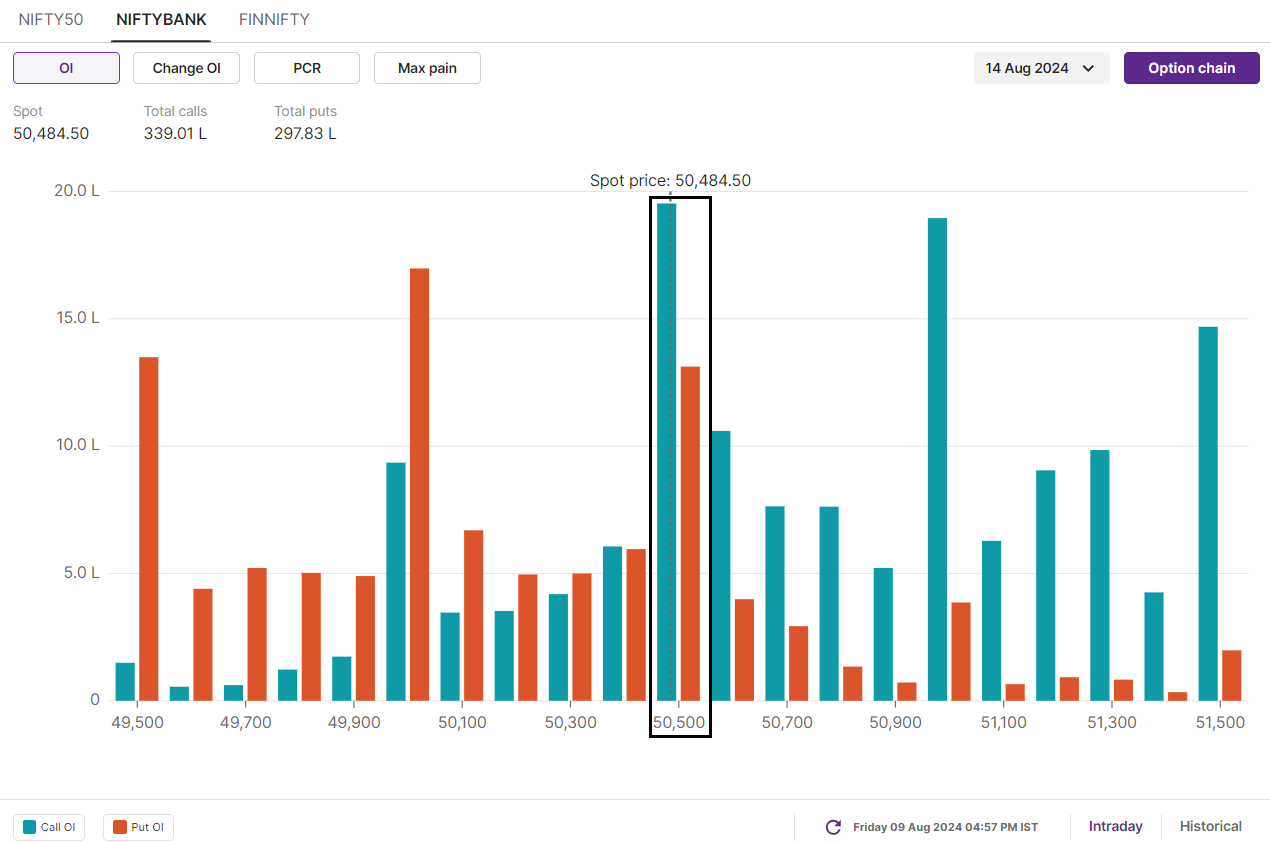
BANK NIFTY’s open interest build-up for the 14 August expiry has highest call open interest at 51,100 and 50,500 strikes, making these as crucial resistance zones for the index. On the contrary, the put options base was established at 50,000 and 49,500 strikes, hinting at the support for index at these levels.
FII-DII activity
Stock scanner
Under F&O ban: Aditya Birla Capital, Aditya Birla Fashion and Retail, Bandhan Bank, Biocon, Birlasoft, Gujarat Narmada Valley Fertilizers & Chemicals (GNFC), Granules India, Hindustan Copper, India Cements, IndiaMART InterMESH, LIC Housing Finance,Manappuram Finance, Punjab National Bank, RBL Bank and Steel Authority of India
In Futures and Options or F&O, long build-up means an increase in Open Interest (OI) along with an increase in price, and short build-up means an increase in Open Interest(OI) along with a decrease in price.
Source: Upstox and NSE.
Disclaimer: Derivatives trading must be done only by traders who fully understand the risks associated with them and strictly apply risk mechanisms like stop-losses. The information is only for consumption by the client and such material should not be redistributed. We do not recommend any particular stock, securities and strategies for trading. The securities quoted are exemplary and are not recommendatory. The stock names mentioned in this article are purely for showing how to do analysis. Take your own decision before investing.
About The Author
Next Story


