Market News
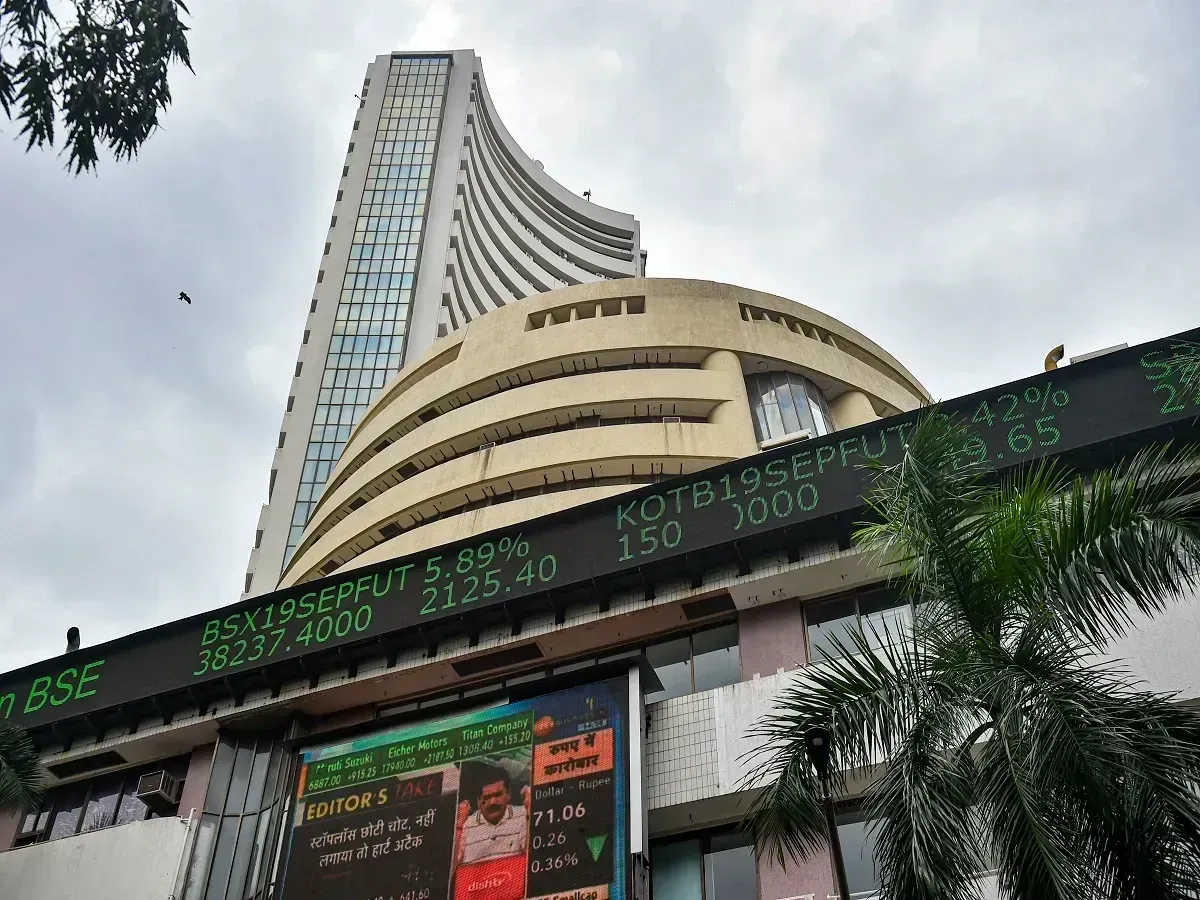
Trade setup for August 2: NIFTY50 at 25,000 with indecision candle – Reversal or pause in sight?
.png)
4 min read | Updated on August 02, 2024, 08:23 IST


SUMMARY
The NIFTY50 has formed a bearish spinning top candle on the daily chart, reflecting indecision among investors. Additionally, the early signs on the weekly chart of NIFTY50 is of the formation of doji, another indecision candle. Traders closely monitor both daily and weekly close.
Stock list
The NIFTY50 has immediate support around 24,800 and 24,600.
Asian markets update at 7 am
After a negative handover from Wall Street, the GIFT NIFTY is down nearly 1%, indicating a gap down start for the NIFTY 50 today. Other Asian markets are also trading in the red. Japan's Nikkei 225 is down 0.5%, while Hong Kong's Gang Seng Index slipped 1.6%.
U.S. market update
- Dow Jones: 40,347 (▼1.2%)
- S&P 500: 5,446 (▼1.3%)
- Nasdaq Composite: 17,194 (▼2.3%)
U.S. equities came under heavy selling pressure on Thursday as weak economic data and a sell-off in technology stocks led to losses across all indices. This comes a day after the Federal Reserve signalled a likely interest rate cut in September.
A slew of fresh data releases spooked investors over possible recession fears. Initial jobless claims rose to an 11-month high of 2,49,000 in the week ended 27 July. The figure was higher than the estimate of 2,35,000. In a separate release, the ISM manufacturing index, a measure of factory activity in the US, came in at 46.8%, indicating a contraction in activity in the sector.
NIFTY50
- August Futures: 25,032 (▲0.0%)
- Open Interest: 6,26,720 (▲1.7%)
The NIFTY50 started Thursday's session above the 25,000 mark, hitting a fresh all-time high, following a positive handover from global markets. However, the index failed to hold on to its early gains and remained range-bound throughout the day. The index managed to close above the psychologically important 25,000 level and formed an indecision candle on the daily chart.
On the daily chart, the NIFTY50 has formed a bearish spinning top pattern at its all-time high. A bearish spinning top is an indecision candle that forms after an uptrend, indicating a pause and caution. However, the pattern is only confirmed if the close of the following candle is lower than the spinning top, indicating weakness. Conversely, a close above the spinning top signals a resumption of the current trend.
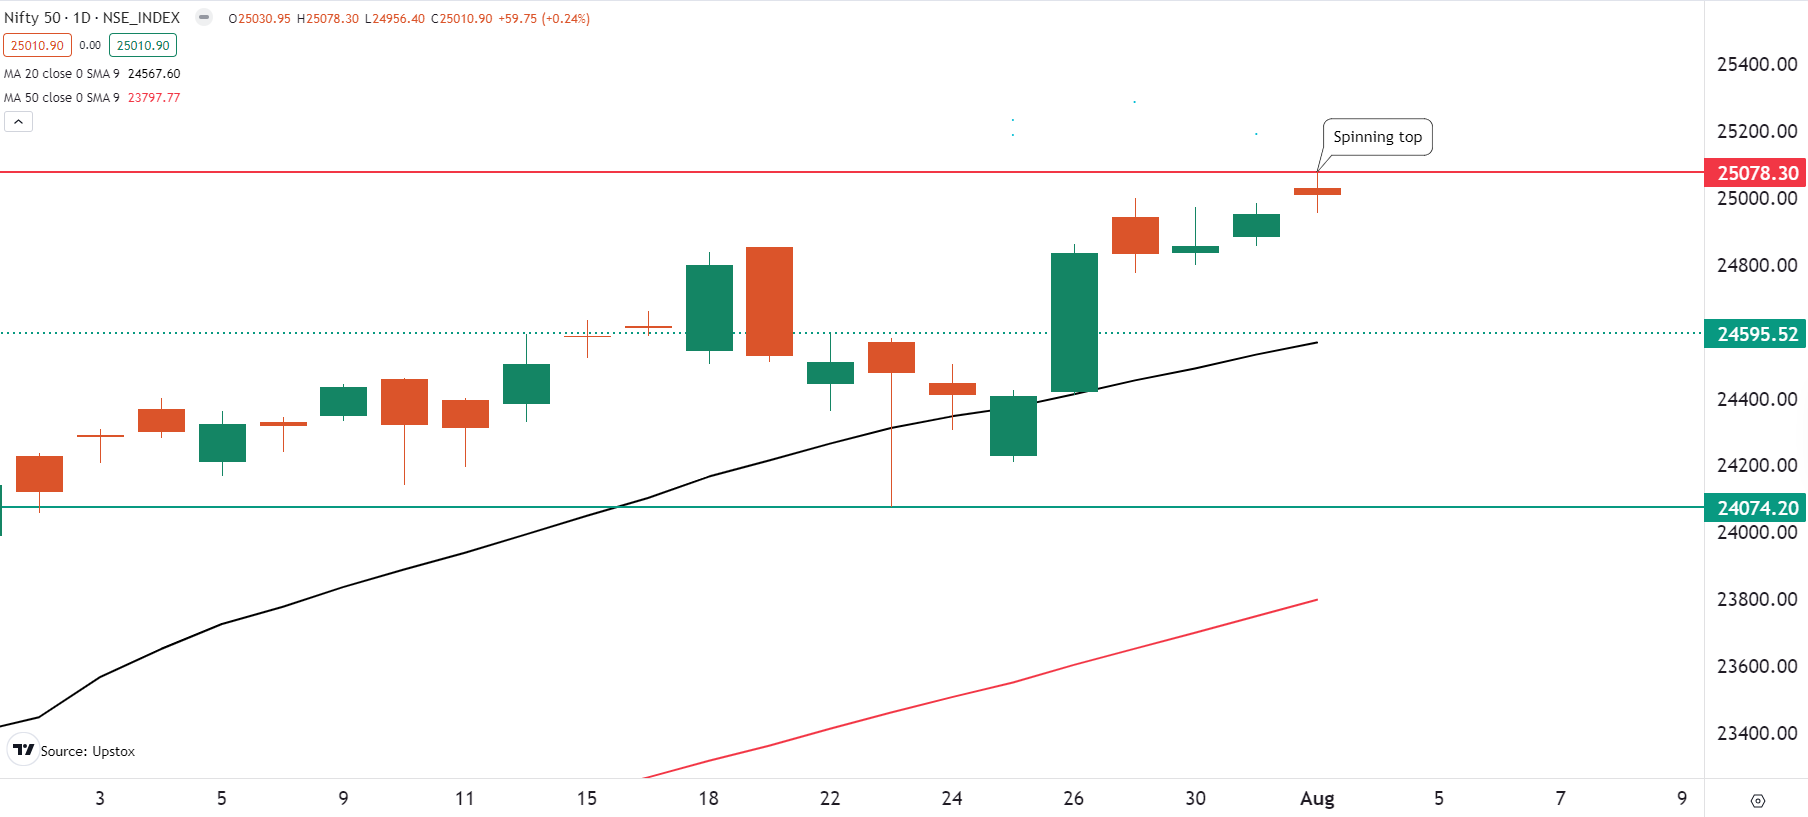
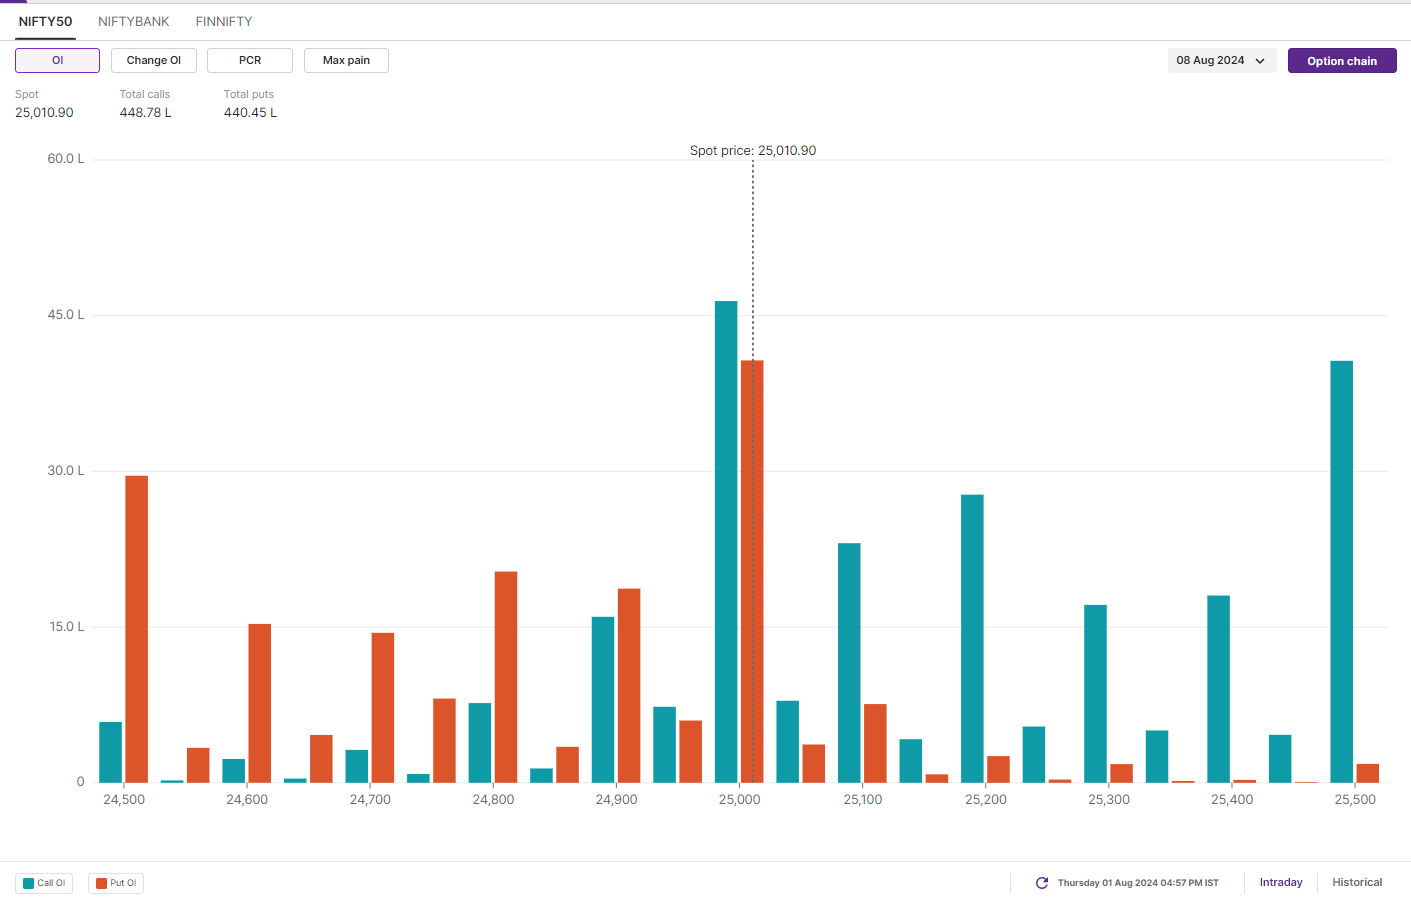
The NIFTY50 has immediate support around 24,800 and 24,600. Unless the index closes below these levels and the 20-day moving average, the broader trend could remain positive. Meanwhile, the initial open interest build-up for the August 8 expiry is currently scattered with the maximum call and put open interest at the 25,000 strike, suggesting range-bound activity around these levels.
BANK NIFTY
- August Futures: 51,753 (▼0.0%)
- Open Interest: 1,66,619 (▲3.4%)
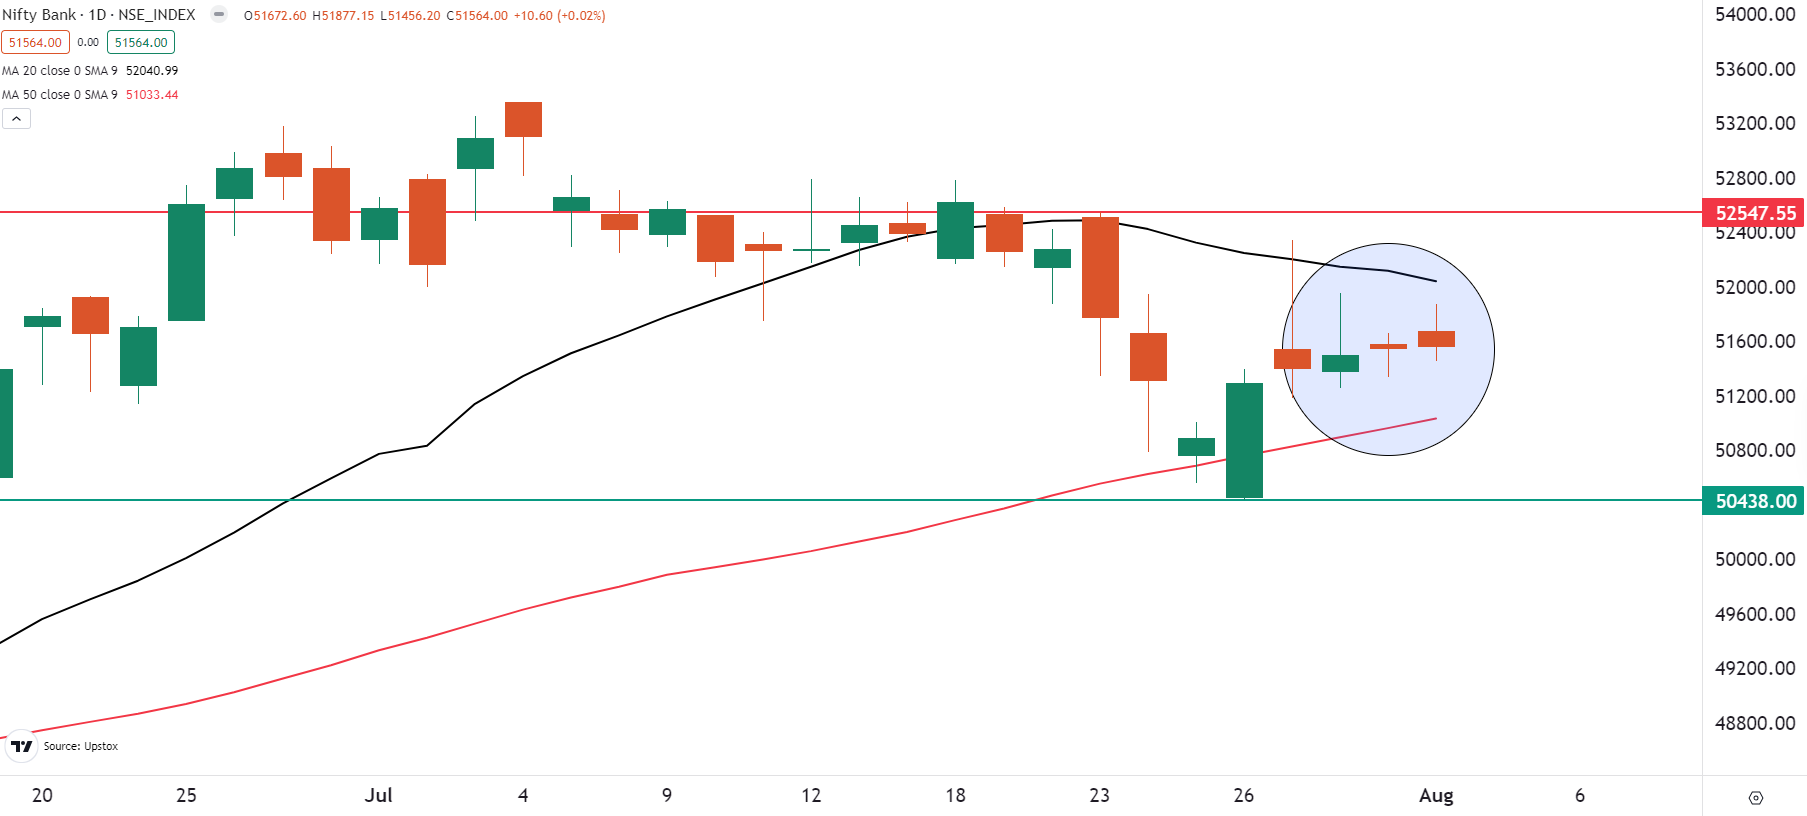
The BANK NIFTY extended the consolidation for the third consecutive day and ended the day in green. The index is currently consolidating between its 20 day and 50 day moving averages, signalling contraction of the range.
As you can see on the chart below, the index has been immediate resistance at its 20-DMA and a major resistance around 52,500 zone. On the other hand, the immediate support is available at 50-DMA and 50,500 zone. Traders should closely monitor this range as the break on the either side will provide strong directional clues.
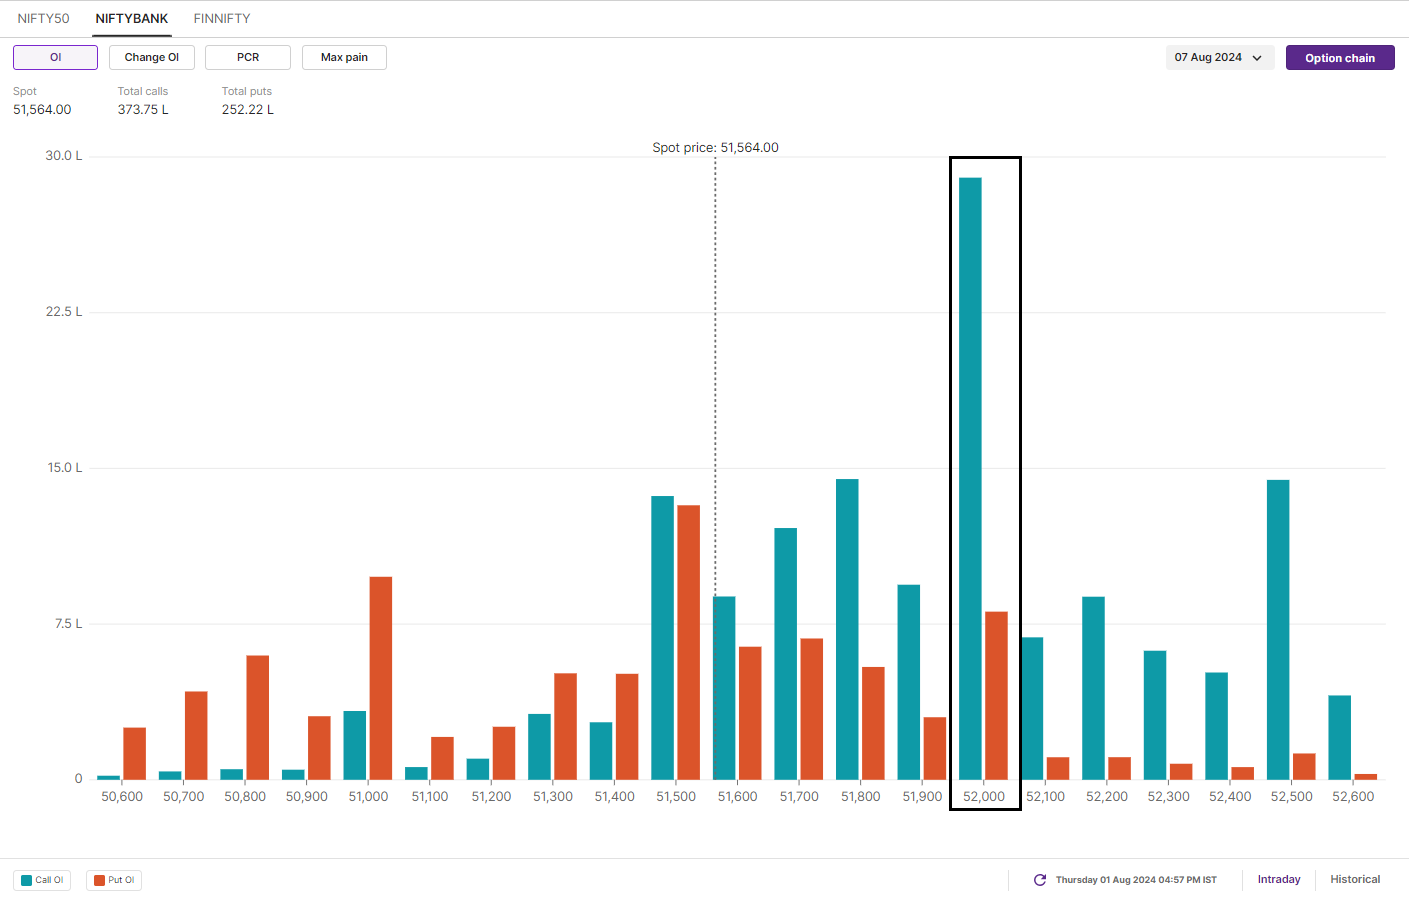
The options build-up for the 7 August expiry has maximum call open interest at 52,000 and 53,000 strikes. This highlights that the index may face resistance around these levels. On the flip side, the put open interest base was seen at 51,500 and 50,000 strikes, pointing support for index around these levels.
FII-DII activity
Stock scanner
Under F&O ban: Birlasoft, Gujarat Narmada Valley Fertilizers & Chemicals (GNFC), Granules India, India Cements, IndiaMART InterMESH and RBL Bank
In Futures and Options or F&O, long build-up means an increase in Open Interest (OI) along with an increase in price, and short build-up means an increase in Open Interest(OI) along with a decrease in price.
Source: Upstox and NSE.
Disclaimer: Derivatives trading must be done only by traders who fully understand the risks associated with them and strictly apply risk mechanisms like stop-losses. The information is only for consumption by the client and such material should not be redistributed. We do not recommend any particular stock, securities and strategies for trading. The securities quoted are exemplary and are not recommendatory. The stock names mentioned in this article are purely for showing how to do analysis. Take your own decision before investing.
About The Author
Next Story


