Market News
Trade setup for 10 July: Will BANK NIFTY hold the crucial 52,000 mark on expiry day?
.png)
5 min read | Updated on July 10, 2024, 07:43 IST
SUMMARY
The BANK NIFTY index has been trading between 52,800 and 52,200 for the past three trading sessions. Once the range is broken, traders can plan and execute their directional strategies accordingly.
The NIFTY50 index formed a bullish candle on the daily chart, closing above the high of the doji candlestick pattern formed on 8 July.
Asian markets update at 7 am
The GIFT NIFTY remains steady, unchanged from previous day’s close, pointing to a flat start for the NIFTY50. Meanwhile, Asian markets are trading in positive territory. Japan's Nikkei 225 is up 0.1% and Hong Kong's Hang Seng Index has gained 0.5%.
U.S. market update
- Dow Jones: 39,291 (▼0.1%)
- S&P 500: 5,576 (▲0.0%)
- Nasdaq Composite: 18,429 (▲0.1%)
U.S. markets closed mixed on Tuesday, with financial companies pushing the S&P 500 to a new record. Shares of Goldman Sachs Group hit an all-time high, contributing to the sector's unusual lead over technology stocks. This comes ahead of quarterly earnings reports from major banks including JPMorgan, Citigroup and Bank of America on Friday.
In addition, Federal Reserve Chairman Jerome Powell's testimony to Congress influenced market movements. The Fed Chair said that recent jobs data suggests that the labour market has cooled considerably. Powell highlighted that the central bank is weighing the risk of high interest rates potentially causing excessive unemployment against the risk of reigniting inflation with premature rate cuts.
NIFTY50
- July Futures: 24,485 (▲0.4%)
- Open Interest: 5,78,926 (▲1.6%)
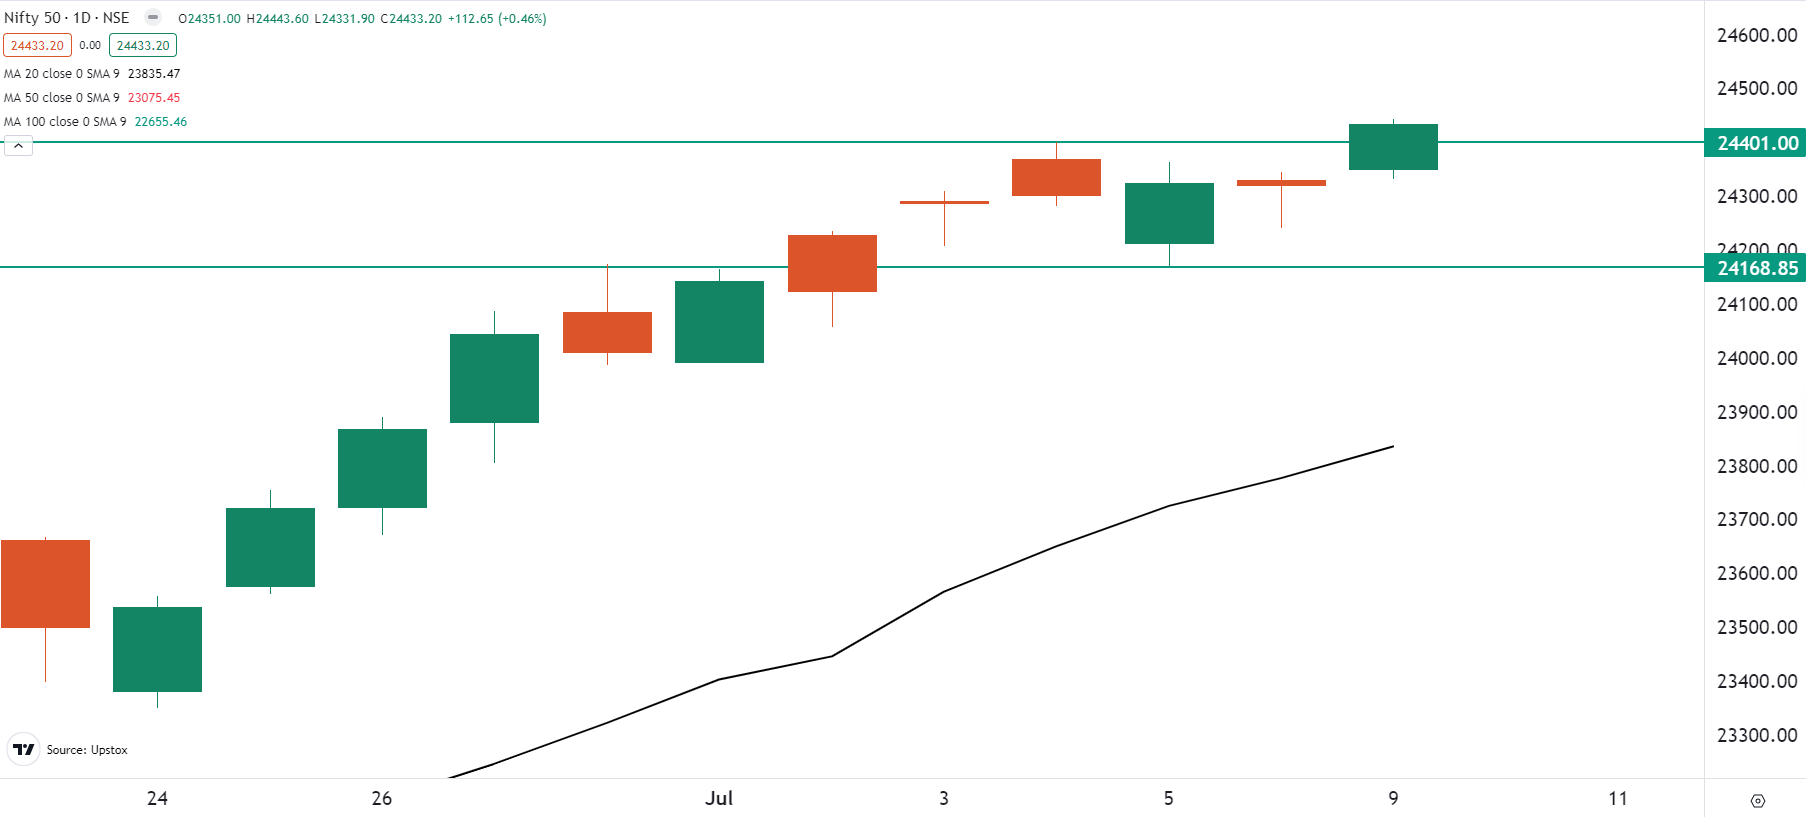
After a flat to positive start, the NIFTY50 index gradually moved higher and closed above the recent all-time high (24,401). The index witnessed strong buying momentum in the FMCG stocks for the second consecutive day, along with the strong performance in the automobile pack, propelling the index to record high levels.
The NIFTY50 index formed a bullish candle on the daily chart, closing above the high of the doji candlestick pattern formed on 8 July. This indicates continuation of the ongoing uptrend, accompanied by the formation of a higher-high and higher-low pattern on the daily chart. In the upcoming sessions, the immediate support for the index is now in 24,200 zone, while there is no resistance on the charts.
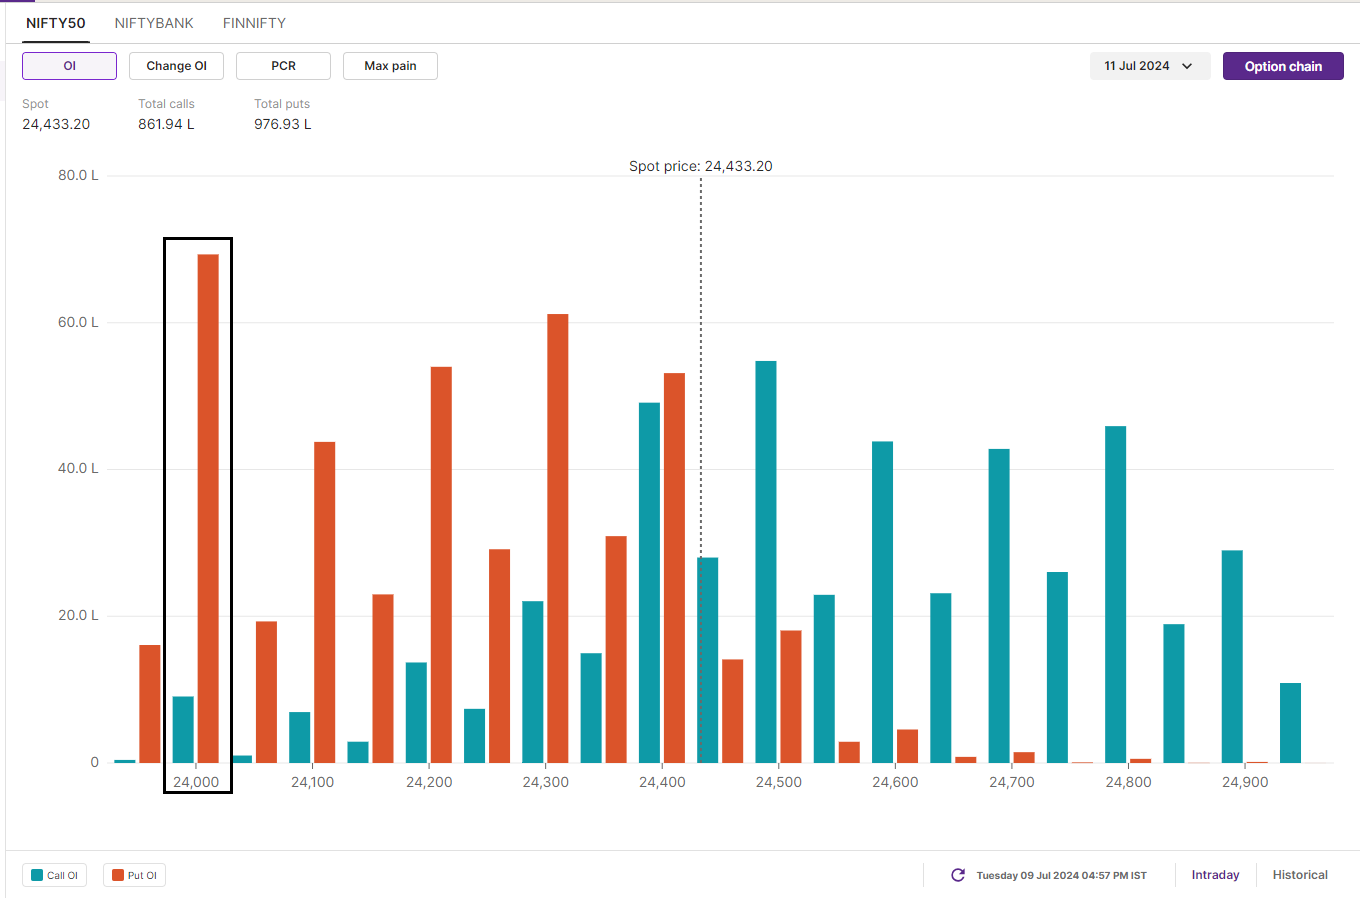
Open interest data for the 11 July expiry showed significant put writing up to 24,300 strikes, indicating the presence of buyers at lower levels. However, the highest put open interest remains at the 24,000 strike. On the other hand, the index has the highest call open interest at the 24,500 strike, which will act as an immediate resistance.
BANK NIFTY
- July Futures: 52,615 (▲0.0%)
- Open Interest: 1,71,867 (▼0.3%)
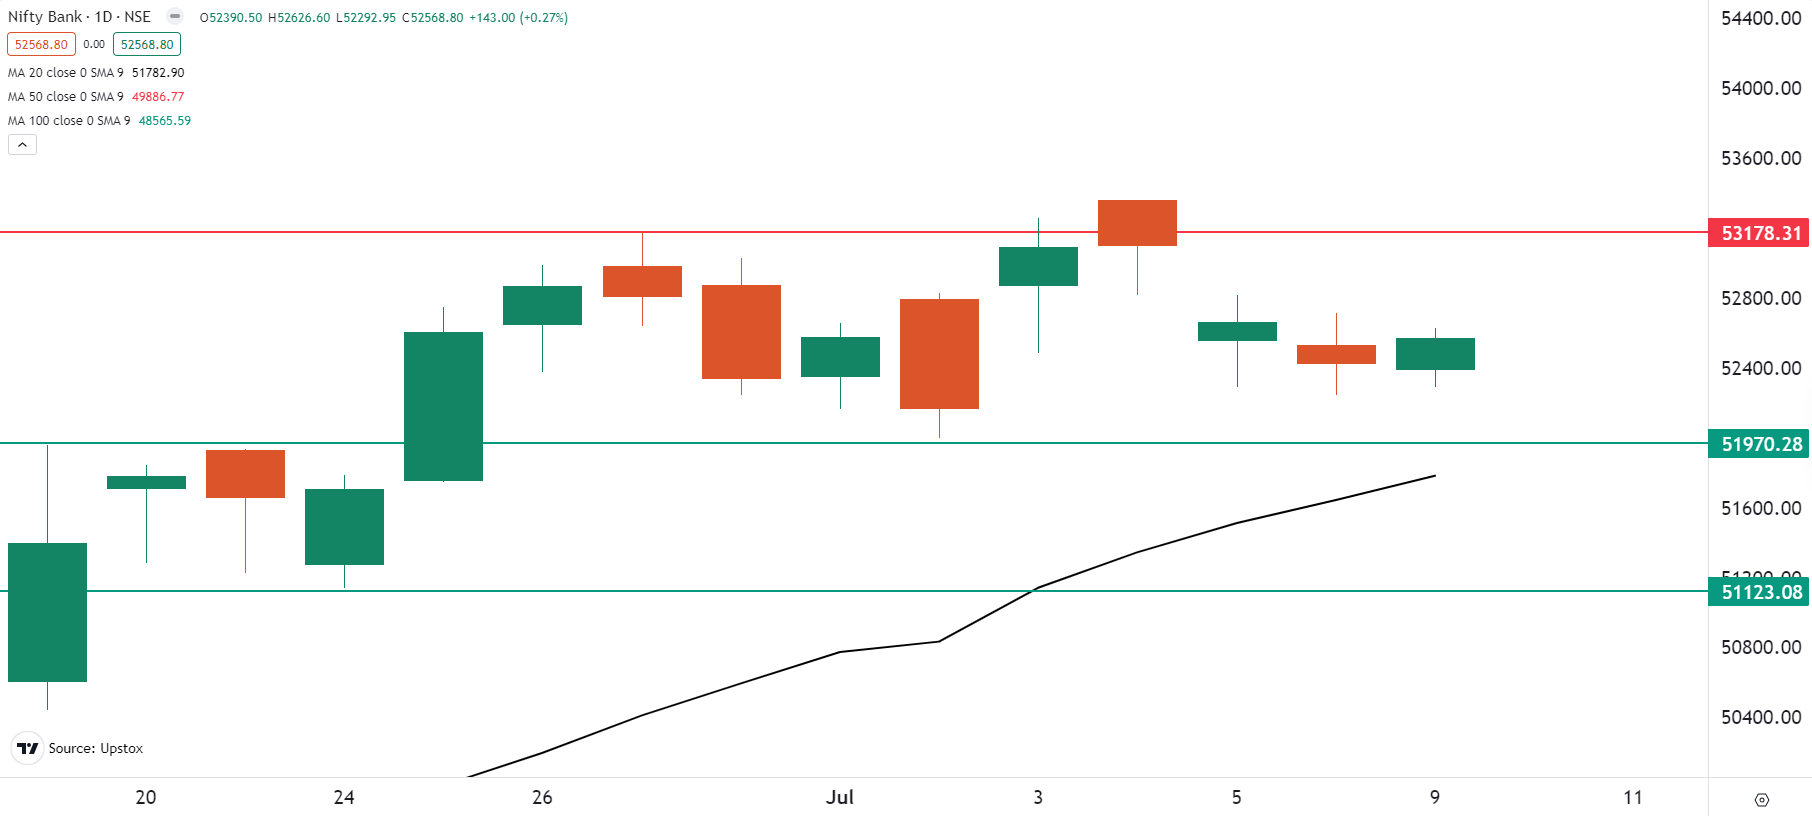
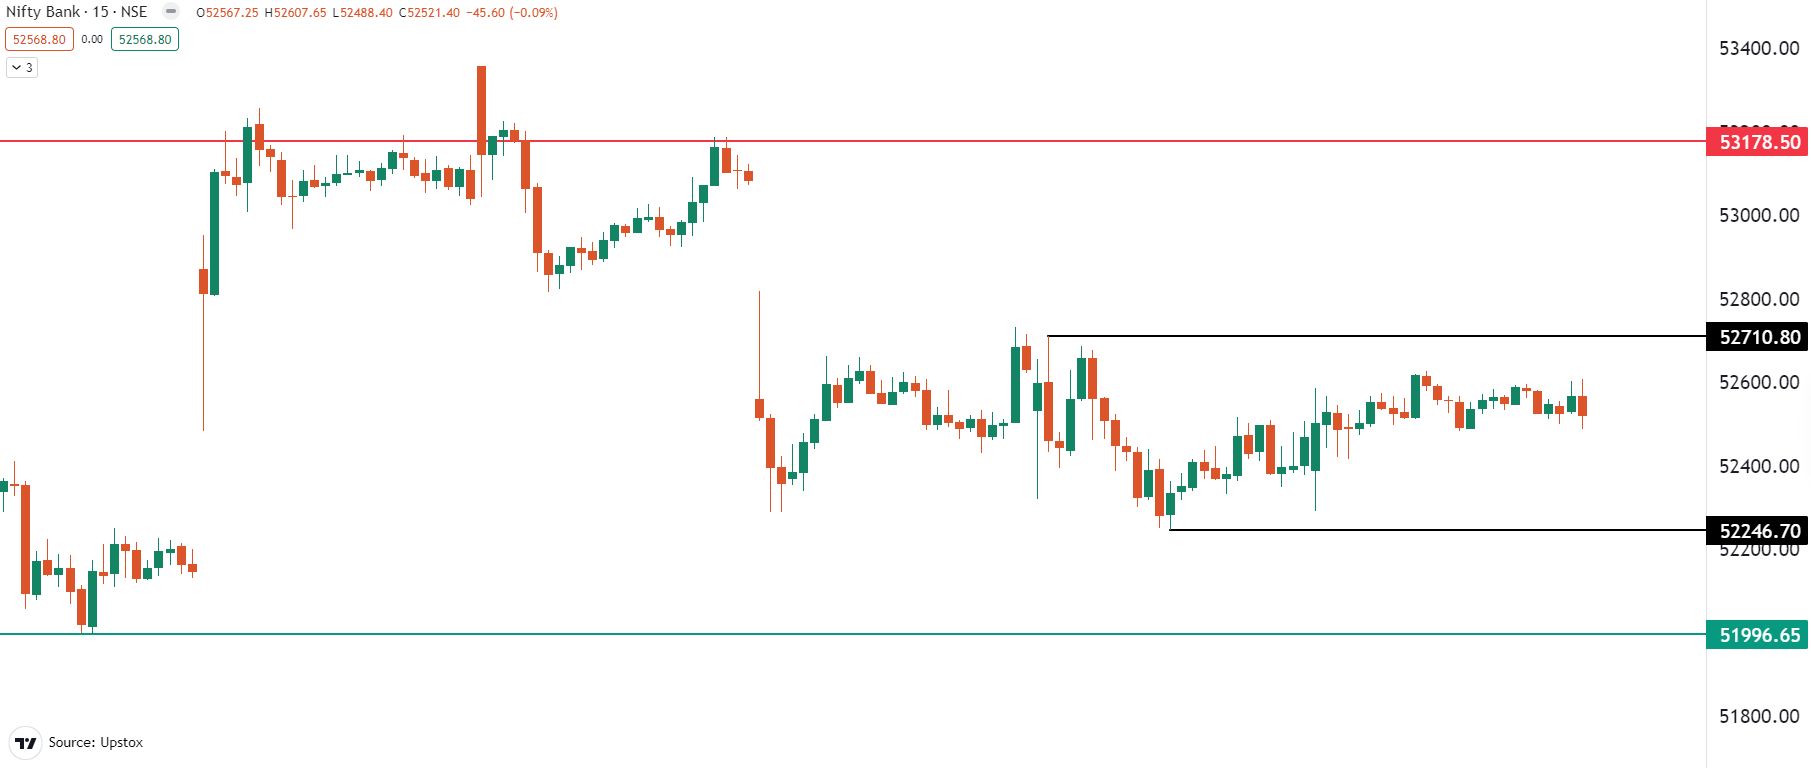
The BANK NIFTY index extended the range-bound activity for the third day in a row, forming an inside candlestick pattern on the daily chart. Trading within a 400-point range the day before the weekly expiry of weekly contracts, the banking index signals potential volatility for the upcoming sessions.
As shown in the chart below, the BANK NIFTY index is trading within a broad range of 53,200 and 52,000. Until the index moves out of this range, it may remain range-bound, causing sharp bouts of intraday volatility. A break of this range on a closing basis on the daily chart will provide further directional clues.
On the 15-minute time frame, the index has immediate resistance between 52,700 and 52,800 zone, with support between 52,200 and 52,000. The index is expected to oscillate within this range until it a breakout occurs on either side. Once the range is broken, traders can plan and execute their strategies accordingly.
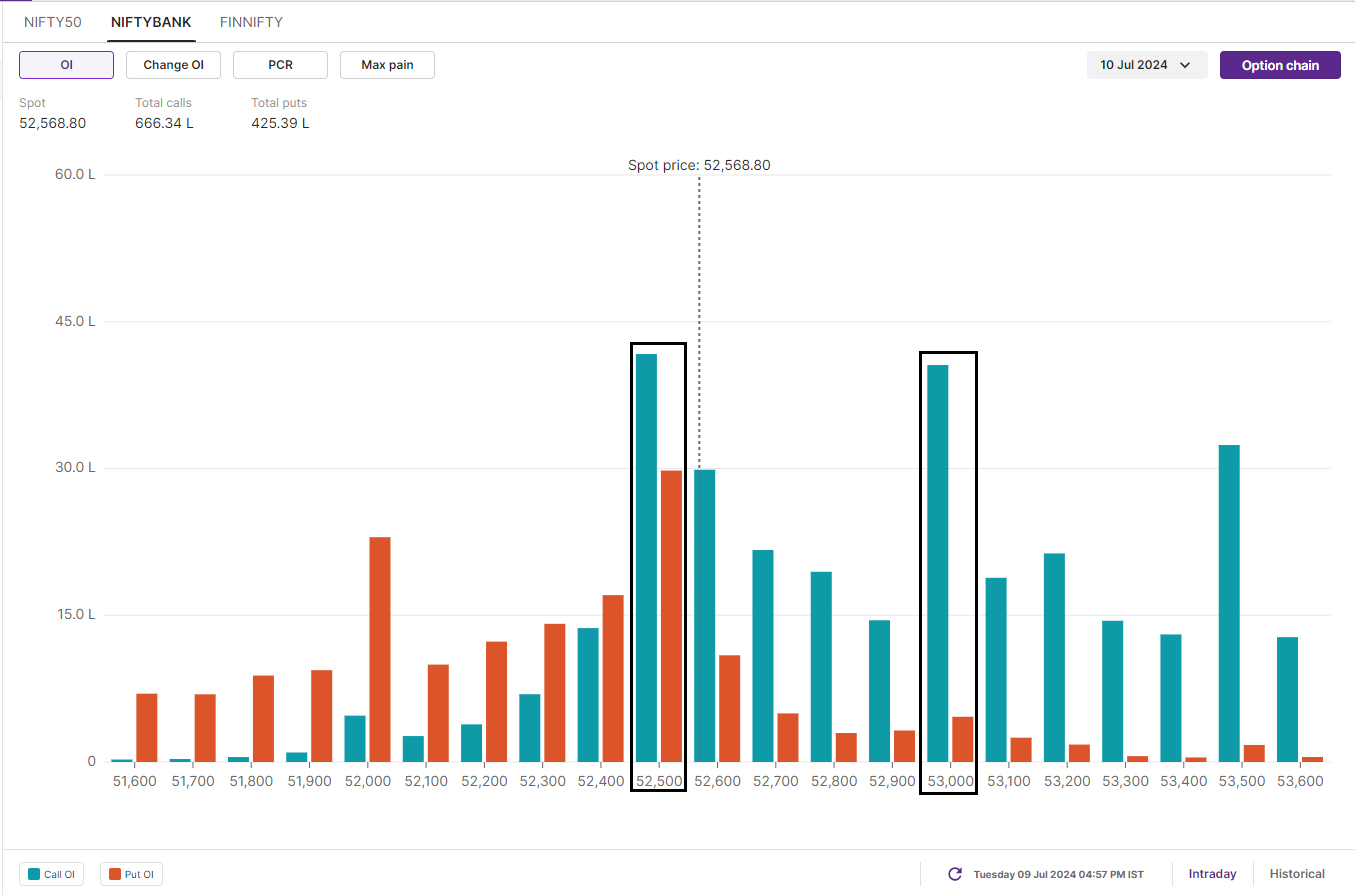
For today's expiry, the BANK NIFTY has maximum call open interest at the 52,500 and 53,000 strikes, making these strong resistance zones. On the other hand, put open interest is at the 52,500 and 52,000 strikes, making these immediate support zones. It is important to note that the 52,500 strike has also accumulated significant call and put open interest, indicating a trading range of 52,000 and 53,000.
FII-DII activity
Stock scanner
Under F&O Ban: Aditya Birla Fashion and Retail, Balrampur Chini Mills, Bandhan Bank, Chambal Fertilisers, Gujarat Narmada Valley Fertilisers & Chemicals, Indian Energy Exchange, India Cements, Indus Towers and Piramal Enterprises
Out of F&O Ban: Hindustan Copper
In Futures and Options or F&O, long build-up means an increase in Open Interest (OI) along with an increase in price, and short build-up means an increase in Open Interest(OI) along with a decrease in price.
Source: Upstox and NSE.
Disclaimer: Derivatives trading must be done only by traders who fully understand the risks associated with them and strictly apply risk mechanisms like stop-losses. The information is only for consumption by the client and such material should not be redistributed. We do not recommend any particular stock, securities and strategies for trading. The securities quoted are exemplary and are not recommendatory. The stock names mentioned in this article are purely for showing how to do analysis. Take your own decision before investing.
About The Author
Next Story

