Market News
SBI Q1 results| How to trade in SBI ahead of its first quarter earnings?
.png)
4 min read | Updated on August 02, 2024, 13:11 IST


SUMMARY
State Bank of India is currently trading near its key support level, the 50-day moving average (50-DMA). Over the past two months, the stock has consolidated its gains within the range established during the election week and tested the 50-DMA twice last month.
Stock list
Options strategy for State Bank of India ahead of its first quarter results
Experts believe that SBI could see a modest increase in net profit, with figures potentially rising 1%-2% year-over-year (YoY) between ₹17,000 and ₹17,100 crore. Additionally, the bank's net interest income (NII) is expected to grow by 6%-7% YoY, approximately ₹41,500 to ₹42,000 crore.
During the first quarter of FY25 results, investors and traders will be looking forward to key monitorables such as net interest margins, gross non-performing assets (GNPA), loan book growth and loan-to -deposit ratio.
As of 11:30 am, SBI shares are trading 1.2% lower at ₹852. However, SBI shares have gained more than 34% so far this year.
Technical View
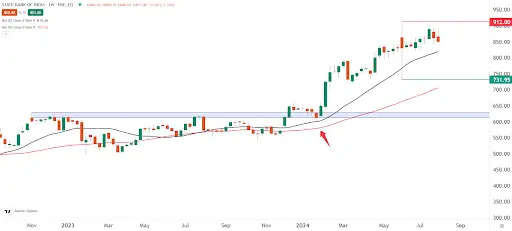
State Bank of India has been in an uptrend since the breakout in December 2023. The stock is trading above its weekly 20 and 50 day moving averages and consolidating at higher levels. As you can see on the chart below, the stock is currently oscillating between its election week range and consolidating at higher levels.
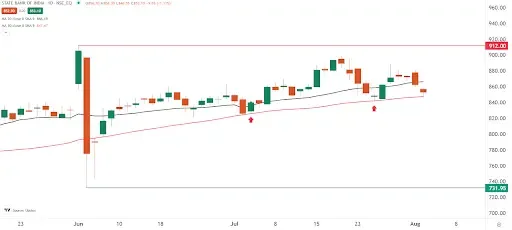
Using the same levels on the daily chart as key support and resistance levels, similar to BANK NIFTY, the stock is currently trading between its 20 and 50 day moving averages (DMAs). It is currently trading at its 50 DMA, a key short-term support level. The stock has tested the 50 DMA on two occasions in the past month and has bounced back. On the other hand, immediate resistance lies between the 900 and 912 zones. Traders looking for directional clues can monitor both levels as a break on either side will provide insight for directional strategies.
Options build-up
As of 11am on 2 August, open interest data for the 29 August expiry shows a significant concentration of call options at the 880 and 900 strikes. In addition, there was a notable unwinding of put options at the 870 strike. In terms of new activity, there were significant additions of both call and put options at the 850 strike, suggesting range-bound activity around this level.
Options strategy for State Bank of India (SBI)
The options data for SBI's 29 August expiry shows a potential price movement of ±6%, providing strategic opportunities for traders based on their volatility expectations.
-
Expect increased volatility: If you expect volatility to increase, consider a Long Straddle strategy. This involves buying both an ATM call and an ATM put option with the same strike price and expiry date. This approach will benefit if the price of SBI moves significantly beyond the range of ±6% in either direction.
-
Expectation of lower volatility: If you believe that volatility will remain low, a Short Straddle may be more suitable. This strategy involves selling both an ATM call and an ATM put option with the same strike price and expiry, and profiting if the price of SBI stays within ±6%.
Derivatives trading must be done only by traders who fully understand the risks associated with them and strictly apply risk mechanisms like stop-losses. The information is only for educational purposes. We do not recommend any particular stock, securities and strategies for trading. The stock names mentioned in this article are purely for showing how to do analysis. Take your own decision before investing.
About The Author
Next Story


