Market News
Asian Paints Q3 results: Check earnings preview and technical structure ahead of results
.png)
4 min read | Updated on February 04, 2025, 11:02 IST


SUMMARY
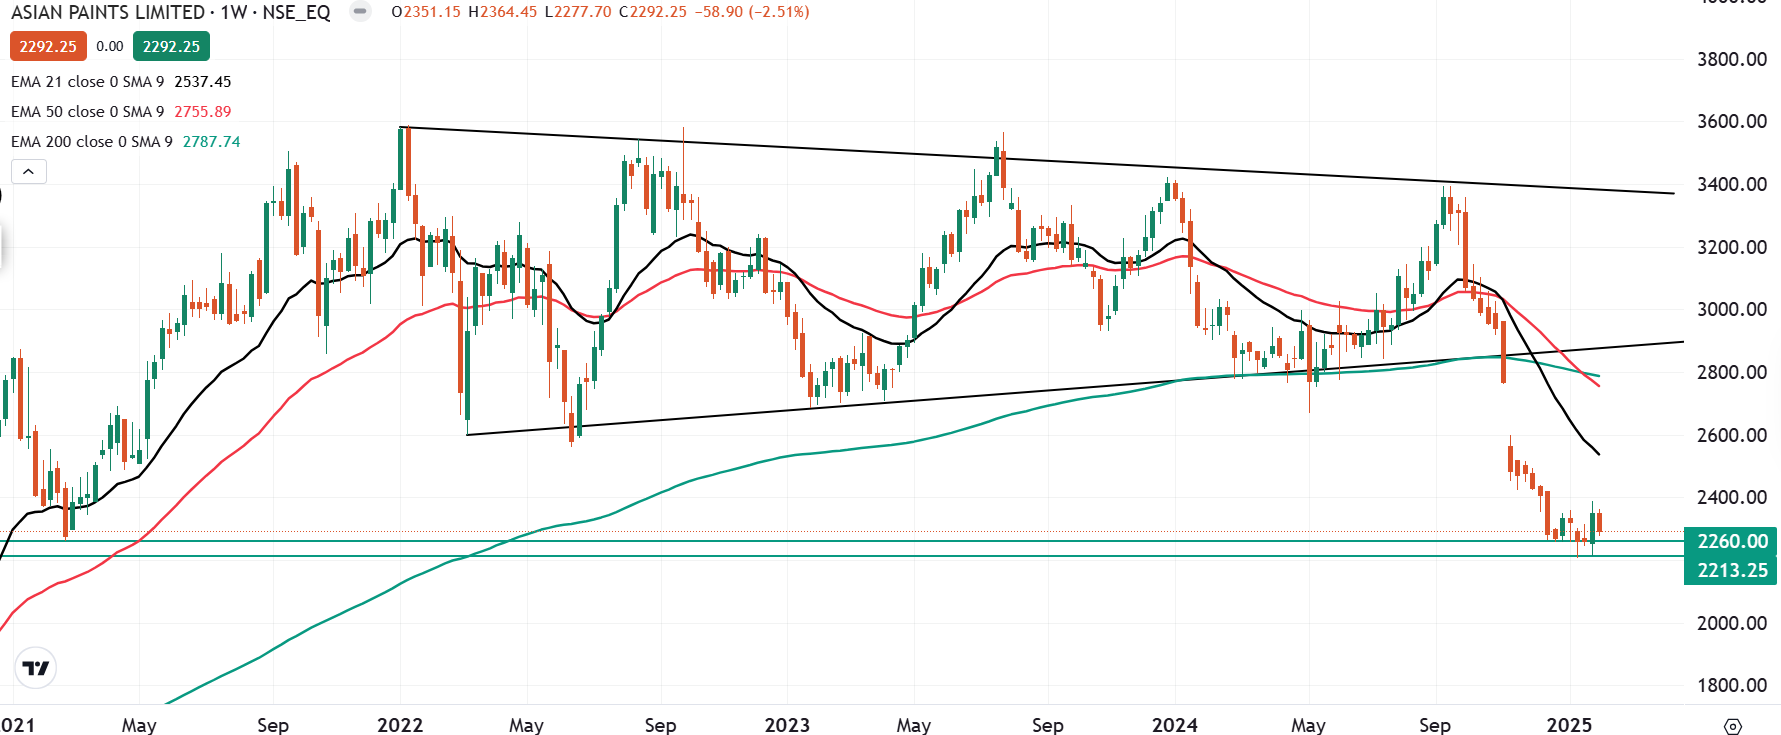
Shares of Asian Paints have declined over 21% in the last one year and are currently trading at a crucial support zone of ₹2,200. With the options market implying a ±6.3% ahead of its earnings announcement, traders can monitor the price action around the crucial support zone.
Stock list

Asian Paints is one of the top paint and decor companies in India with a consolidated turnover of nearly ₹35,382 crore | Image source: Shutterstock
Asian Paints, India's largest paint manufacturer, will release its results for the December quarter (Q3FY25) on February 4, 2025. Experts anticipate subdued earnings, with year-over-year declines in both revenue and net profit.
Experts project a 2-5% year-over-year decrease in consolidated revenue, ranging from ₹8,670 to ₹8,850 crore, compared to ₹9,103 crore in Q3FY24 and ₹8,028 crore in the previous quarter. Net profit is expected to fall sharply, by 22-25% year-over-year, to between ₹1,105 and ₹1,145 crore. These declines are primarily attributed to lower sales volumes, a slowdown in urban consumption, and a high base effect from the previous year.
Investors will be closely watching for management commentary on the impact of rising raw material costs, particularly crude oil, on margins and profitability. The company's outlook on demand and competitive pressures will also be key, especially given the recent market entry of Birla Opus, which has put pressure on Asian Paints' stock price.
Shares of Asian Paints ended 2.5% lower at ₹2,292 apiece on the NSE on Monday, February 3rd, ahead of Q3 results.
Technical View
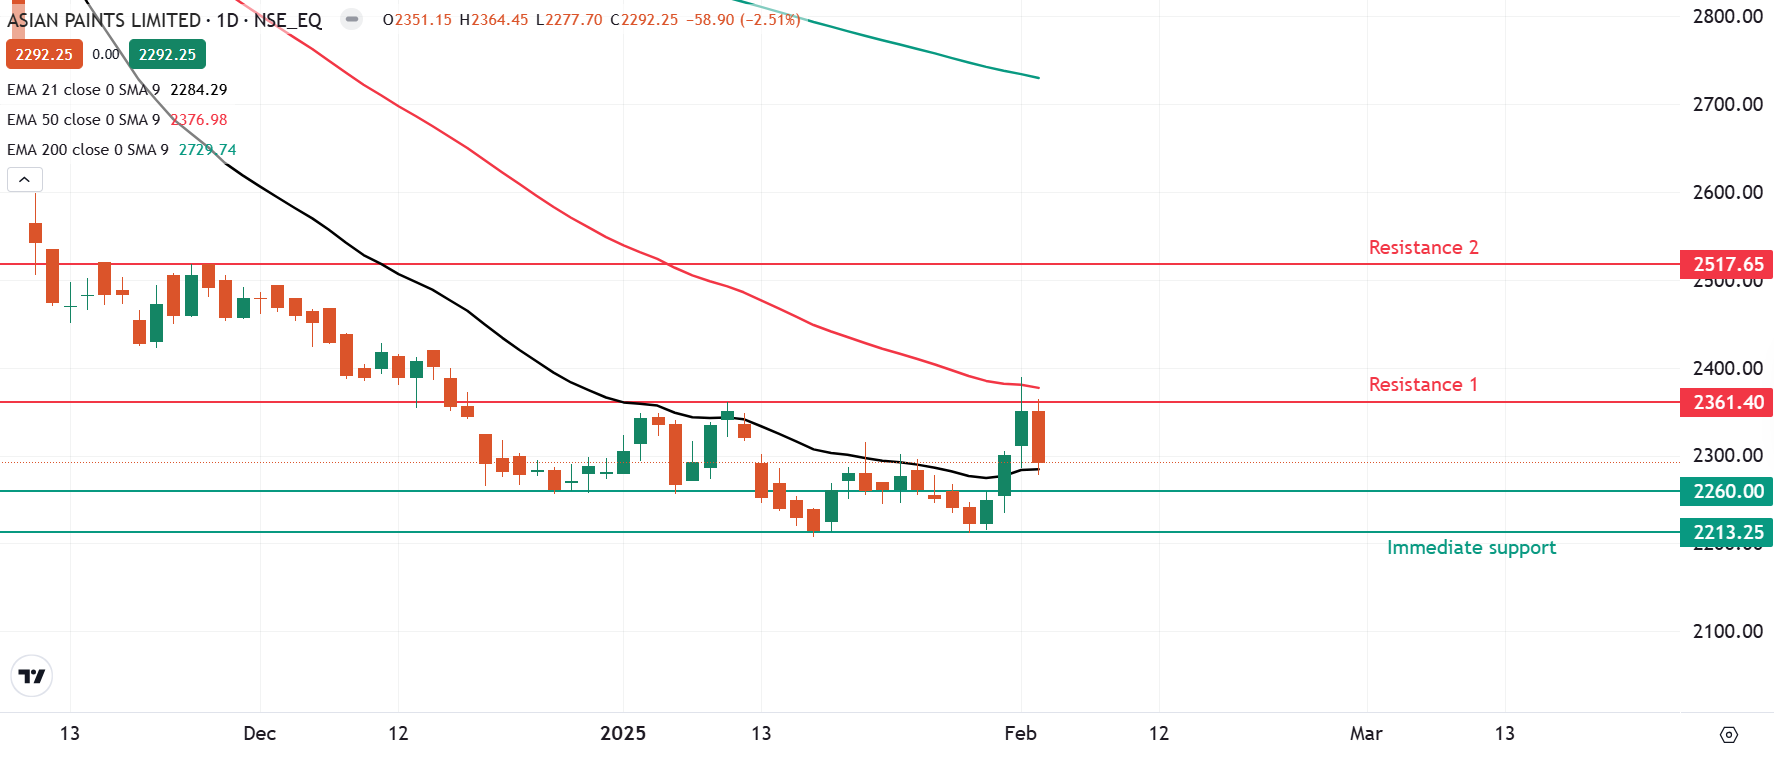
Meanwhile, on the daily chart, traders can monitor the range of ₹2,361 and ₹2,213. A break of this zone on a closing basis will provide short-term directional clues.
Options outlook
Options data of 27 February expiry reveals significant open interest accumulation at call strikes of 2,400 and above, suggesting a resistance level. Conversely, put option interest is concentrated at the 2,200 strike.
Options strategy for Asian Paints
Given the implied move of ±6.3% from the options data, traders can initiate either a long or short volatility trade, taking into account the price movement. To trade based on volatility, a trader can take a Long or Short Straddle route.
Straddles are the options strategies that are primarily used on the basis of volatility. In simple terms, in a Long Straddle, a trader can buy an ATM call and a put option of the same strike and expiry of Asian Paints, looking for a move of more than ±6.3% on either side.
On the other hand, the Short Straddle capitalises on the fall in volatility. In a Short Straddle, a trader sells both ATM call and a put option of the same strike and expiry. This strategy is deployed when the trader believes that the price of the Asian Paints after the earnings announcement will be confined in a range of ±6.3%.
Meanwhile, traders seeking a more strategic approach to bullish or bearish options trading can explore directional spreads, which provide a refined alternative to simple option buying.
For a bullish outlook, a bull call spread involves buying a call option while simultaneously selling a higher strike call with the same expiration, reducing cost while capping potential gains.
Conversely, for a bearish stance, a bear put spread consists of buying a put option and selling a lower strike put, balancing risk and reward.
For a deeper dive into Straddles, explore our UpLearn educational content for comprehensive insights. Interested in historical earnings price data? Join our community and connect with us—we’d be delighted to share it with you!
About The Author
Next Story


