Market News
MCX Silver sustains bullish momentum, strengthens above inverse head and shoulders; check trade setup
.png)
3 min read | Updated on March 12, 2025, 18:21 IST


SUMMARY
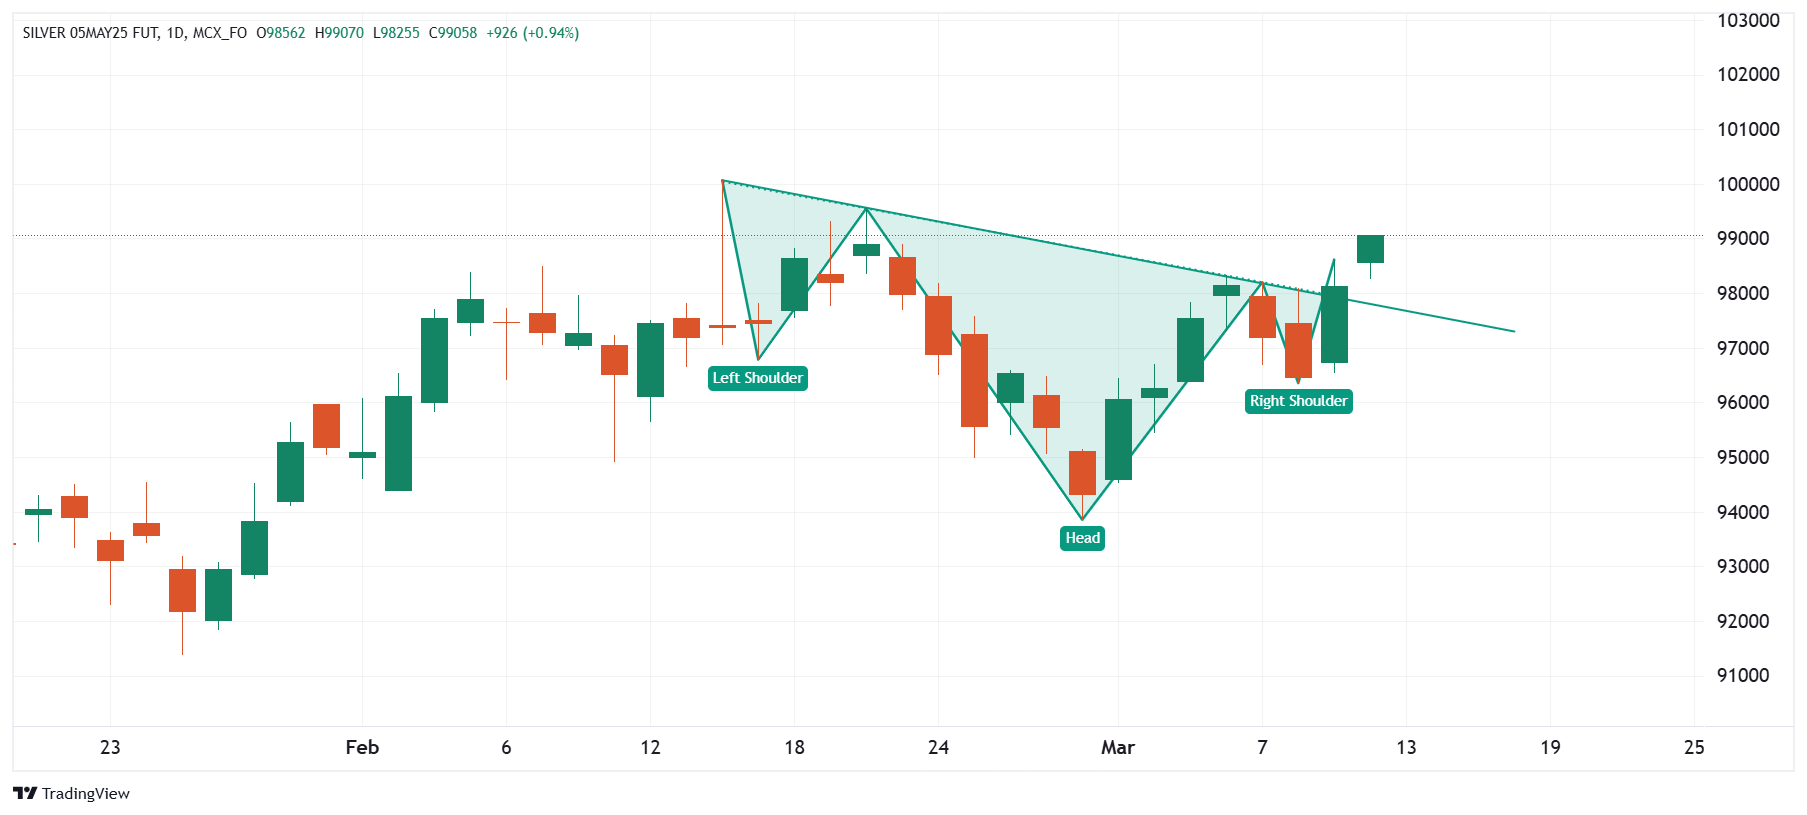
MCX Silver has broken out of the inverse head and shoulders pattern, though not decisively. This bullish reversal pattern signals a potential shift from bearish to bullish. However, if the price drops below the breakout candle, the pattern will get invalidated.
Gold extends range-bound movement for the 19th consecutive session. | Image: Shutterstock
Market recap (as of 6:15 pm)
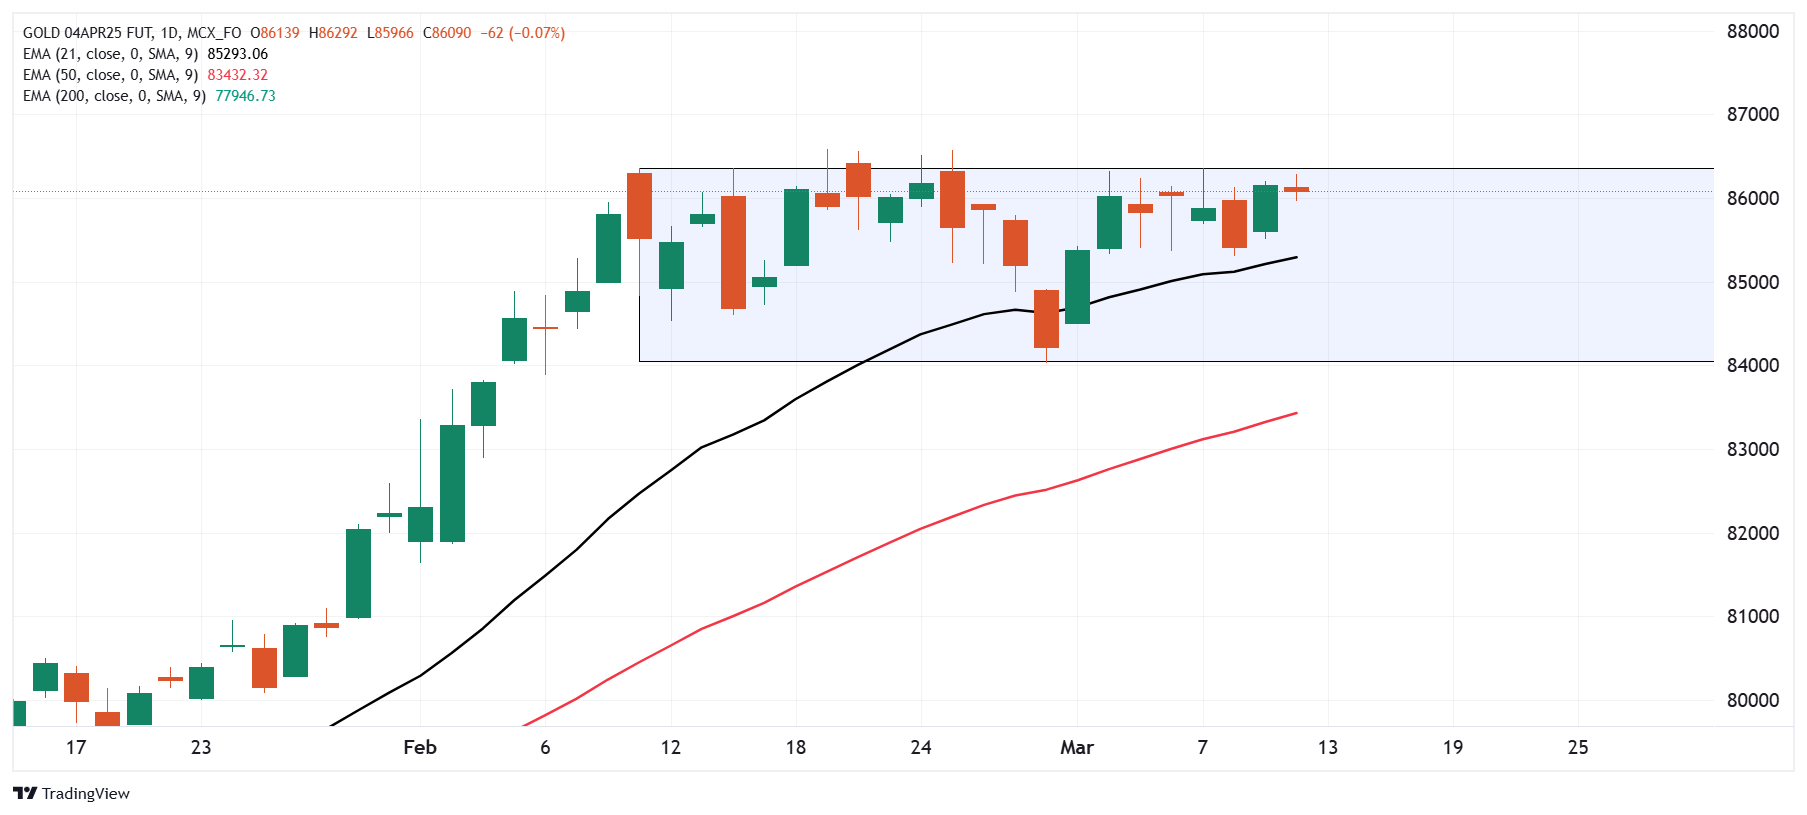
- Gold 4 April Futures: ₹86,170/ 10 gram (▼ 0.02%)
- Silver 5 May Futures: ₹98,320/ 1 kg (▲ 1.21%)
- Crude Oil 19 March Futures: ₹5,864/ 1 BBL (▲ 1.28%)
Technical structure
As shown on the chart below, Silver has given the breakout of the inverse head and shoulder pattern, although not a clean one. The inverse head and shoulders is a bullish reversal pattern that signals a potential trend change from bearish to bullish. If the price falls below the breakout candle after confirming the pattern, it becomes invalid.
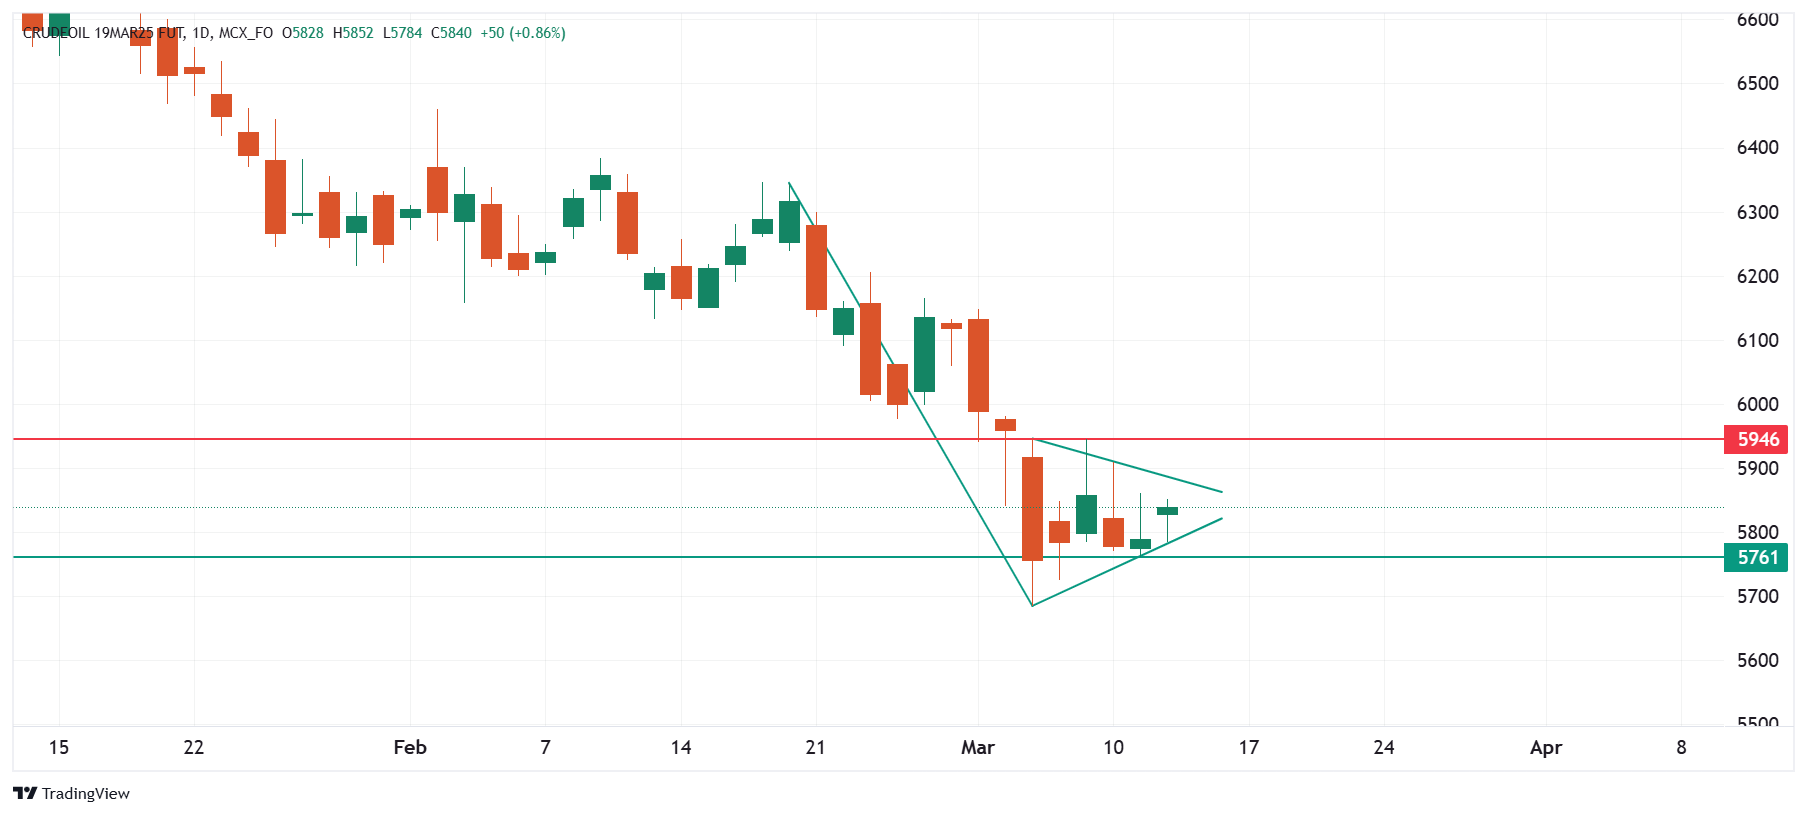
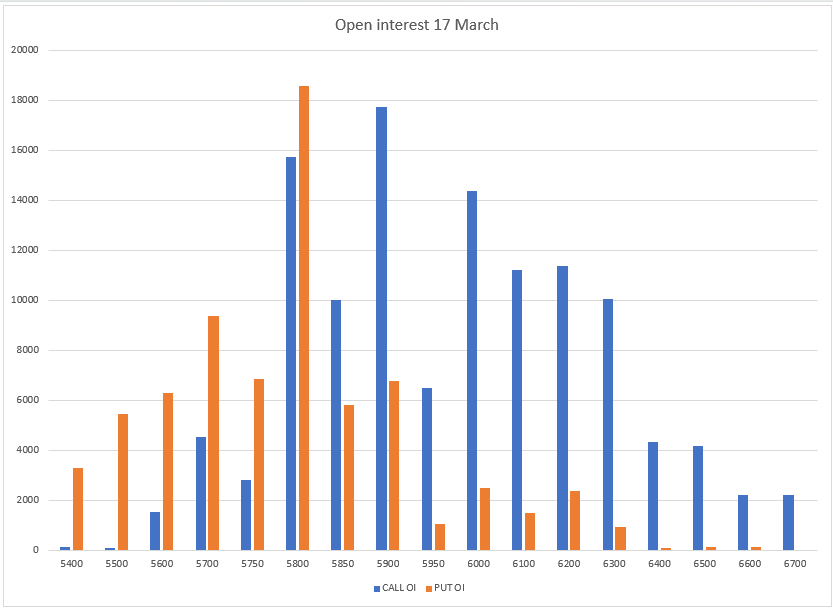
The open interest (OI) data for the March 17 expiry saw significant put open interest build-up at 5,800 strike, indicating support for the crude around this zone. Conversely, the call OI base was seen at 5,900 strike, reflecting resistance for crude around this zone.
Disclaimer:
Derivatives trading must be done only by traders who fully understand the risks associated with them and strictly apply risk mechanisms like stop-losses. The information is only for the client's consumption, and such material should not be redistributed. We do not recommend any particular stock, securities, or strategies for trading. The securities quoted are exemplary and are not recommendatory. The stock names mentioned in this article are purely to show how to do analysis. Take your own decision before investing.

About The Author
Next Story


