Non-linearity of options payoffs
What is an Option?
An option can be said to be a contract between a buyer and a seller, where a buyer pays the premium to the seller for the right to buy (call option) or to sell (put option) an asset at a predetermined future date (expiry date) at a specific price (strike price).
Non-Linearity
The payoff characteristic of an option is non-linear in nature. This means that the price movement of the asset does not have a direct correlation with the price of an option. Due to this there is a potential for the buyer of an option to gain unlimited profits while keeping the losses restricted to a limited value, irrespective of the price movement; however the behavior for the seller of an option would be exactly in the opposite way: if not fruitful, possibly limited gains and unlimited losses.
This kind of a non-linear behavior of the options is very attractive as they have a potential of giving a high amount of gains while restricting the losses to a limited value. Options can be used in various combinations, thus generating different kinds of options payoffs.
Let us first understand the basic payoffs of the options and their underlying assets and in the later part, we would go through the different combinations of options & its underlying asset.
[table id=42 /]
[caption id="attachment_517" align="aligncenter" width="634"]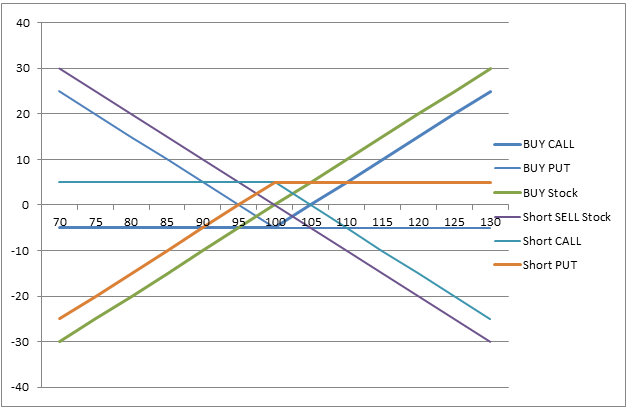 Ideal Characteristics of a Options Payoff Graph[/caption]
 Ideal Characteristics of a Options Payoff Graph[/caption]
Different Types of Options Payoffs
Payoff on a Long Asset
When an investor is bullish and buys a particular stock and holds it for a term period, he is said to be LONG on the asset. As the price moves, the profit/loss also moves in a linear correlation.
Payoff on a Short Sell Asset
When an investor is bearish and short sells the asset in futures (since cash short selling is not allowed), he is said to be SHORT on the asset. As the price moves the profit & loss also moves in a linear correlation.
Payoff on a Buy of Call Option
When an investor is bullish on a particular asset but has a low/medium risk appetite he buys a call option and holds it till expiry. As seen in the graphical representation the price in the north direction has a direct correlation whereas in the southward direction has a correlation till the premium paid price and then flattens up, thus creating a non-linear behavior; this is unlike the previously mentioned behavior of a buy/sell on an asset directly. Thus, the gain would be maximum with a minimum/fixed loss.
Payoff on a Buy of Put Option
When an investor is bearish on a particular asset but has a low/medium risk appetite he buys a put option and holds it until expiry. As seen in the graphical representation the price in the southward direction has a direct correlation whereas in the north has a correlation till the premium paid price and then flattens up thus creating a non-linear behavior unlike BUY/SELL on an asset directly. Thus, the gain would be maximum with a minimum/fixed loss.
Payoff on a Short Sell Call Option
Here the investor has a bearish view but rather than paying the premium he would be more interested in receiving the premium. Thus, he would enter into a short sell trade. Here the investor who short sells takes the complete risk in the trade as gains would be limited with possible huge losses if the price moves in the opposite direction. Thus the payoff would be exactly opposite to that of a call option buy.
Payoff on a Short Sell Put Option
The only difference between the Short SELLS of CALL & PUT option would be the view of the investor which is Bullish. The Payoff would be exactly opposite to that of a PUT Option buy.
In the chart and data above, one would assume that the characteristic payoff of all futures, calls, and puts should look like. Let us see the actual data from NSE derivatives for the month of Jan-2013 with the expiry date of 31st Jan 2013.
Table (A) displays the data of Nifty futures, 6000CE & 6000PE & (+) Profit / (-) Loss with the buy position of each and table (B) displays the data of Nifty futures, 6000CE & 6000PE and the (+) Profit / (-) Loss for the cell position of each in the month of January 2013.
[table id=44 /]
[caption id="attachment_518" align="aligncenter" width="667"] Table (A) displays the data of Nifty futures, 6000CE & 6000PE & (+) Profit / (-) Loss with the buy position of each[/caption]
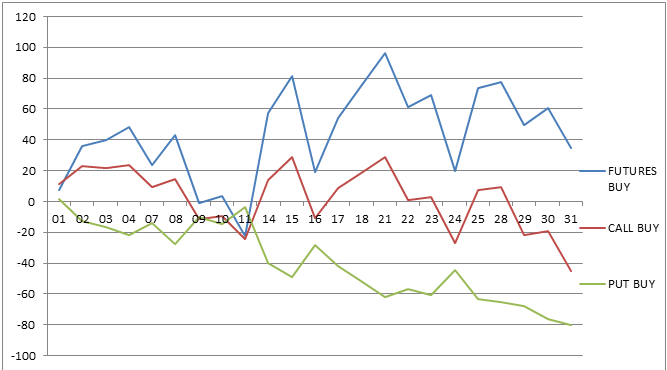 Table (A) displays the data of Nifty futures, 6000CE & 6000PE & (+) Profit / (-) Loss with the buy position of each[/caption]
[table id=45 /]
[caption id="attachment_545" align="aligncenter" width="656"] Table (B) displays the data of Nifty futures, 6000CE & 6000PE & (+) Profit / (-) Loss with the sell position of each[/caption]
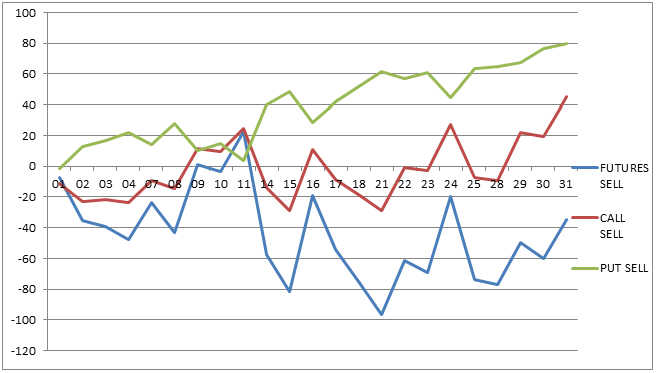 Table (B) displays the data of Nifty futures, 6000CE & 6000PE & (+) Profit / (-) Loss with the sell position of each[/caption]
Thus we can see that the options can be a great tool for a low/medium risk investor giving an opportunity for high gains possibly by the transfer of risk from the buyer of an option to the seller as seen in the graphical representation.