Stock alert | Chart pattern of HUL

What is a Head and Shoulders pattern?
A head and shoulders pattern indicates a bearish-to-bullish trend reversal. After a long bearish trend, the price rises to a high (left shoulder) and declines to form a low. The price rises again, creating a higher high (head) and declines to make a low. Finally, the price rises for the third time (right shoulder) but is unable to cross the high made by the head. The chart pattern consists of three lows where the outer two lows are similar in height, and the middle low is the lowest. The trendline connecting the two highs is called the neckline.
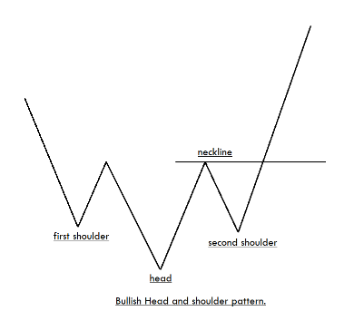
Pattern Implications
The head and shoulders pattern indicates that the existing downward trend could end soon. The uptrend is signalled when the neckline is broken and the price closes above it.
Trading Strategy
In such a scenario, the traders can deploy a bull call spread strategy. In this strategy, a trader can go long on an ATM (at-the-money) call option and initiate a short position in a far OTM (out-of-the-money) call option, both belonging to the same expiry. The short OTM call option acts as a hedge to the long ATM call option, thereby capping a trader’s profit or loss to a certain level.
Meanwhile, Hindustan Unilever has shown a similar pattern on its daily charts.
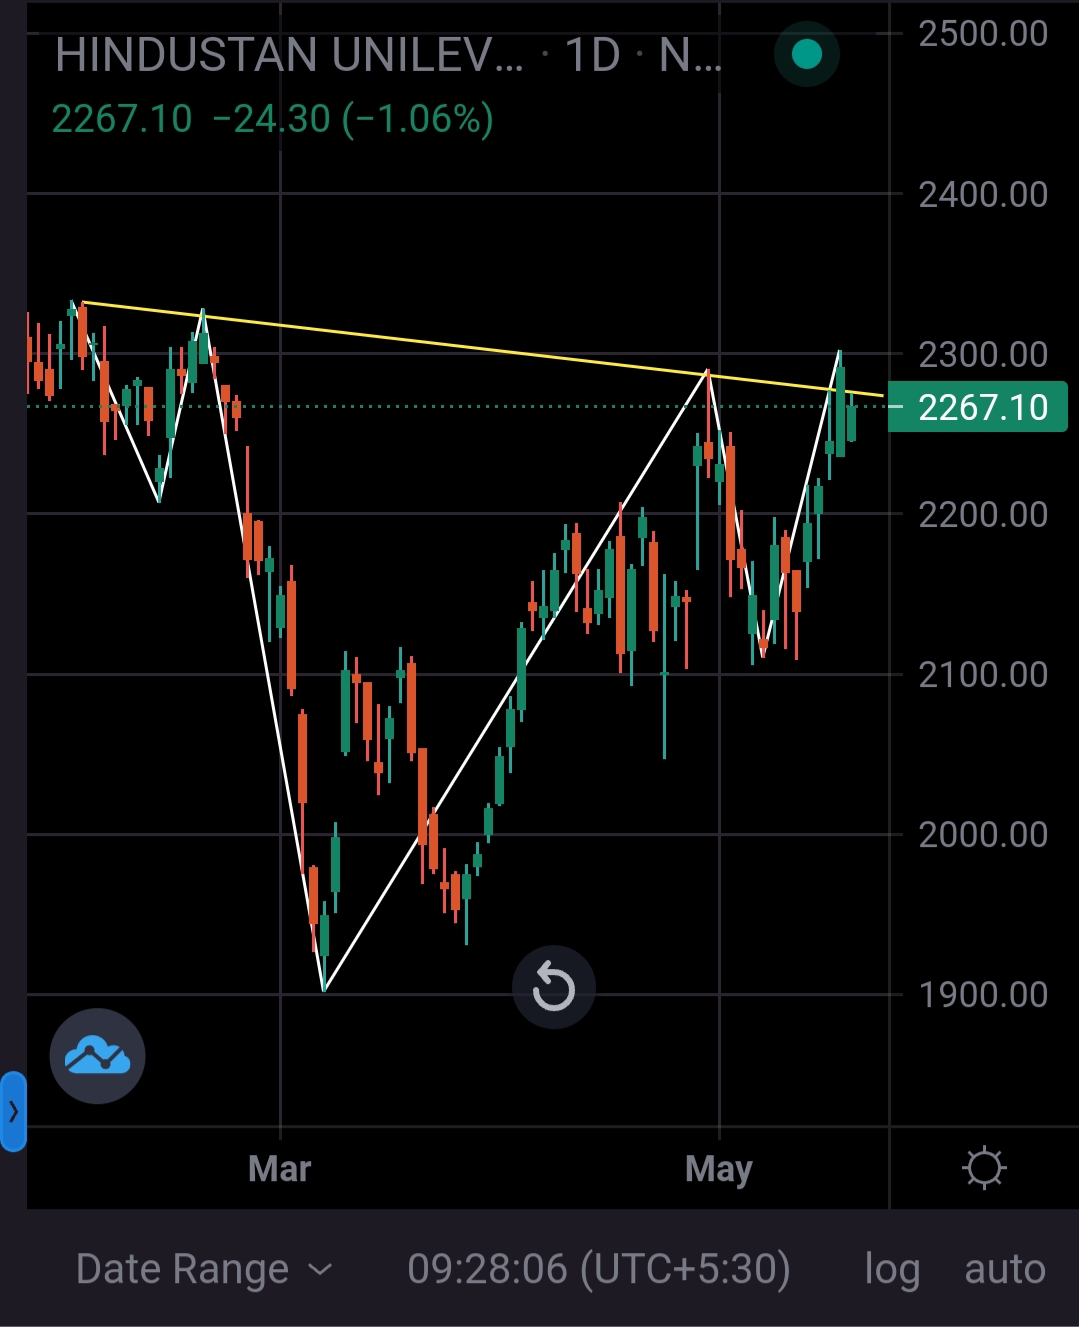
Note: The chart illustrated here is for better understanding and educational purposes only
Disclaimer
*Derivatives trading must be done only by traders who fully understand the risks associated with them and strictly apply risk mechanisms like stop-losses. *
Wedo not recommend any particular stock, securities and strategies for trading.The securities quoted are exemplary and are not recommendatory. The stock names mentioned in this article are purely for showing how to do analysis. Take your own decision before investing.