1. fno discovery

Discover trading opportunities with

Advanced trading tools for the web

Explore
oi-app-banner
oi-banner

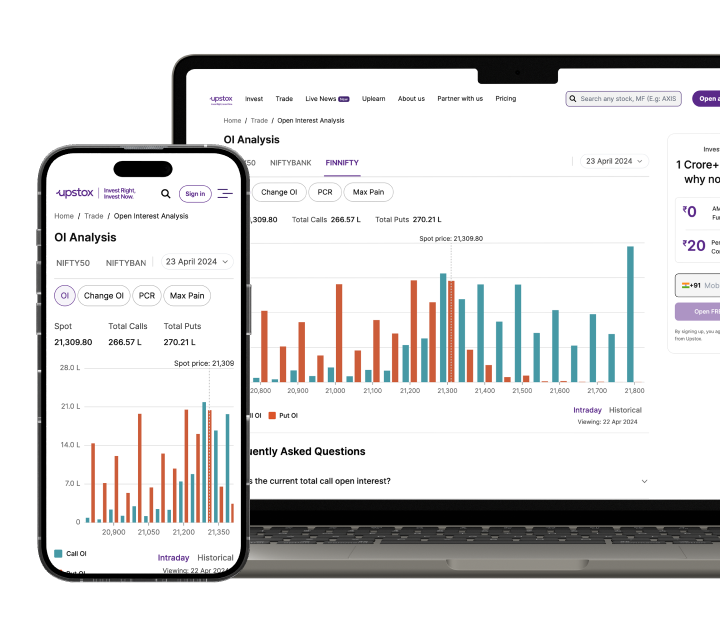
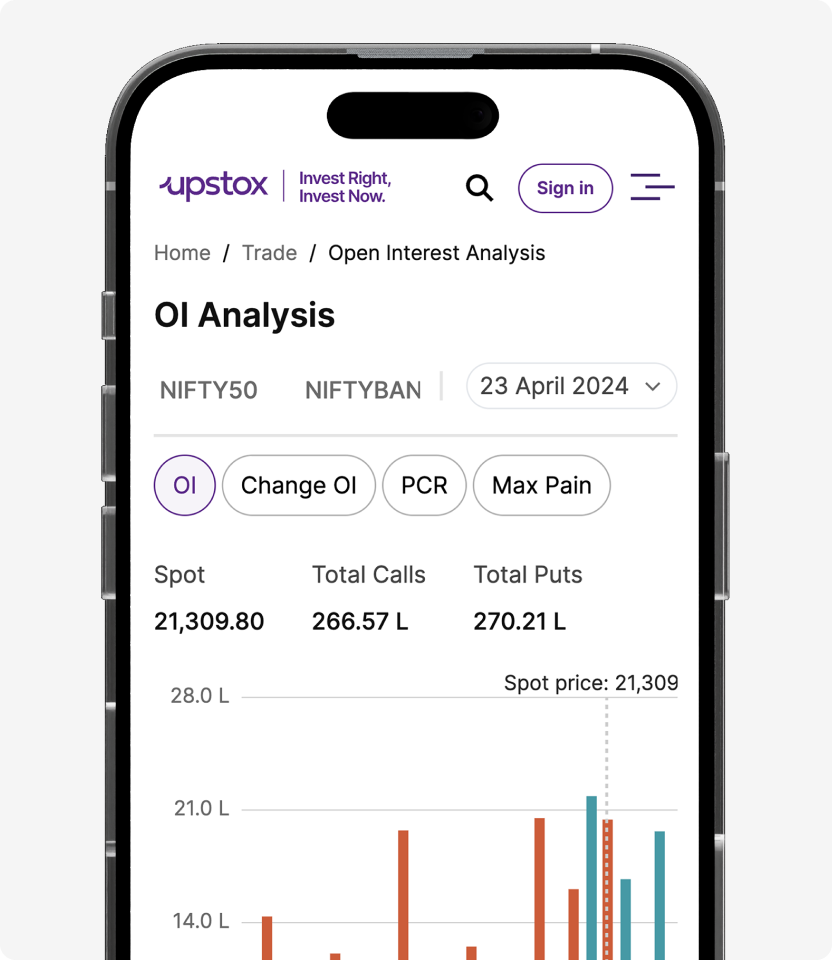
OI Analysis

Explore OI Analysis for NIFTY 50, BANKNIFTY and FINNIFTY
oi-banner

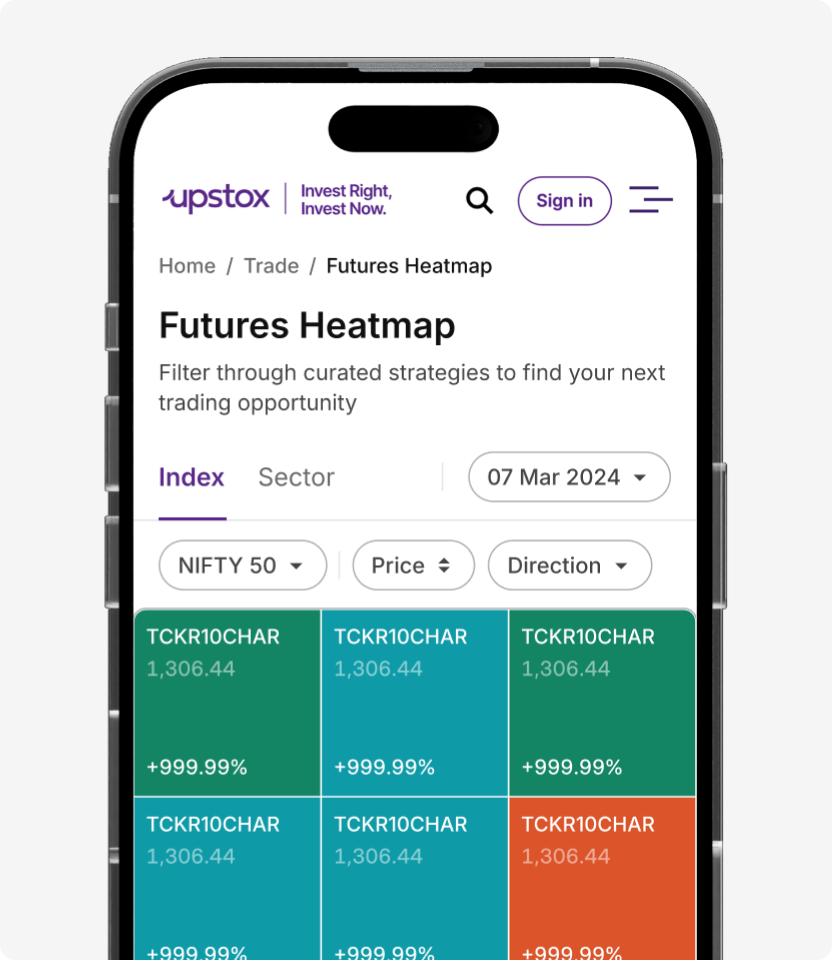
Futures Heatmap

Visualize today’s price and open interest changes for the constituents of major indices

Frequently Asked Questions

What is open interest?chevron-up

Open interest (OI) is the total number of contracts for an option that are currently open. It is an indicator of sentiment for both the market and individual strikes. Option contracts are “bought to open”, “sold to open”, “bought to close”, or “sold to close”. Whenever a contract is “opened”, open interest increases; whenever a contract is “closed”, open interest decreases. This is different than volume as volume measures transaction activity throughout a single trading session. Open Interest is measured through the life of the option contract.

What is a heatmap?chevron-up

The futures heatmap shows a graphical view of the price and OI changes associated with the futures of the constituents of major indices like the Nifty50 and Nifty Bank. Traders can use the heatmap to quickly assess if the market is in a bullish, bearish, cautiously bullish, or cautiously bearish situation. In addition, traders can visually see which stocks are driving the overall index movements.

How do you use open interest?chevron-up

Open Interest is analogous to money flowing into the market. If open interest for a particular strike is higher compared to other strikes, then the market views this strike price to be more noteworthy than the surrounding ones. This could mean that there are more traders think that price action will occur around this strike than the others. You can also use OI changes in combination with price changes to understand market sentiment.

How do you read a futures heatmap?chevron-up

How do you read a futures heatmap? The Futures heatmap has a color coding based on whether the price is going up or down and if the open interest is going up or down. If the color is green, then there is a long build-up which is a bullish sentiment. If the color is orange, then a short build-up is occurring which indicates a downtrend. When it is blue, there is short covering happening which is when stocks are being pushed higher as short sellers close their positions. Lastly, if the color is yellow, it indicates long unwinding as bullish traders exit their trades.


In addition, traders can also see if an index’s movements are broad-based or limited to specific companies. For example, if the Nifty is down 2% today, you can use the Futures Heatmap to quickly see if all stocks are down or if there are a few sectors that are trending upwards against the prevailing downward movement.

What is long build-up?chevron-up

Long build-up means that new bulls have entered the market, and the upward price trend could continue. This is identified by an increase in open interest along with an increase in the price of the underlying (stock or index).

What is short build-up?chevron-up

Short build-up means that new bears have entered the market, and the downward price trend could continue. When open interest is increasing but the underlying price (stock or index) is decreasing, then a short build-up is likely occurring.

What is short covering?chevron-up

When the open interest in a contract decreases and the price increases, it indicates short covering.

What is long unwinding?chevron-up

Long unwinding is when existing traders are closing positions leading to the price getting pushed down. This is identified when both the open interest and underlying price (stock or index) are decreasing.