Join 1.3 Crore+ Indians
who trust us for
who trust us for
Trading & Investing
4.5+
Avg. app rating- Backed by the Best
Upstox for Investors
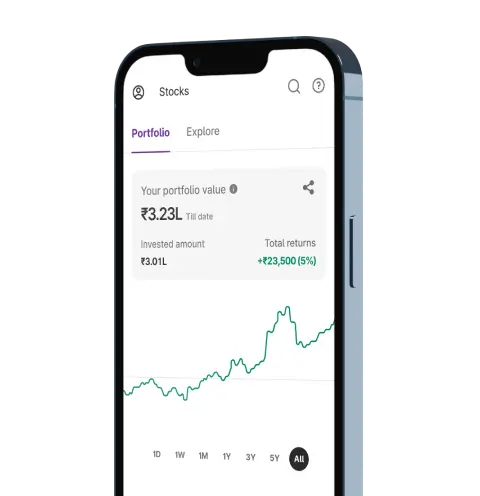
Invest Right, Invest Now in Stocks, Mutual Funds, and IPOs
Investment Ideas
News & Insights
Order Placement
Top rated Funds | Best for Beginners | Top 30 actively traded Stocks

Upstox Pro for Traders
Powerful trading in Equities, Futures, Options, Commodities and Currencies made simple
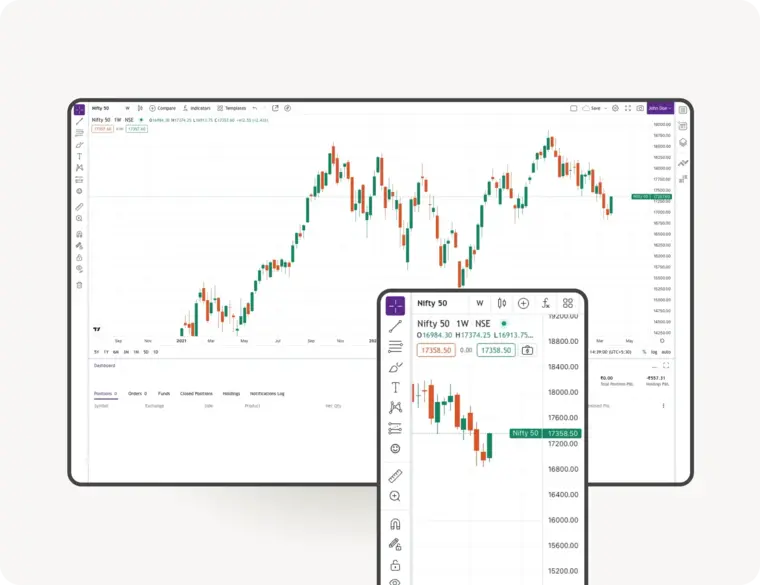
Powerful Charting
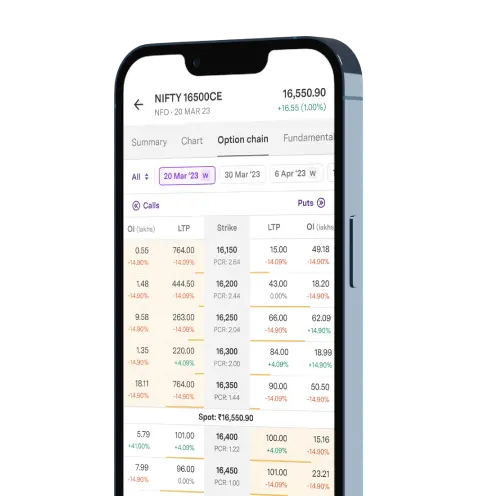
Powerful Discovery
Powerful Execution
TradingView | 8 charts at once | 100+ indicators | 80+ Drawing tools


