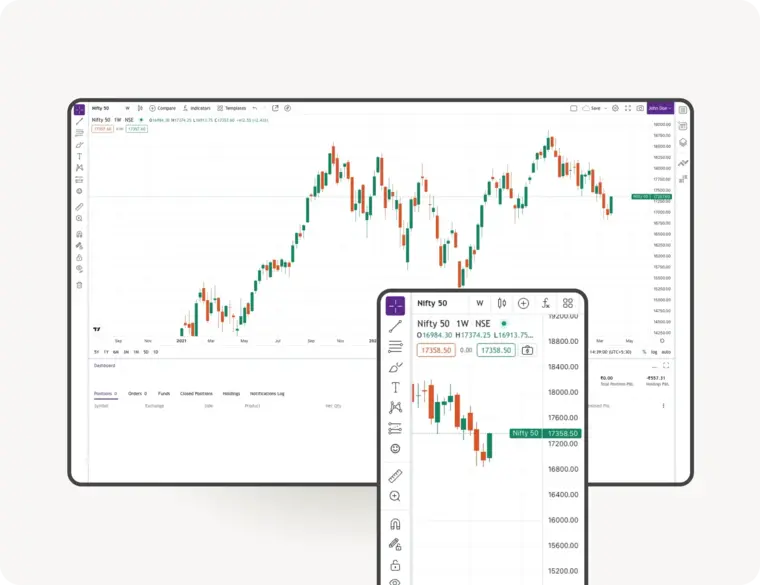
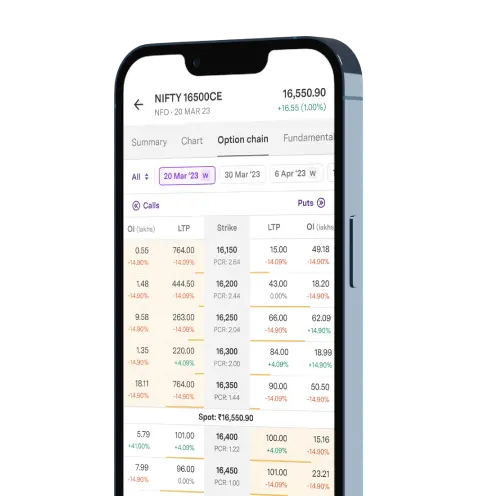
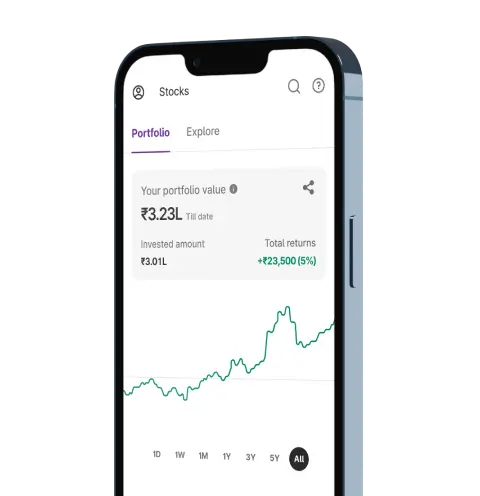
Are you spotting opportunities in the market? Is your strategy good enough? Being on the technical side of trading can be tough at times; but moving with the trend can always be profitable. Here is one trading system which you can follow whether you are an intraday trader or a swing trader.
Technical traders do rely on charting patterns and the trends evolving out of those patterns. These are five checks that you can add to your trading style that will definitely help you identify the right entry and/or exit levels.
-
- Following averages – Moving average indicators are widely used by technical traders. It is a price based, lagging indicator that displays the average price of a security over a set period of time. A moving average is a good way to gauge momentum as well as to confirm trends. Two popular moving averages are SMA (Simple Moving Average) and an EMA (Exponential Moving Average).
-
- Slowing on turns – Eventhough moving averages help in setting a trend, oscillators can help identify turns in a trend. Oscillators measure turns with the help of overbought and oversold levels. Two famous indicators to measure changes or turns in an ongoing trend are RSI (Relative Strength Index) and Stochastic Oscillator indicator.
-
- Warning signals – MACD (Moving Average Convergence Divergence) indicator can be used to confirm a trend or a turn. Many a times a sideways trend can’t be identified from averages or oscillators. That’s when MACD is an effective charting indicator. It gives a fair idea whether a trend is broken or if its just a passing sideways move in the trend.
-
- Cruising with the trend – ADX (Average Directional Index) is one more indicator which helps in identifying whether the market is in a trading phase. A falling ADX line suggests the presence of a trading market and the absence of a trend. A rising ADX line favors moving averages; a falling ADX favors oscillators. This indicator perfectly helps to understand whether a trend exists or not.
- Confirming trends – Using volume charts has always been a traditional way of confirming trends. A solid price uptrend should always be accompanied by rising volume. Rising volume is a confirmation of a strong trend where as falling volume is a sign of turn in trend.
Indicators will always help to identify a move but the cautious trader always has a strong understanding about levels of exit like a stop-loss and profits. Maintaining support and resistance levels are still useful ways to avoid false signals and these can be drawn on charts with the help of horizontal lines. At times, Pivot points indicator can also be used to plot support and resistance levels based on the previous close price lisinopril online.
Technical analysis is a skill which can only be improved with practice and experience.