Supertrend indicator
A supertrend indicator provides a precise buy or sell indicator in a trending market. Learn the right way of using the supertrend indicator by watching our engaging and easy-to-understand video from the #LearnWithUpstox series.
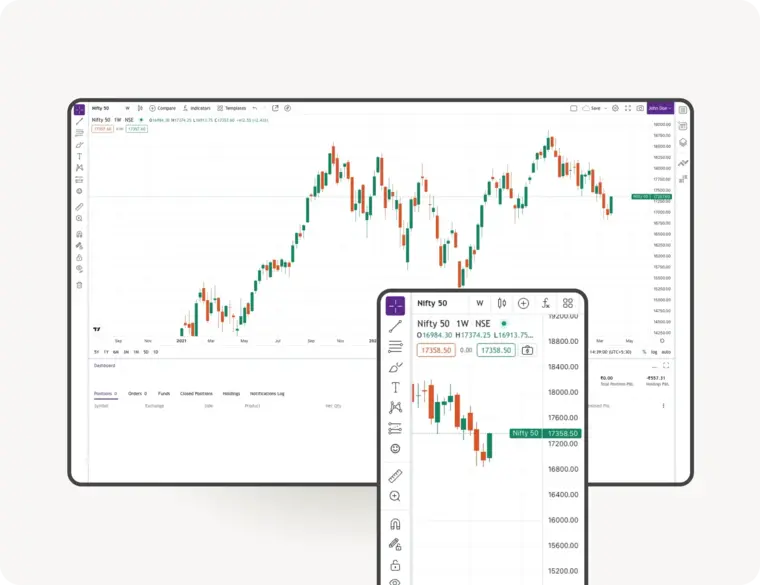
Welcome back to a new blog of ‘Learn with Upstox’. Today we are going to study a simple and famous indicator – Supertrend. As the name suggests this is based on trends. Look at the image given below. You will see a green line below the candles, rising up with it. This is a positive trend, which is bullish, which means it is going up. When it is red and on top of the candle, it is a downtrend, which is bearish.
Supertrend indicator also helps in generating buy and sell signals. When the price is decreasing and the red line is going down beside it. As soon as the price breaks through the red line, it turns green. This is a buy signal.
The sell signal is exactly the opposite. When the price is increasing and the green line is going up beside it, as soon as the price breaks through the green line, it turns red.
To understand what it is technically. You will see in its settings that it is either measured in 10 or 3. 10 is the average date from the candle and 3 is the multiplier. That means when you put the indicator on the chart (refer to the image above), and click on settings, your factor should be 3 and Period should be 10. The 10 period checks the last ten candles' high and low levels average to see how volatile it is. It can also be called ATR (average true range) which shows you the average as per the last 10 days to tell you the range. The factor or multiplier is 3 which means the range over 10 days has been multiplied by 3 which gives you the volatility for movement.
Now look at the chart below. Where the green line is broken is a good place to sell as it becomes red, and where the red line is broken is a good place to buy, as it turns green.
Another thing Supertrend indicator provides is trailing stop loss. Say if your profit was rising but you aren’t selling just yet, the indicator helps to secure your profits through trailing stop loss. If you place your marker at 8,000 if you are at 10,000 profit, when the market hits 8,000 you will know to sell as to save your 8,000 profit, before it becomes zero. Sounds easy, but doing this is quite hard.
Now looking at the chart above we know that we need to buy when the line turns green. Let’s check trailing stop loss on this. But you’ll notice a lot of these breakouts and breakdowns are not passes. Some are fails. So, this can get confusing. Supertrend works better on a daily time frame. The example is from a 15-minute time frame. Also, Supertrend should not be the only indicator you use. It should be used in conjunction with price action or other indicators like RSI, moving average and many more.
Now how do you utilize it, whether you’re a trader or an investor. Let’s use a filter on a daily time frame, and use 50 as the moving average exponential. Now you have two indicators in the chart. Here, you will buy when the price is above 50 EMA, following the Supertrend. When both qualities are there is when we buy. When Supertrend is used along with another indicator, it is preferable to place stop loss based on price action. The same opposite is true for sell. Do not sell till the candle is breaking the 50 EMA line and has a red line, indicating downtrend. This was for Swing traders as it was profits made over months.
For Intraday traders, we will use 200 as the moving average instead of 50. When working on a small time frame chart, use a larger moving average and vice versa. Refer to the image below with a 200 EMA. Here you will need to make a risk reward ratio, make targets, use pivots. Buy when you are above 200 EMA and in an uptrend and when below 200 EMA and in a downtrend, sell. Hold the stock if either of the indicators do not meet these parameters.
So, select your own accompanying indicator and use it with Supertrend for more successful trading. Put your questions in the comments below!