Volatility and The Option Greeks
Introduction to the Option Greek – Vega
Introduction to the Option Greek – Vega
In previous chapters, we have covered two different option Greeks so far: Delta and Theta. The Greeks tell us how much the price of the option is expected to change based on the change in something else. Delta tells us how much the price of the option will change based on the change in price of the underlying. Theta informs us how much the price of the option will change based on time passing and the option getting closer to its expiration date. The next Greek we will cover is ‘Vega’.
Here’s a simple analogy to understand Vega better. If you have ever driven a car (or even sat in one), you should understand this. If you floor the accelerator, the car will zoom ahead. Release the pressure on the accelerator and the speeding car slows down.
The relationship between Vega, Volatility and the Option price is very similar. Any increase in implied volatility leads to an increase in the option price. Conversely, any decrease in implied volatility will result in a reduction in the option price. The quantum of increase or decrease here is Vega. Thus, Vega provides us insights into how much the price of the option will change based on the change in implied volatility. If it is hard to remember what Vega tells us, look to the first letter: V for Vega and Volatility.
What is Vega?
Vega is one of the main option Greeks and is a measure of the sensitivity of an option's price to changes in implied volatility. For instance, if you believe that implied volatility will go up from 31% to 32% (rise by 1%) and the Vega is 0.20, then the price will go up by 0.20.
As a reminder, implied volatility is the market’s expectation of how much the underlying’s price will move. This movement, or volatility, can be up or down – it doesn’t matter. Implied volatility, along with historical volatility, is defined as a percentage greater than 0.
In the lesson on implied volatility, we showed that there is a relationship between implied volatility and the option’s price. The higher the implied volatility, the higher the price and vice-versa. Because of this relationship, you can use implied volatility as a way to deeper how relatively expensive or cheap an option contract is. If you are using implied volatility to identify trading opportunities, Vega can help you assess the risk-reward relationship. So, as an option trader, understanding the impact of implied volatility on an option contract that you own is critical.
What is an example of using Vega?
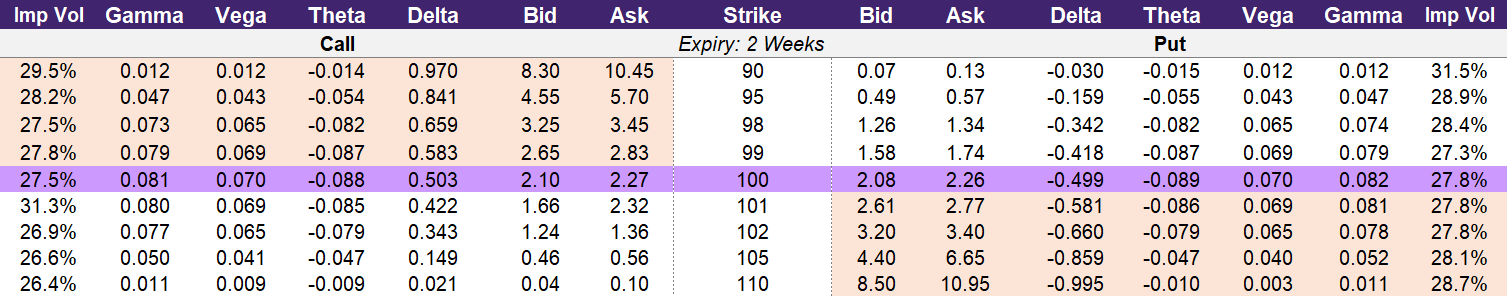
Illustration 1 below is an option chain of a hypothetical stock that is trading at ₹100. The Vega values for the call options are in the column second from the left and for put options is in the column second from the right.
The 102-strike price for the call options is slightly out-of-the-money and can be purchased for ₹1.36. The Vega for this contract is 0.065 which means that for every 1% unit increase in implied volatility, the price of the option will increase by approximately ₹0.065. The implied volatility (IV) is currently at 26.9%. If the IV rises from 26.9% to 27.9%, then the option price will increase to ₹1.43.
Illustration 1: Option Chain Example
 Source: Upstox
How can traders use Vega?
As with stocks, you goal with trading options is to buy-low-and-sell high. In order to do this, traders need to have an “edge” – an advantage in the market that will allow you a better chance at turning a profit. If there is high demand for a particular option contract, that will increase the cost as well as the implied volatility. You can look to implied volatility as a way to identify where there could be overly strong demand. If you believe that this implied volatility (demand) is too high, then you can sell the option. Alternatively, if you believe the implied volatility is too long, you could use that as your signal to buy.
There are a few ways to assess if implied volatility is too high or low. First, you can look to the recent historical volatility. If the implied volatility is substantially different than the historical volatility, there is a chance that it could revert to the historical level. Second, you could view the adjacent strike prices. Usually, the implied volatility will follow a reasonably smooth curve from strike to strike. For instance, the volatility to be 20%, 20.5%, 20.7%, 21%, etc. as you look down the option chain. Where there are unexpected high or low volatility between strike could indicate a mispricing. A caveat is that wide bid-ask spreads could cause this perceived mispricing. Lastly, traders could use a proprietary volatility model that creates a better estimate of implied volatility.
Returning to illustration 2, you can see that the implied volatility for the 100-strike and 101-strike call options is relatively different. One has an implied volatility of 27.5% and one an implied volatility of 31.3%. Assume that you believe that the 100-strike price volatility will converge to the volatility of the 101-strike. Perhaps you believe that traders started buying up the 101-strike but will soon turn their sites to purchasing the 100-strike. The difference in implied volatility between these two contracts is 3.8%. The 100-strike Vega is ₹0.07 which means that for each percent increase in implied volatility, the option will gain ₹0.07. If this contract increases volatility by 3.8%, then the option will rise from ₹2.27 to ₹2.54 (+₹0.266).
How does Vega vary between calls and puts?
With certain option Greeks, like Delta, the value will change signs – positive or negative – depending on whether you are looking at a call option or a put option. For Vega, both calls and puts have a positive value. This means that an increase in implied volatility will lead to an increase in option price regardless if the option is a call or put.
Intuitively, this should make sense because volatility doesn’t have direction. Expected or implied volatility is only concerned with the scale of movement and not necessarily if that movement is up or down. If you are ‘long’ an option, you are implicitly ‘long’ volatility. Any increase (or decrease) in implied volatility will result in an increase (or decrease) in option price. Vega will be negative if you are short an option or option strategy. Therefore, if you are short a call or put, you will have negative Vega. This negative Vega means that an increase in implied volatility will hurt the value of your position. Illustration 2 below summarizes this relationship between the option strategy, Vega, implied volatility, and anticipated option price impact.
Illustration 2
| Strategy | Vega | Implied Volatility (Up) | Implied Volatility (Down) |
|---|---|---|---|
| Long Call | Positive | Option Price ↑ | Option Price ↓ |
| Long Put | Positive | Option Price ↑ | Option Price ↓ |
| Short Call | Negative | Option Price ↓ | Option Price ↑ |
| Short Put | Negative | Option Price ↓ | Option Price ↑ |
How does Vega vary by moneyness for long call and put options?
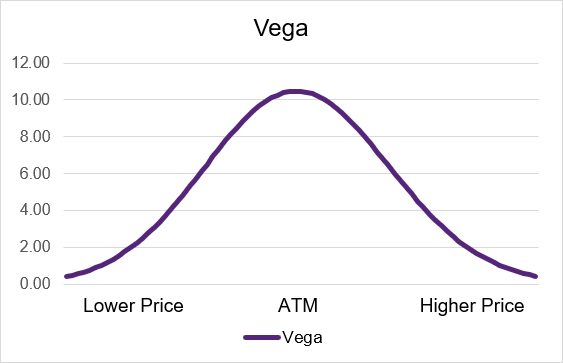
For a long call as well as a long put, Vega will be at the highest level when the option is at-the-money. The further in-the-money or out-of-the-money that an option contract is, the lower the level of Vega. Even though Vega will be lower for options that are in- or out-of-the-money, the value for Vega will still be positive; it will never be negative for a long option.
As a trader, if you want the highest exposure to Vega so that you can benefit the most from an increase in implied volatility, you would purchase an at-the-money option. Illustrations 3 and 4 show the Vega curves for an example set of call and put options. For reference, the example Vega values are on the y-axis and the x-axis represents the underlying price level. A lower underlying price is to the left, the at-the-money price is in the middle, at a higher price is to the right. You can see that the Vega peaks for the at-the-money contract.
Illustration 3: Long Call Theta by moneyness
 Source: Upstox
Illustration 4: Long Put Theta by moneyness
 Source: Upstox
While the values of Vega look the same between calls and puts, they won’t necessarily be exactly equal. If there is a difference in implied volatility between a call and put for a given strike price and expiration date, then there will be a slight difference in Vega.
One noteworthy consideration for managing option trades comes from the difference in Vega between varying levels of moneyness. Assume that you purchase an at-the-money call option with the intent to capitalize on the difference in historical volatility and implied volatility. If implied volatility increases as you expect it to, then the value of the option will rise based on the amount of Vega. If the underlying subsequently starts to rise, which means that you option is in-the-money, the Vega will decrease. Additional increases in volatility will have less of an impact on the option price than when the option was trading at-the-money.
How does Vega vary by moneyness for short call and put options?
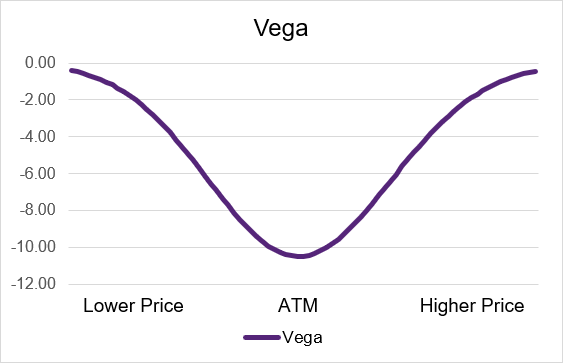
Short call and short put options both have negative Vega. The smallest value, or exposure, for Vega is when the options are deep in-the-money or deep out-of-the-money. Alternatively, the highest negative exposure to Vega is when an option is at-the-money. If you sell an option that is trading at-the-money, it will have more negative Vega than the surrounding contracts.
As the underlying security’s price moves away, either up or down, from the current price, this means that the option contract that you are short will no longer be at-the-money. Once this happens, you will have slightly less exposure to Vega. Illustration 5 and 6 below show the hypothetical relationship between Vega and levels of moneyness. On the x-axis is the underlying price where a lower price is to the left, the at-the-money price is in the middle, at a higher price is to the right.
Illustration 5: Short Call Theta by moneyness
 Source: Upstox
Illustration 6: Short Put Theta by moneyness
 Source: Upstox
How does Vega vary by time for long call and put options?
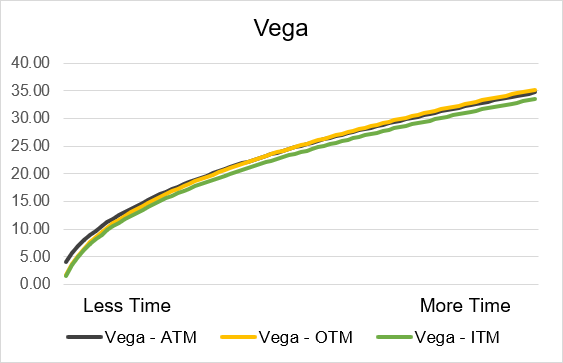
For long call and long put options, there is a positive relationship between time until expiration and the level of Vega. Illustration 7 shows this for call options and illustration 8 shows this for put options. On these charts, we also show how moneyness differs at varying amounts of time until expiry. As you can see, there isn’t much of a difference in an at-the-money, in-the-money, or out-of-the-money contract for a given number of days until expiry. We can generally say that time is equally impactful to the value of Vega regardless of the moneyness of the option contract.
When you have less time until expiry, Vega will be lower than when you have more time until expiration. This is why: if there is more time until expiration, then there is more time for the underlying’s price to move. With more time to move, the greater the potential impact that volatility can have. This is because the higher the level of implied volatility, the even greater the possibility of the underlying to result in a situation where an option is valuable on expiry. More time + more volatility is better for a trader that is buying an option. This ‘benefit’ is accounted for by higher values of Vega when an option is far out from expiry.
Illustration 7: Long Call Vega by Time until Expiry
 Source: Upstox
Illustration 8: Long Put Vega by Time until Expiry
 Source: Upstox
How does Vega vary by time for short call and put options?
The impact of time until expiration on Vega is inverted for short calls and puts as compared to long calls and puts. Short calls and puts both have the most negative Vega when there is substantial time remaining until expiration. So, if you sell a call or a put option with one or several months remaining until expiry, an increase in implied volatility would reduce the value of your position far more than if you had instead sold a contract that was only a few days away from expiry. The intuition behind this is that with only a few days remaining, any change in volatility can’t substantively move the underlying price such that the likelihood of a contract being valuable (or not valuable) on expiry will drastically change. However, with more time until expiry, volatility can play a greater role in a contract be valuable or worthless when it expires. Illustrations 9 and 10 below highlight the relationship between Vega and time until expiration for short option contracts. We also display this for varying levels of moneyness. As you can see, the level of moneyness has minimal impact on the amount of Vega for a given number of days remaining until expiry.
Illustration 9: Short Call Vega by time until expiry
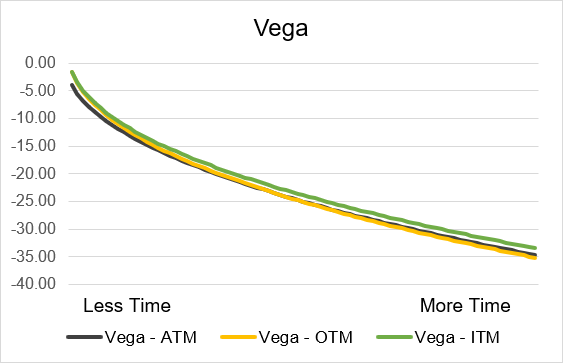 Source: Upstox
Illustration 10: Short Put Vega by time until expiry
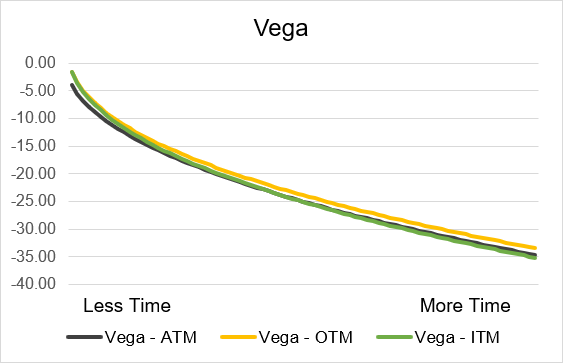 Source: Upstox
Summary
- Use Vega to estimate change in option price due to implied volatility.
- Vega is the same for call and put option.
- Vega is positive when a trader is long a call or put option.
- Vega is negative when a trader is short a call or put option.
- Vega varies according to strike price and expiry.
- Vega varies by time: lesser time to expiry, lesser is the Vega.
- Starting point of volatility also impacts Vega. Higher the starting level of implied volatility, the higher the amount of Vega.
Is this chapter helpful?
- Home/
- Introduction to the Option Greek – Vega