Introduction to the Option Greek – Gamma
Introduction to the Option Greek – Gamma
Imagine you are riding your bicycle and you are pedaling at constant speed. Assuming that you are riding on fairly flat terrain you can use your bike speed to tell how far you can travel in 20 minutes. What if you are in a rush and need to arrive at your destination sooner? To cover more ground faster you pedal harder and your speed increases. The question you want to answer is how much did your time until arrival change based on you pedaling harder? While not a perfect analogy this is similar to the relationship between delta and the next Greek we will discuss – gamma.
What is Gamma?
Gamma is an option Greek and is the only main Greek that is a derivative of another one. Specifically Gamma is associated with Delta. Gamma is a measure that shows the rate of change in delta for every one-unit change in the underlying price. Delta is the rate of change in the option price for each one-unit change in the underlying price. Therefore you can think of gamma as the ‘acceleration rate’ of the option price based on changes in the underlying price movements.
What is an example of using Gamma?
Illustration 1 below is an option chain for a hypothetical stock that is trading at ₹100. Assume you believe that this stock will go up in value and that you want to place an options trade based on this thesis. You decide to buy a call option with a 100-strike price which is the at-the-money strike. This will cost you ₹2.27 to enter because this is the current asking price for this option contract. When you trade options you will want to understand how much the value of your contract will change as the underlying moves. Delta provides you with this information. But what if you want to know how much delta will change as the underlying continues to increase? That is where gamma comes in.
In our option chain gamma for the call options is the first column on the left. For put options gamma is the last column on the right. For our call option with the 100-strike price the current delta is 0.503 and the current gamma is 0.081. Let’s walk through how gamma works.
As the underlying price moves from ₹100 to ₹101:
- The option will approximately increase in value from ₹2.27 to ₹2.773. You calculate this by adding the delta of 0.503 to the option price of ₹2.27.
- As the underlying moves it will also change the delta. Since the underlying went up in price the delta of 0.503 will increase by the gamma of 0.081. The new delta once the underlying moves to ₹101 is 0.584.
As the underlying price moves from ₹101 to ₹102:
- With a new delta of 0.584 any change in the underlying will be worth more than it was previously.
- The current price of our option contract is ₹2.773. If the underlying moves up to ₹102 the option contract will increase in price by the new delta of 0.584. The new option price at ₹102 is ₹3.357.
Illustration 1
 Source: Upstox
How does Gamma vary between calls and puts?
Long calls and long puts both have positive gamma. Alternatively when you sell a call or put you are exposed to negative gamma. What this means is that if the underlying price goes up and you are long an option contract then the gamma will move the delta up. If the underlying price goes down then the gamma will push the delta of your long contract downward.
Here is how to think about gamma intuitively. Looking back to our lesson on delta we discussed that delta can be used as a proxy to understand the market’s implied likelihood of that particular strike being in the money on expiration. For example if a call option has a delta of 0.55 and a gamma of 0.10 then the market’s implied likelihood of being in the money on expiry is 0.55 or 55%. Now assume that the underlying security moves up in price by 1 unit. This means that the option contract will now have a delta of 0.65 (0.55 + 0.10). This option will have a market implied likelihood of moneyness of 0.65 or 65%. It is logical that this contract now has a higher likelihood of being in the money on expiry because the underlying has moved upwards in your favor.
To summarize the impact of gamma on delta we have provided a quick summary in illustration 2 below.
Illustration 2
| Underlying Price | Strategy | Gamma | Up | Down |
|---|---|---|---|---|
| Long Call | Positive | Delta ↑ | Delta ↓ | |
| Long Put | Positive | Delta ↑ | Delta ↓ | |
| Short Call | Negative | Delta ↓ | Delta ↑ | |
| Short Put | Negative | Delta ↓ | Delta ↑ | |
| Source: Upstox |
How does Gamma vary by moneyness for long call and long put options?
Gamma is a positive value for both long call and long put options. This means that if the underlying price goes up then gamma will push the delta upwards. If the underlying price goes down then gamma will move the delta downwards. If the delta is higher (lower) then it will have a greater (lesser) impact on the option price in the future.
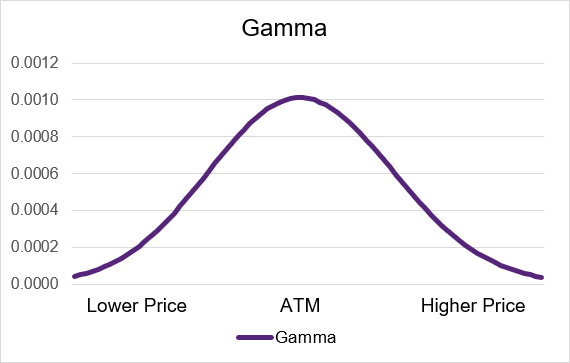
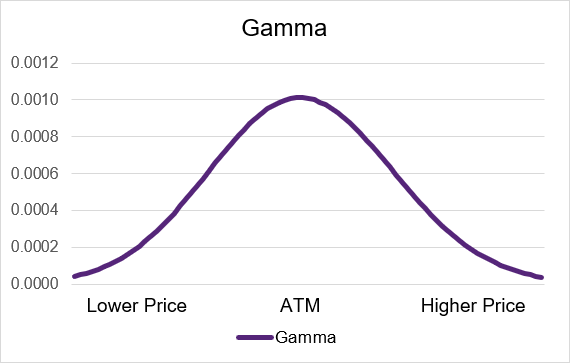
As the option contract moves out-of-the-money or in-the-money the gamma will decrease. If the option is deep in- or out-of-the-money then it will be very small or near zero. Gamma will have the greatest impact on delta and the option price when the option contract is trading at-the-money. Illustrations 3 and 4 below show example gamma curves for long option strategies.
Illustration 3: Long Call Gamma by moneyness
 Source: Upstox
Illustration 4: Long Put Gamma by moneyness
 Source: Upstox
How does Gamma vary by moneyness for short call and short put options?
Short call and short put options behave in the opposite way of long call and puts. Both short calls and puts have negative theta exposure – if the underlying price goes up then gamma will move the delta downwards. Conversely if the underlying price goes down the delta will move up due to gamma.
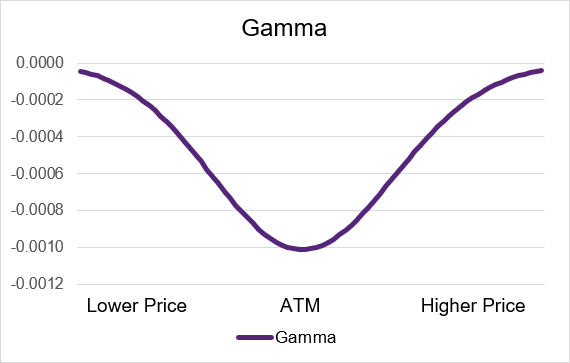
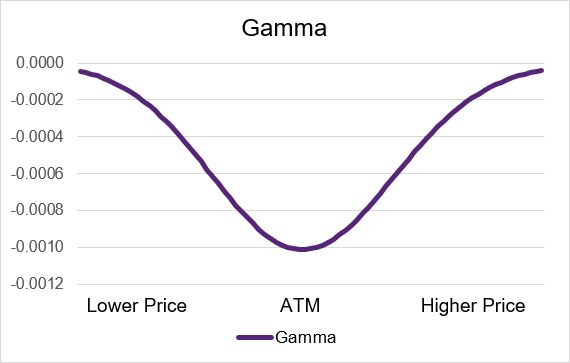
Gamma has the most impact to the delta and option price of a short option contract when it is trading at-the-money. As the option contract moves out-of-the-money or in-the-money the gamma will become less negative and move towards zero. If the option is deep in- or out-of-the-money then it will be very small or near zero. Illustrations 5 and 6 below show example gamma curves for short option strategies.
Illustration 5: Short Call Gamma by moneyness
 Source: Upstox
Illustration 6: Short Put Gamma by moneyness
 Source: Upstox
How can traders use Gamma?
From a practical perspective gamma is usually most watched by professional traders or market makers as they look to hedge option positions with the underlying equities by using delta. Since these market makers are critically focused on delta they need to monitor gamma closely since it gives them insights into changes in delta.
On a day-to-day basis gamma shouldn’t drastically impact your trading. However if you are trading an option on expiration day (or the day before expiry) gamma can significantly impact your P&L of your trades. This is especially the case if the option you are trading is close to being at-the-money and if the underlying is having a particularly volatile day. In this way gamma can be like theta where this Greek can determine your success likelihood.
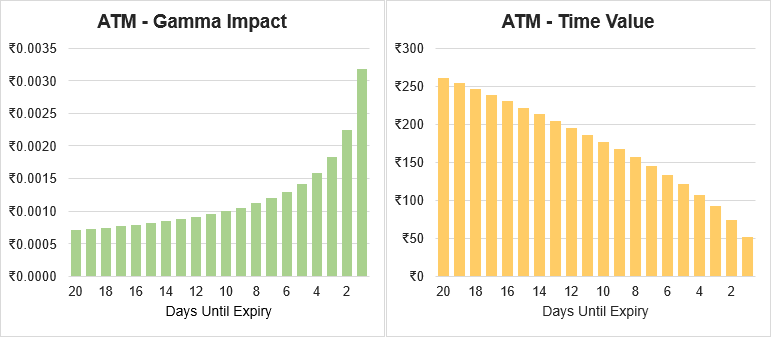
If you are long an option contract gamma is positive but theta is negative. As you get closer and closer to expiry gamma will become exponentially more positive while theta will exponentially become more negative. When you decide to trade near expiry and the position isn’t working out for you there is a distinct trade-off between gamma and theta. Gamma will be higher which will make it easier to potentially turn a profit. Of course if the underlying moves against you then it will be just as easy to move further away from breaking even. With this potential for larger moves comes the trade-off of time decay. You option will be worth less due to theta.
On the other hand if you are short an option contract you will have negative gamma exposure and positive theta. You will be hoping for the contract to expire worthless and time decay makes this easier. The closer to expiry the more exponential the time decay which is very favorable situation. However you run the risk of being impacted by gamma. Any move the underlying makes – particularly if the option is trading near the money – will have a greater impact on the option’s price due to gamma.
Illustration 7 below shows this. On the left is the gamma impact for an example long call. On the right is the time value of the option. The x-axis for both charts is the days until expiry from 20 days until 1 day. As you can see the Gamma increases exponentially as expiration nears. Conversely time value decreases exponentially as expiration approaches.
Illustration 7
 Source: Upstox
The “moral” of this example is that there is ‘no free lunch on Wall Street’. While selling an option near expiry and awaiting the rapid time decay may seem like an easy win there are distinctive risks in the form of gamma that should be accounted for.
How does Gamma vary by time for long call and long put options?
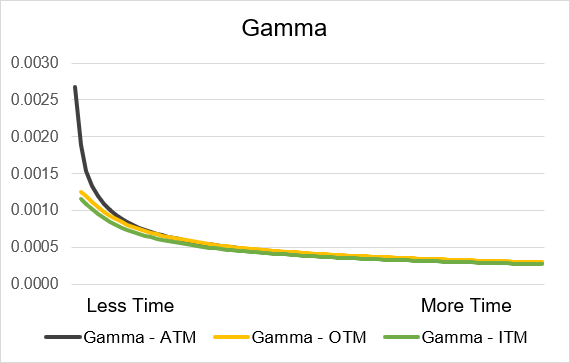
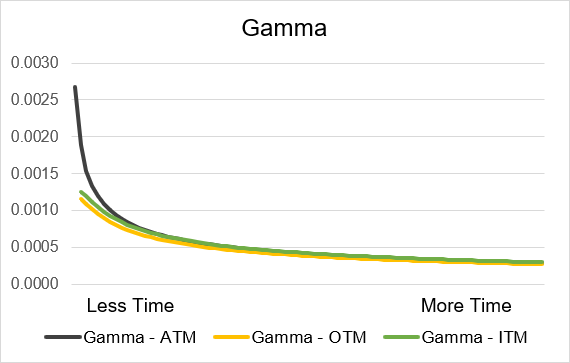
Time until expiration is a critical factor when considering the impact of Gamma on an option’s delta and price. For both long calls and long puts gamma will have a positive effect on delta. This means that if the underlying price increases (or decreases) then gamma will move the value of delta upwards (or downwards). Gamma is always positive for long calls and puts but the amount of impact varies significantly based on time until expiration. As expiration approaches gamma will exponentially increase. Gamma will be the highest on the expiration day and the week prior to expiry will see the greatest increases in gamma. If you are further away from expiration then gamma will be lower and will change less day to day. Illustrations 8 and 9 display the gamma curves. As you can also see gamma for at-the-money contracts increases far more than contracts that are in- or out-of-the-money.
Illustration 8: Long Call Gamma by time until expiry
 Source: Upstox
Illustration 9: Long Put Gamma by time until expiry
 Source: Upstox
How does Gamma vary by time for short call and short put options?
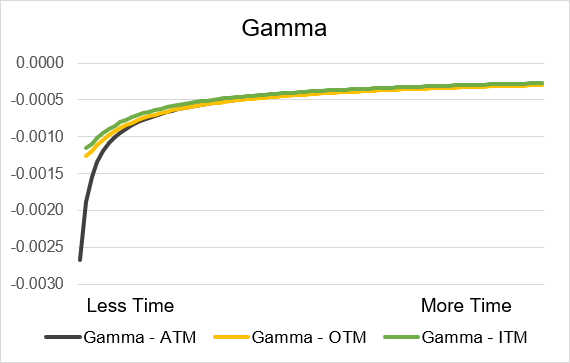
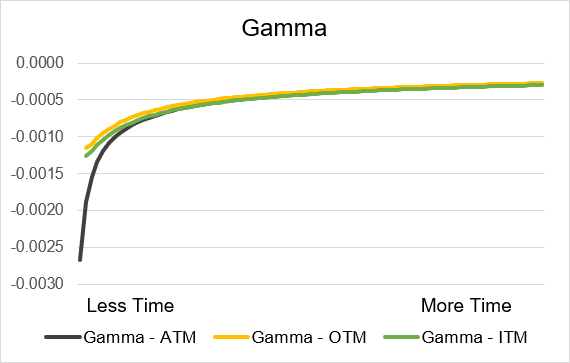
When you trade short calls and short put options you will be exposed to negative gamma. Negative gamma leads to a decrease in delta values when the underlying price rises. Alternatively negative gamma has the effect of increasing delta when the underlying price falls. Gamma isn’t constant and will change as other parameters like volatility change. However time until expiry has the greatest impact on the level of gamma. When a short option contract is far away from expiration gamma will have minimal impact on delta and the option price. However when expiry is near gamma will have a large impact. As expiration gets closer gamma will have exponentially more impact. This is similar to how theta works where contracts closer to expiry have exponentially more time decay. Illustrations 10 and 11 show example gamma curves for short calls and short puts respectively. As you can see at-the-money options will have more gamma when expiry is near as compared to in-the-money or out-of-the-money contracts.
Illustration 10: Short Call Gamma by time until expiry
 Source: Upstox
Illustration 11: Short Put Gamma by time until expiry
 Source: Upstox
Summary
- Gamma is the rate of change of delta for a one-unit change in the underlying.
- Use this to see by how much the option price will change with for every unit increase in the price of the underlying.
- Values of gamma are smaller than delta, theta, and Vega.
- Gamma increases as strike price moves from out-of-the-money to at-the-money.
- Gamma decreases as options become more in-the-money.
- Gamma values for calls and puts are the same.
Is this chapter helpful?
- Home/
- Introduction to the Option Greek – Gamma