Volatility and The Option Greeks
Introduction to Implied Volatility
Introduction to Implied Volatility
Before we dive into implied volatility, here is an analogy to this concept. What if you are planning an outdoor party and you have invited a large number of guests. However, you are uncertain as to how many guests will actually show up. If the weather is great, most of them will come to the party but if the weather is raining, then far fewer will come. Since you don’t want to over or under purchase food, then you need to make a weather forecast. If you believe that the weather will be pleasant, then your party will cost more due to needing to buy more food. The party will be less expensive if the weather is poor because fewer people will attend and you won’t need as much food. Weather in this case is similar to implied volatility. Weather in our example determines the cost of the party. Similarly, implied volatility helps determine the cost of an option contract.
Review of Intrinsic and Extrinsic (Time) Value
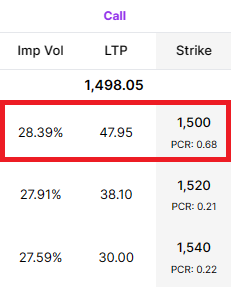
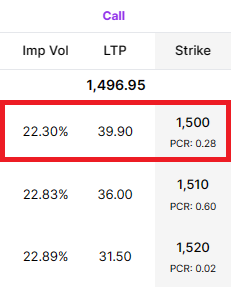
In a prior lesson, we looked at option contracts for Infosys and Cipla. Illustration 1 below has data from their respective option chains. Let’s first look at the intrinsic value. The intrinsic value represents the amount by which the option is currently profitable if expiry were to happen immediately. In other words, it is the difference between the current market price of the underlying asset and the option's strike price for both call and put options. When an option has intrinsic value, it is said to be “in-the-money”. The intrinsic value of an option is a measure of how much the "in-the-money" component is of the option's total value.
The formula for calculating intrinsic value depends on the type of option—whether it is a call option or a put option. For Call Options, if the underlying asset is above the call strike price, the option will have intrinsic value. If an option has intrinsic value, it is known as being “in-the-money”. This is the formula to calculate the amount of intrinsic value for a call option:
- Intrinsic Value of Call Option = Current Market Price of the Underlying Asset − Call Option Strike Price
- If the result is positive, it indicates that the call option has intrinsic value. If the result is zero or negative, the call option is considered "out-of-the-money."
For Put Options, if the underlying asset is below the put strike price, the option will have intrinsic value. This is the formula to calculate the amount of intrinsic value for a put option:
- Intrinsic Value of Put Option = Put Option Strike Price − Current Market Price of the Underlying Asset
- If the result is positive, it indicates that the put option has intrinsic value. If the result is zero or negative, the put option is considered "out-of-the-money."
Let’s calculate the intrinsic value of the call options for Infosys and Cipla:
- Infosys: The greater of 0 or 1498.05 – 1500 = 0.
- Cipla: The greater of 0 or 1496.95 – 1500 = 0.
Illustration 1
| Infosys | Cipla |
|---|---|
 |  |
An additional consideration is that intrinsic value is only one component of an option's total premium. The other component is extrinsic value, also known as time value, which reflects the potential for the option to gain additional value before expiration due to factors like time decay and implied volatility. On expiration, time (extrinsic) value will always be zero. The formula for time value is the same for both call and put options. It is: Option Price – Intrinsic Value.
Using the data from illustration 1, these are the calculations to determine the extrinsic values for Infosys and Cipla.
- Infosys: 47.95 = 47.95 – 0
- Cipla: 39.90 = 39.90 – 0
Also as discussed in the prior lesson, the reason for the difference in option premia between these two option contracts is implied volatility. Implied volatility has no effect on an option’s intrinsic value. The only drivers of intrinsic value are the underlying price and the strike price of the option contract. There are two drivers of extrinsic value: time and implied volatility. The more time until expiry, the higher the extrinsic value. If you have trouble understanding this concept, all you have to do is remember: “time equals money”. However, all time isn’t equal – the higher the implied volatility, the more valuable the time.
This is seen in our example above where both options have the same time until expiration but radically different time values. Let’s dive deeper to understand the mechanics behind this.
Understanding Implied Volatility
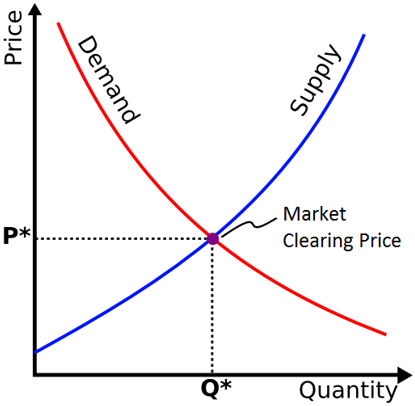
For any product or service, there will be a demand-and-supply relationship that impacts price. Around the world through the pandemic, supply chains were negatively impacted resulting in shortage of goods ranging from toilet paper to furniture to computers. Since demand for these goods didn’t reduce, this led to a spike in prices for these goods.
Even more recently in 2022, the continued impact of the pandemic in combination with the war in Ukraine led to a reduction in supply of gas. Since demand didn’t change, and in some cases went up due to the desire to travel again, the price of fuel skyrocketed. Had the reverse happened, where fewer people demanded the product but many were selling it, the price would have dropped.
On any given day in the market, this is what happens to stocks. If there is great interest in a security and few are willing to sell, those that are willing to sell are able to command a higher price. On slow, uneventful days, stocks move little and are considered to be at the ‘market clearing price.’
Illustration 2
 Source: Upstox
As we’ve discussed with options, there is a relationship between the option price and the underlying stock or index price: the intrinsic value. If a stock or index moves up in price, then the price of the option will go up. But this only describes the mechanical relationship between the underlying and the option. There are separate market dynamics of supply and demand that directly impact the option itself.
For example, 100 people may wish to purchase a stock, but only 50 are selling, thus driving the price of the stock upwards. While the option price will rise because of this stock price movement, it could rise further if there is an added supply-demand imbalance. Perhaps 100 people wish to purchase a particular expiration-strike call option, but only 10 wish to sell. This would drive the price of the option even higher than what the change in the stock price would justify.
So, what does this mean? Implied volatility is a “plug”. As a trader, you can select the underlying, strike price, and expiration date. Once you select these, the market determines the underlying price and interest rates on an ongoing basis through the life of the option contract. Time also ‘marches on’ and time until expiry will continue to be lower as the expiration date nears. You can observe the price of an option contract and make a determination as to whether or not to purchase it. This only leaves implied volatility which is an artifact of the current market price for the option as well as the other factors listed (underlying price, strike price, etc.).
How does volatility impact an option’s price?
When we first introduced call and put options, we highlighted that these are contracts with specific, pre-defined terms including the underlying security, strike price, and expiration date.
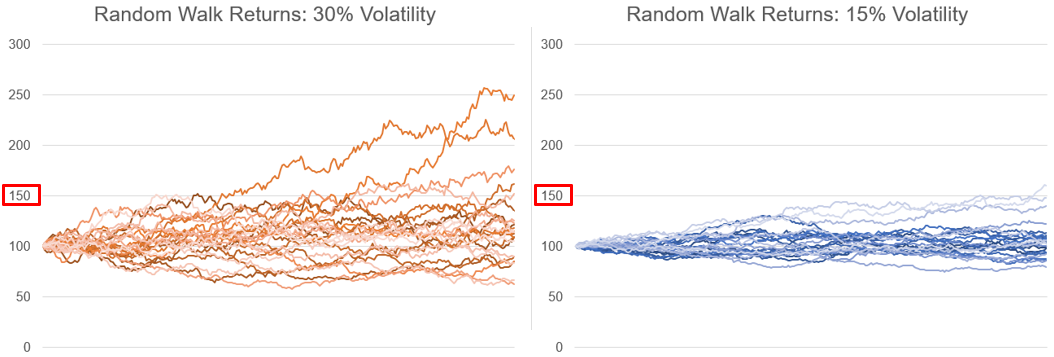
There are two variable components that also can impact the option’s price: the underlying security’s price and the volatility of the underlying security. As we reviewed in the chapter on Time Value and Intrinsic Value, the more volatile a security, the more valuable it could potentially be. Here is another illustration in the two side-by-side charts below. These two charts plot what is known as a random walk, or a simulated stock price movement. In each chart, there are 25 iterations of random stock price movements over a one-year period.
In illustration 3 below, the chart on the left simulates a stock that has a 15% annual volatility while the stock on the right has a 30% annual volatility.
- The range of outcomes for the simulated stock with 15% volatility is between 79 and 160 with a median value of 104.
- The range of outcomes for the simulated stock with 30% volatility is between 63 and 250 with a median value of 114.
If we were interested in outcomes greater than 150, the stock with a volatility of 30% would have a greater chance of achieving this. In these limited simulations, the virtual stock with lower volatility achieved a price of more than 150 in only 1 of 25 iterations. However, the virtual stock with the higher volatility exceeded this price point in 5 of the 25 iterations.
So, the supply-and-demand dynamics that play out through options trading can be implied through volatility. If more traders wish to buy an option than sell, this implicitly means that these traders looking to purchase believe that there is a favourable future outcome associated with this option. In order for that to happen, the volatility would need to be higher. This drives the price of the option upwards.
Illustration 3
 Source: Upstox
Interpretation of Implied Volatility
For implied volatility, you don’t need to calculate anything; you only need to look to the Option Chain. As we’ve discussed, the implied volatility is the market’s expectation of future volatility. It is based on the supply-demand relationship for the option. If there are more buyers of an option than sellers, the option price will go up as well as the implied volatility. Conversely, if there are more sellers than buyers of an option, the option price will go down along with the implied volatility.
The implied volatility for options as seen in an options chain is the annualised volatility – if you want to use this to estimate different timeframes, you would need to convert it as we have discussed in a prior lesson. Looking back to illustration 1, Infosys’ implied volatility is 28.39%. The market is implying that it expected the volatility, or standard deviation, for this company will by ±28.39% over the next year. As a trader, if you believe that Infosys will be less volatile than 28.39%, then you should sell the option because it is overpriced. Alternatively, if you believe that Infosys will be more volatile, then you should buy the option because it is underpriced. In this way, implied volatility is like fundamental analysis metrics like the P/E ratio. It can help you determine if an option is “a good deal”.
- Implied Volatility (IV) can be used as an indicator of whether an option contract is over- or underpriced. If you believe that IV is too high, then you could sell the option contract because it is too expensive. If you believe that IV is too low, then you could buy the option contract because it is too cheap.
- If you sell an option due to overpriced volatility and IV falls, then the value of the option will fall allowing you to profit. Conversely, if you buy an option because you expect IV to rise and higher volatility is realized, then the value of the option will rise.
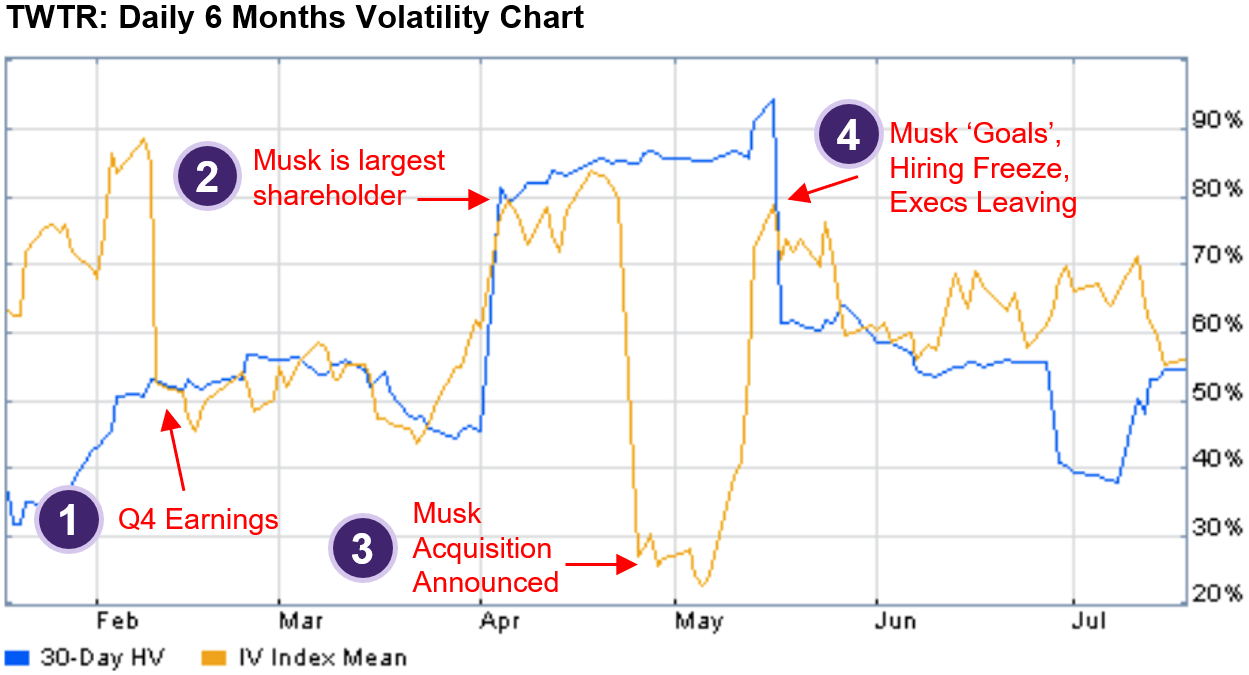
Another way to think about Implied volatility shows how uncertain the market is about a particular security. Illustration 7 below shows the historical and implied volatility of Twitter. The blue line is the trailing 30-day historical volatility. The yellow line is the average implied volatility across all of the options for Twitter that expire in 30-days. This chart shows this for approximately the first half of 2022.
As you can see, implied volatility does not always equal historical volatility. In this chart, one line is looking 30-days back while the other is what the market is ‘thinking’ about in terms of 30-days into the future. There are four points that are illustrative of this ‘thinking’.
- The first highlighted point is near the first week of February. The implied volatility climbs throughout the end of January and on a single day, drops from almost 90% to 50%. This was due to the Q4 earnings. Implied volatility rose as there was uncertainty as to the contents of the earnings release. Once that information was released, then the uncertainty of the information reduced dramatically. For reference, this is a common phenomenon associated with implied volatility around earnings announcements.
- At the second highlighted point, there is a spike in volatility from 45% to 80%. This movement in implied volatility happens within 1-2 weeks. This occurs when there was information leaked and then eventually confirmed, that Elon Musk had acquired a substantial amount of Twitter stock. Implied volatility went up because there was uncertainty as to what Musk’s intent with Twitter was.
- At the third highlighted point, you can see a reduction in implied volatility from 80% to 30%. This is when it was announced that Musk was planning to acquire Twitter. This reduced the uncertainty due to his acquisition of Twitter shares.
- Lastly, the fourth highlighted point shows an increase from 25% to 80% implied volatility. This occurred following the release of Musk’s goals for the company, an announcement of a hiring freeze, and news that several executives were departing. This information created uncertainty in the market in terms of Musk’s management of Twitter, its financial strength, and its ability to attract and retain talent.
Illustration 4
 Source: ivolatility.com
Summary
- Two variable components impact the price of an option: the underlying security’s price and its volatility.
- Higher implied volatility results in higher option prices.
- The more volatile a security, the more valuable it can be.
- Options with more time until expiration have more time value.
- Implied volatility helps traders assess whether an option is overpriced or underpriced.
- Implied volatility reflects market uncertainty about a particular stock or index.
Is this chapter helpful?
- Home/
- Introduction to Implied Volatility