Introduction to Historical Volatility
Introduction to Historical Volatility
When index or stock returns are discussed, sometimes the term ‘volatility’ arises. There are two types of volatility: historical volatility and implied volatility. Sometimes historical volatility is referred to as realized volatility, and implied volatility is referred to as expected volatility.
If you remember our commute example in the last lesson, we used standard deviation to calculate the range of possible values of our daily commute. Similarly, we can do that for the returns of an index or scrip to see the range of possible values for a given day, month, year, or any other timeframe.
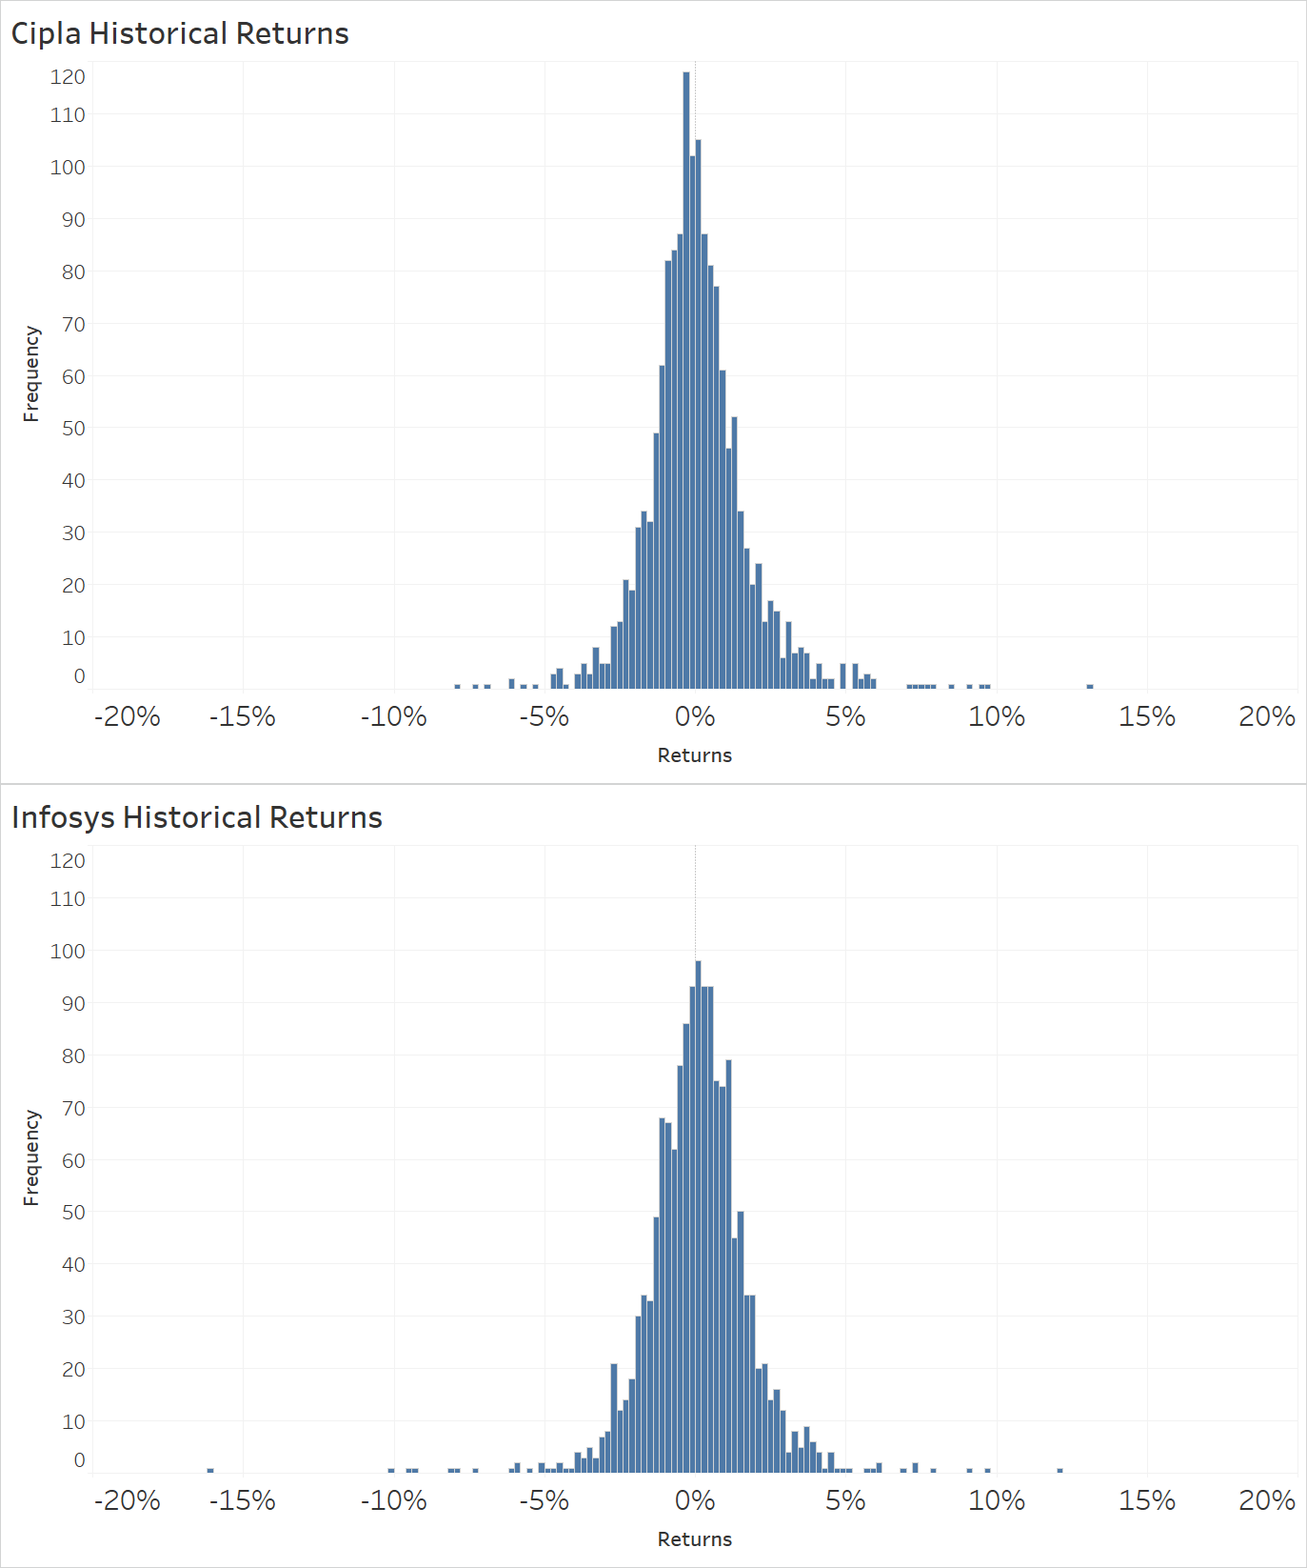
Let’s look at two companies that are listed on the exchange and have options available for them. These are the daily historical return distributions for Infosys and Cipla over the past 5 years (2018 through 2023). As you can see in Illustration 1 below, there is a subtle difference in returns. While both companies seem to have their daily returns centered around 0%, Cipla appears to have returns that are closer together, while Infosys appears to have a wider distribution of returns.
Illustration 1
 Source: Upstox
As a reminder, we can use Excel to calculate the average or mean of returns as well as the standard deviation.
Key Formula:
- Standard Deviation Excel Formula: = STDEV.S(range of values)
- Average Excel Formula: = AVERAGE(range of values)
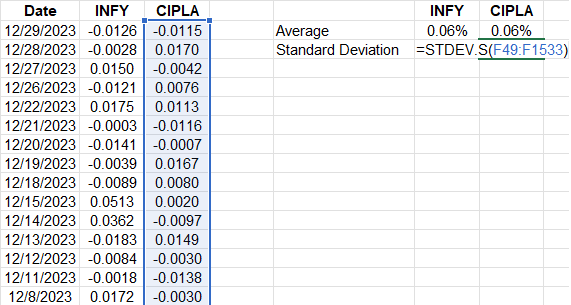
We calculated these values for Infosys and Cipla and confirmed what we visually determined in Illustration 1. Both companies have the same average daily return of 0.06% over the past 5 years. However, Infosys has a 27% higher standard deviation – 2.17% vs. Cipla’s 1.71%.
Illustration 2
| INFY | CIPLA | |
|---|---|---|
| Average | 0.06% | 0.06% |
| Standard Deviation | 2.17% | 1.71% |
Why is historical volatility important for trading?
Understanding the historical volatility of an index or scrip allows us to understand the potential for downward or upward price movements. With this information, we can better manage risk if we own the scrip or get a better idea of the potential for profitability of a particular option-strike-expiration combination.
If a scrip has low historical volatility, we can generally assume that downside risk isn’t as much as for a scrip with high historical volatility.
Similarly, if we are considering buying an option and the index has had low recent historical volatility, we may use this information to make an assumption about future volatility. This could allow us to gauge the likelihood of the option ending in-the-money at expiration.
Converting volatility into different time periods
When you calculate the standard deviation, or historical volatility, for historical index and stock returns, that standard deviation is associated with the time period of that measurement. In illustration 3 below, we have recorded daily returns of Infosys and Cipla. When we use the Excel formulas to the mean and historical volatility (standard deviation), we get the 0.06% for the mean and 2.17% for Infosys’ standard deviation and 1.71% for Cipla’s standard deviation. These values represent the movements for a day. What if you wanted to know how much these stocks could move over the course of a year using this data? If we want to view this data for a year, we can annualize. We can similarly convert the data into other time periods like a week, month, or quarter. Also, if we have the historical data on a monthly basis – or any other time frame – we can use this same framework to convert to shorter time periods like weeks or days.
To convert daily historical volatility into annualized volatility, we would multiply by the square root of 252. For Infosys, with a daily standard deviation of 2.17%, we would multiply 2.17% by √252. We do this by ‘252’ because this is the approximate number of trading days in a year.
Illustration 3
 Source: Upstox
Here’s how to convert between different time periods:
- Daily Volatility into Annual Volatility: Daily Volatility × √252
- Weekly Volatility into Annual Volatility: Weekly Volatility × √52
- Monthly Volatility into Annual Volatility: Monthly Volatility × √12
- Annual Volatility into Daily Volatility: Annual Volatility ÷ √252
- Annual Volatility into Weekly Volatility: Annual Volatility ÷ √52
- Annual Volatility into Monthly Volatility: Annual Volatility ÷ √12
Why is historical volatility important for option pricing?
There are several components to an option contract. These are the underlying security, the strike price, and the expiration date. Option prices are modeled using sophisticated pricing models including the Black-Scholes Option Pricing model. There are several market parameters that will drive the option’s price including the underlying security’s price, the time until expiration, interest rates, and implied volatility. We will get more into each of these in additional lessons but let’s quickly introduce why historical volatility and implied volatility are important for options pricing.
As discussed, standard deviation is the same as historical, or realized, volatility. They are backward-looking measures in that they are calculated using past data. Implied volatility is forward-looking volatility. Implied volatility is also known as expected volatility. Let’s look at a quick example.
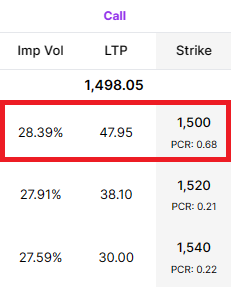
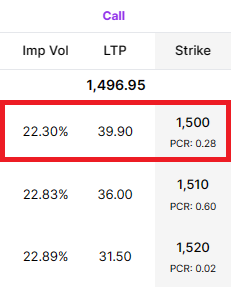
In illustration we show some data from the option chain of Infosys and Cipla. As you can see, both securities are trading at nearly the same price. At the time of this snapshot, both option contracts highlighted in red had approximately one-month until expiration. These also have the same strike price. You can see that the Infosys option contract is priced at ₹47.95 while the Cipla contract is priced at ₹39.90. With the underlying price, strike price, and time until expiration being the same, why is the INFY option contract priced so much higher? The reason is implied volatility.
The implied volatility, or IV, is currently 28.39% for Infosys and 22.30% for Cipla. If you remember, the historical volatility for Infosys was 27% higher than it was for Cipla. Coincidentally, the implied volatility for Infosys is also 27% higher than for Cipla. This means that traders are expecting Infosys and Cipla to be similarly volatile as it has been in the past. As we will learn in the next chapter, higher expected or implied volatility leads to higher option prices. What this also shows is that traders are using historical volatility to make a forecast about future volatility.
Illustration 4
| Infosys | Cipla |
|---|---|
 |  |
Summary
- Historical volatility is the standard deviation of security returns.
- Historical volatility is also known as realized volatility.
- Historical volatility is a backward-looking measure.
- Future volatility is a forward-looking measure, known as implied volatility or expected volatility.
Is this chapter helpful?
- Home/
- Introduction to Historical Volatility