Understanding Strategy Outcome Distributions
Not all trading strategies are built or perform equally. Perform we dive into the lesson, let’s imagine a hypothetical daily commute to work. Maybe you could choose to take a highway or local street to the office. The highway will be congested and slow but you will continually move. While this route takes you out of the way and will take longer on average, your drive will be mostly on ‘auto-pilot’. You don’t have to think much and your daily commute will almost always take the same amount of time. On the other hand, the local route will have a dozen or more stop lights and sometimes there are accidents which slows things down even more. While this approach is shorter in distance, it is highly inconsistent. Usually, it will take longer than the highway route but sometimes it will be faster. On a few rare days, there is little traffic and you will make every single green light and your commute is vastly quicker. The end result of either route is the same – you safely arrive at the office.
Similarly, your end result in trading is to be profitable overall. Since it is impossible to be profitable with every single trade, your trading strategy will differ in how you reach that level of overall profitability. A necessary component of managing risk is understanding your trading strategy’s return distribution. It doesn’t have to be exact, but you should understand how it performs. In these next two examples, hopefully this will become clear.
##Example 1: Normal Distribution Strategy
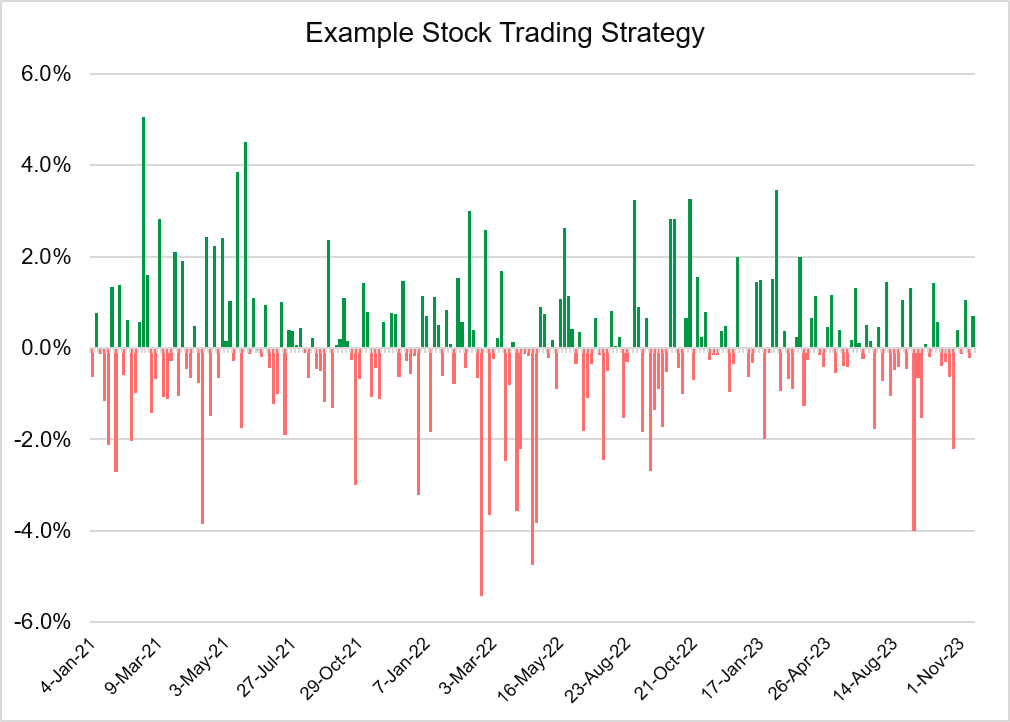
Imagine that you decide to trade stocks intraday. Your strategy is a reversal one – you look at yesterday’s returns to determine if you place a trade or not. Specifically, if the stock is down by more than 0.5% yesterday, you place a buy order and hold it for one day. If the stock is up or down less than 0.5% on the day prior, you don’t enter into a trade the next day. This is the outcome of this strategy over a three-year period; the green bars are positive daily returns and the red bars are negative daily returns.
Illustration 1
 Source: Upstox
The vertical axis is the magnitude of the daily return and ranges from -6% to +6%. As you can see, there are roughly the same number of green bars as red bars. This table shows some select trade metrics for this strategy. The win rate, or the percentage of trades that were profitable, is 48%. The average trade return is +0.1% with a max and min return range of -5.4% to +5.1%. Overall, a strategy with a return distribution like this is a reasonable one to execute. Before implementing, you would want to see if the distribution could be made even more favorable by more selective targeting. If you could get the win rate slightly higher than 50% and either increase the max win amount or reduce the max loss amount, this could be a decent systematic trading strategy.
Illustration 2
| Trade Metrics | % |
|---|---|
| Win Rate | 48% |
| Max | +5.1% |
| Min | -5.4% |
| Avg | +0.1% |
Example 2: Skewed Distribution Strategy (“The Lottery Ticket”)
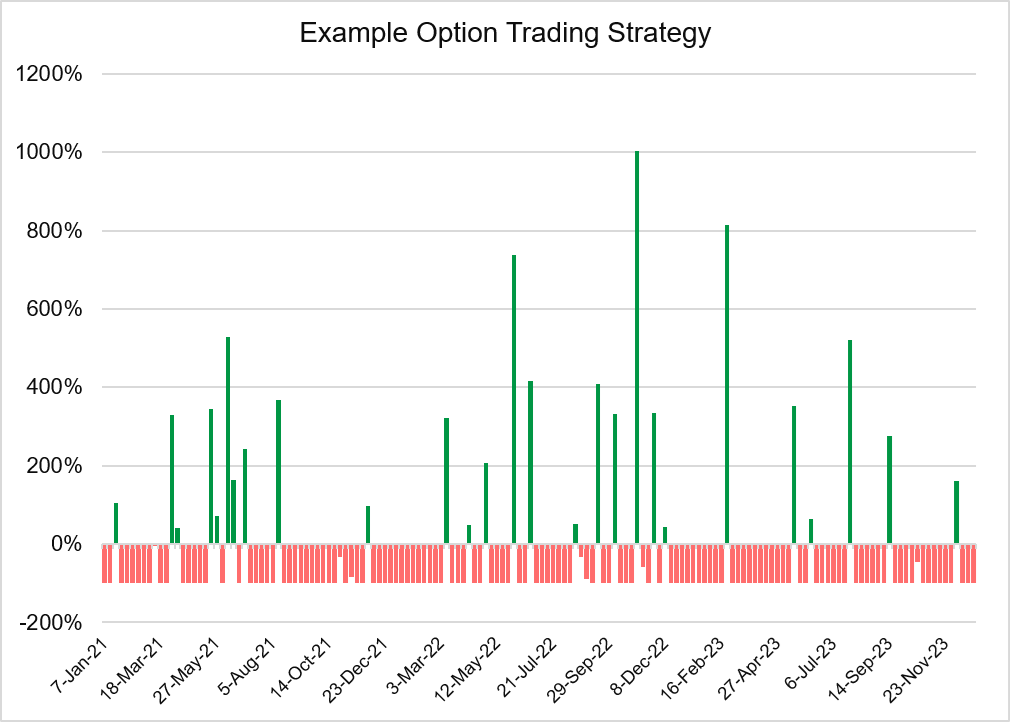
Let’s turn to our second example trading strategy. This one is an options strategy. You decide that you will purchase a call option on the Nifty the day prior to expiry and hold through expiration. The call option that you purchase will be out-of-the-money. This means that the Nifty needs to rise from its current price to reach the out-of-the-money strike price. It also needs to rise enough beyond that strike price to cover the option’s premium that you paid to buy the call.
This illustration shows the daily returns of the options strategy. As you can see, there are a lot more red bars, or losing trades, with this strategy than the prior one. There is a crucial difference though: the vertical axis doesn’t range from -6% to +6%; it ranges from -100% to +1000%. This strategy has a return, or outcome, distribution that is likely far too risky. You can think of this strategy as one that “swings for the fences” or a “lottery ticket” – you could get lucky but most likely you will lose.
Illustration 3
 Source: Upstox
This table shows some of the trade metrics for the options strategy. The win rate is far lower than the stock strategy. However, your max gain is over 10x but your average return for this strategy is nearly -27%. If you happen to get lucky and pick one of the few trades that return multiples on your capital, you could do well. More realistically though, you will end up with a loss over time.
Illustration 4
| Trade Metrics | % |
|---|---|
| Win Rate | 17% |
| Max | +1,001.8% |
| Min | -100.0% |
| Avg | -26.7% |
Example 3: Another Skewed Distribution Strategy (“Pennies in Front of a Steam Roller”)
We’ve covered two return distributions so far:
- One that has roughly the same number of winning and losing trades where the return amounts of the winners and losers is also fairly similar.
- One that has far more losing trades than winning trades but the winners have returns that far outweigh the returns of the losing trades.
As you build out your trading strategy, there is another type of strategy distribution. This one is actually very favorable but you have to be careful. With this strategy, you have frequent wins – perhaps 70% or higher win rates. With these types of strategies, you will often have very low returns on winning trades. What you need to be cautious of is how much you could potentially lose when the trade doesn’t go your way. Imagine this: you win 9 trades in a row and each one delivers a 2% return on your capital. On your 10th trade, you suffer a loss of 30%. You don’t want to be in a situation where you give up all of your gains with a few or one losing trade.
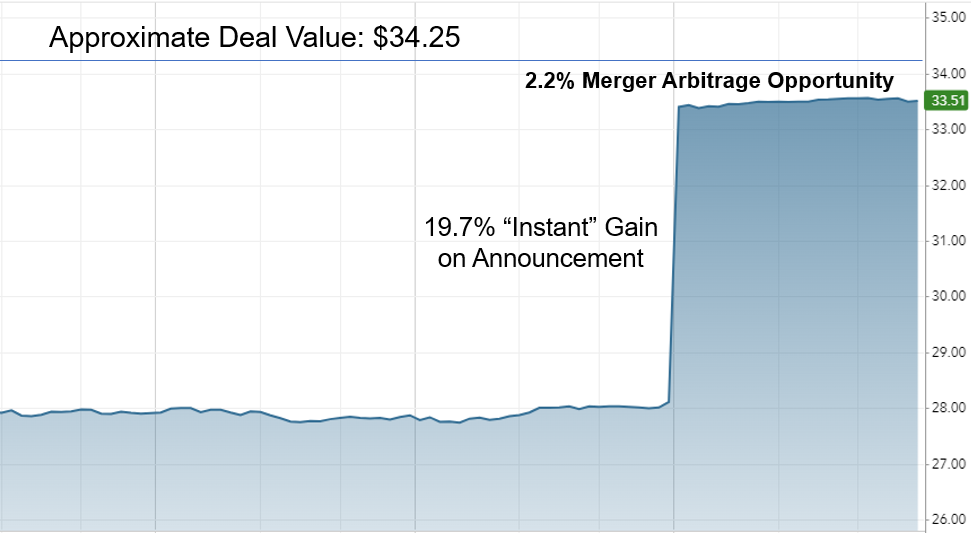
A trading strategy that has a high win rate, low positive return when you win, and an extremely large negative return when you lose is sometimes called “picking pennies in front of a stream roller”. Grabbing a few rupees may not be worth the risk unless you manage the downside well. Here is a trading strategy, often used by hedge funds, that is commonly known as a real version of “pennies in front of a steam roller”.
It is called Merger Arbitrage. When a company announces that it will acquire another company, the acquiring company will pay a substantive premium for the target company. Sometimes this premium is 20%, 40%, or higher. On announcement, the price of the target company immediately shoots upward. But it doesn’t go all the way to the price offered by the acquiring company. The difference in the market price and the offered price by the acquirer is known as the “spread” or merger arbitrage opportunity. In this example, the target company’s price rose from 28 to 33.51, a gain of nearly 20% on the merger announcement. The spread is 2.2% between the stock’s market price and the deal value of $34.25. If you buy the stock, and the deal goes through, you will earn 2.2%. Over time, the spread will narrow as the merger gets closer to closing. This is the risk: the deal may not go through. The acquirer may change their minds or regulatory concerns could cause the deal to fail. The lower the likelihood for the deal to go through, the higher the merger arbitrage spread.
But what happens if the deal fails? The price falls dramatically, often to the prior price or even lower. In our example, you are hoping for a gain of a little more than 2%. If the deal doesn’t work out, you could easily lose close to 20% or more.
Illustration 5
 Source: Upstox
Conclusion
We’ve covered two types of distributions for trading strategies: a normal distribution and a skewed distribution. With a normal distribution strategy, your win rate and the amount gained or lost in a trade is roughly the same. A skewed distribution can come in two flavors. One where you lose many trades but occasionally win substantial sums. You can think of this as a “lottery ticket” style. Lastly, the second skewed strategy distribution sees a large number of winning trades. But these wins are offset by the occasional large-scale loss. Understanding how your trading strategy could perform is key to understanding your risks. Knowing if you are exposing yourself to frequent losses or the loss of a substantial sum in a single trade will help you develop a more robust, long-term trading plan.
Is this chapter helpful?
- Home/
- Understanding Strategy Outcome Distributions