Profitability Metrics
George Soros, known for his aggressive yet calculated bets, famously said: "It’s not whether you’re right or wrong that’s important, but how much money you make when you’re right and how much you lose when you’re wrong." Effective trade planning is the cornerstone of successful trading. In addition to understanding max gain, max loss, and breakeven points, you must also know your strategy’s potential returns to assess overall performance. By examining average returns, the average return when you win or lose, as well as median returns, you can gain valuable insights into your trading habits and profitability.
Average Returns
One of the most important trading metrics to understand is the average return. There are a few ways to think about this. You can either look at the actual, historical performance of your trading strategy or you can use the backtested performance. Positive average returns indicate that you could have an overall profitable strategy while negative returns likely mean that your strategy may not work well.
To calculate the average return of your strategy, you first sum the returns of all of the individual trades. Then, you divide this sum by the number of trades. Let’s look at an example set of ten trades with returns.
Illustration 1
| Trade | Trade Returns |
|---|---|
| #1 | -0.9% |
| #2 | 0.1% |
| #3 | -0.7% |
| #4 | 2.5% |
| #5 | 1.9% |
| #6 | -1.8% |
| #7 | -1.1% |
| #8 | 0.1% |
| #9 | 1.3% |
| #10 | -0.9% |
This is how you would calculate the average.

If you don’t want to manually do this, you can also use this formula in Excel:
Illustration 2

Simply substitute the range of your return data for the values in blue. Whether you manually do the math or use Excel, you will find that the average return for this particular strategy is +0.5%. Now, it is difficult to understand how good or bad this strategy is unless we know the trade duration. If the average trade is held for a day, this could be a pretty good trade. On the other hand, if you are holding each trade for a month at a time, then this trade may not provide the best returns.
A few things to remember. First, is that you shouldn’t rely on the average returns for only a handful of trades, you should have a reasonably large sample – whether historical data or backtested data – to obtain a reasonable estimate of the average return. Second, is that average returns aren’t static. This is because the markets are continually evolving and the performance of strategies are never consistent over a long period of time. What may work for a few months or years may not work over a longer time period.
Average Return Given a Winning Trade
Now that we know our average returns, how does our strategy perform when things are going well. Here is a quick example that shows why it is important to understand this trade metric. All three of these hypothetical strategies have an average return of 0.5% but if you look closely, you can see that they get to this average return in completely different ways. In strategy A, the returns have low volatility. When you are profitable, you make 1.5% and when you lose, your losses are -1%. Also, your wins are more frequent than your losses. This is a very favorable strategy. Looking at strategy B, you lose often – 4 out of 5 times – but when you lose, you only lose 1%. However, your gains are outsized at a return of 6.5%. This can be a riskier strategy because you have to hope that you can maintain your capital long enough through your losses to obtain the occasional win. Lastly, strategy C has frequent wins but the size of the loss exceeds the wins. While this could be a viable strategy, you would need to determine if you could effectively manage the losses through risk management practices such as stop losses.
Illustration 3
| Returns | Strategy A | Strategy B | Strategy C |
|---|---|---|---|
| #1 | 1.5% | 6.5% | -7.5% |
| #2 | 1.5% | -1.0% | 2.5% |
| #3 | 1.5% | -1.0% | 2.5% |
| #4 | -1.0% | -1.0% | 2.5% |
| #5 | -1.0% | -1.0% | 2.5% |
| Avg Ret | 0.5% | 0.5% | 0.5% |
Now that you understand the importance of the average return given a winning trade, let’s see how to calculate it. Using the same trade data we used to calculate the average return; we can identify the trades that were profitable. As you can see, trade #2, #4, #5, #8, and #9 were profitable.
Illustration 4
| Trade | Trade Returns |
|---|---|
| #1 | -0.9% |
| #2 | 0.1% |
| #3 | -0.7% |
| #4 | 2.5% |
| #5 | 1.9% |
| #6 | -1.8% |
| #7 | -1.1% |
| #8 | 0.1% |
| #9 | 1.3% |
| #10 | -0.9% |
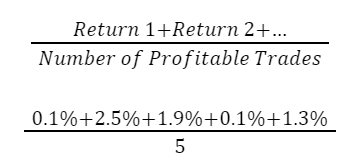
You will use the same formula that you did to calculate the average return. The only difference is that the numerator will only contain profitable trades and the denominator will be number of profitable trades.

This will result in a value of 1.2%. So, your strategy has an average return of 0.5% and an average return given a winning trade of 1.2%. You don’t need to manually calculate this yourself. In Excel, you can use the following formula:
Illustration 5

For the values in blue, you would use the range of your strategy’s return data.
Average Return Given a Losing Trade
Continuing on, you should also understand the average return given a loss. This metric is the counterpart to average return given a win. Similarly, you will calculate the average from your strategy’s losing trades. Looking at the same dataset, you can see that the losing trades are -0.9%, -0.7%, -1.8%, -1.1%, and -0.9%.
Illustration 6
| Trade | Trade Returns |
|---|---|
| #1 | -0.9% |
| #2 | 0.1% |
| #3 | -0.7% |
| #4 | 2.5% |
| #5 | 1.9% |
| #6 | -1.8% |
| #7 | -1.1% |
| #8 | 0.1% |
| #9 | 1.3% |
| #10 | -0.9% |
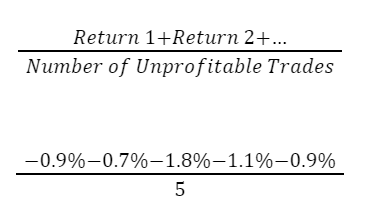
The sum of these values will be in the numerator and since the total number of losing trades is 5, this number will be in the denominator.

With this formula, you will find that the average return given a losing trade is -1.1%. You can also use a specialized formula in Excel to calculate this. This is the formula:
Illustration 7

You would substitute the specific data range for the value in blue.
Median Returns
The median return is the last return metric we will discuss. Median returns highlight what a “typical” trade looks like, which can be more reflective of your strategy's consistency than the average return. Median return is the midpoint of all trade returns, splitting them evenly between higher and lower values. Unlike the average, the median is less affected by outliers, providing a clearer picture of typical trade performance.
You calculate the median return by sorting your strategy’s trade returns from high to low (or low to high). The median return is the middle value. For example, if you have five data points that you are looking at, the median is point #3 after you’ve sorted.
But what if you have an even number of data points like 6 or 10? Since there is no one midpoint value, you take the two midpoint values and average them to get the median return. Let’s return to our hypothetical set of 10 trade returns. Since there are an even number of returns, the two midpoint values are for trades 5 and 6. The corresponding returns for these two trades are 0.1% and -0.7%.
Illustration 8
| Trade | Trade Returns | Sorted Returns |
|---|---|---|
| #1 | -0.9% | 2.5% |
| #2 | 0.1% | 1.9% |
| #3 | -0.7% | 1.3% |
| #4 | 2.5% | 0.1% |
| #5 | 1.9% | 0.1% |
| #6 | -1.8% | -0.7% |
| #7 | -1.1% | -0.9% |
| #8 | 0.1% | -0.9% |
| #9 | 1.3% | -1.1% |
| #10 | -0.9% | -1.8% |
By averaging +0.1% and -0.7%, you will get the median value for this trading strategy: -0.3%. You can also use the following Excel formula and substitute your data range in place of the values in blue.
Illustration 9

Using Returns in Trade Planning
Throughout this lesson, we were able to calculate the following profitability metrics for our hypothetical trading strategy:
- Average Return: +0.5%
- Average Return given Win: +1.2%
- Average Return given Loss: -1.1%
- Median (or typical) Return: -0.3%
Overall, this strategy isn’t bad but could be better. Your average return is favorable and would be a good value in terms of its size as long as the trade duration is fairly short – perhaps one week or less. It is also a positive that the average returns for winning trades is larger than for losing trades. You have also seen that the number of winning trades is the same as the number of losing trades. Lastly, the median or likely return is negative. This could give you reason to consider additional risk management measures or adjust the strategy to get this close to being a positive value.
In summary, understanding profitability metrics allows you to evaluate your trading strategy holistically:
- If your average winning return significantly exceeds your average losing return, your strategy might remain profitable even with a lower win rate.
- Comparing the median return to the average helps identify if outliers (big wins or losses) skew your perception of performance.
By tracking these metrics regularly, traders can refine their strategies, set realistic goals, and maintain discipline.
Is this chapter helpful?
- Home/
- Profitability Metrics