Diversification
Whether you are investing for a multi-month or multi-year time horizon, trading equities with holding periods of several days or weeks, or trading options intraday, you must spread out your “bets”. There is a saying – don’t place all your eggs in one basket. That is the core concept behind this lesson. Let’s talk through a quick hypothetical. Perhaps you think that a stock will rise this week after have a few weeks of consecutive losses. You’ve also been following a few other stocks that are set to announce earnings and you think that their stock will underperform after the announcement. Lastly, you believe that the Nifty will continue its upward price trend. Since you don’t have infinite capital, you have a choice – you can allocate your capital across all of these trades or you could risk it on a single trade.
Maybe you decide to place most of your capital on the stock that you expect to rise. If it goes up in price, then fantastic! But what happens if it falls instead? To add insult to injury, what happens if you were correct about the stocks that announced earnings and subsequently fell in price? You could have been profitable with an options trade on these stocks but you didn’t place the trade. By spreading your capital across multiple trades, you could have participated in all of these opportunities. Even better, you can potentially reduce the risk of loss. This concept of not placing your eggs in one basket and instead placing them in multiple baskets is known as diversification.
Here is a visual example. Perhaps you were analyzing stocks in the Nifty 50 and decided that you wanted to invest in some of them over the next year. You narrowed it down to the following stocks, all of which are constituents of the Nifty 50: TCS, HDFC Life, Cipla, Bharti Airtel, Mahindra & Mahindra, and Sun Pharmaceuticals.
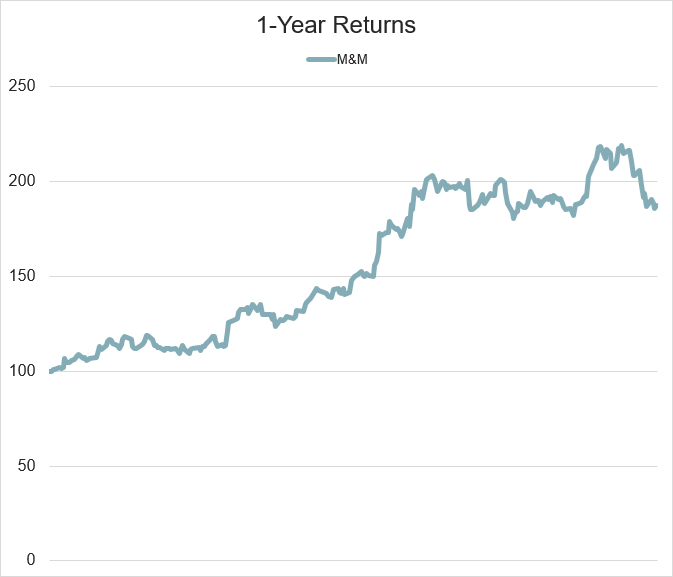
In scenario 1, you narrow down your selection to Mahindra & Mahindra. Over the next year, this stock returns 87.1% - an extremely impressive return. Illustration 1 displays the price returns of M&M, normalized to a starting price of 100.
Illustration 1
 Source: Upstox
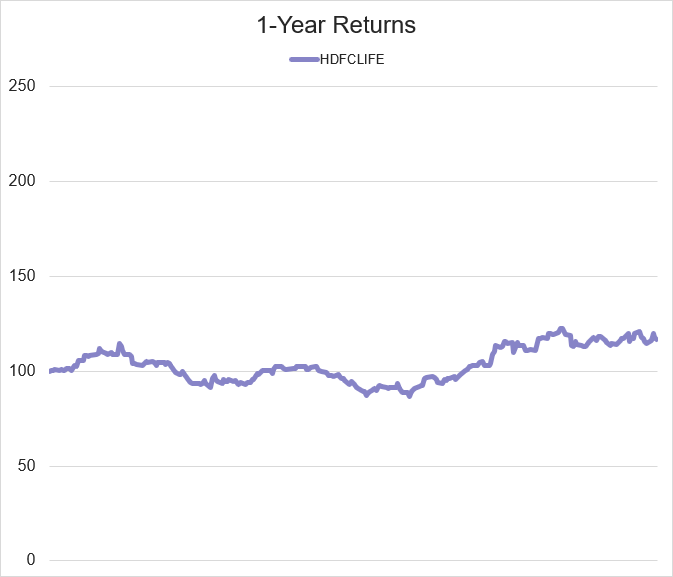
In scenario 2, instead of M&M, you instead decide to invest HDFC Life. While you still get a positive return of 16.5%, you substantially underperform Mahindra & Mahindra. In addition, if you look closely, there was a period where you had a negative return for a period of several months. Illustration 2 shows the price returns of HDFC Life over a one-year period.
Illustration 2
 Source: Upstox
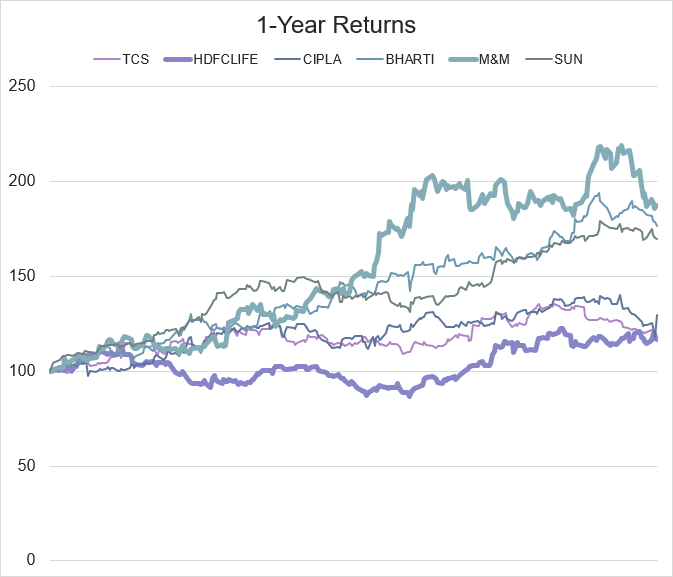
Let’s look at price returns of all six of the stocks you were considering. M&M was the best performer and HDFC Life was the worst performer. These two stocks are highlighted in bold in illustration 3. As you can see, the other four stocks provided returns somewhere in the middle.
Illustration 3
 Source: Upstox
Illustration 4
| TCS | HDFCLIFE | CIPLA | BHARTI | M&M | SUN | ||
|---|---|---|---|---|---|---|---|
| Returns | 17.8% | 16.5% | 29.3% | 76.4% | 87.1% | 69.8% |
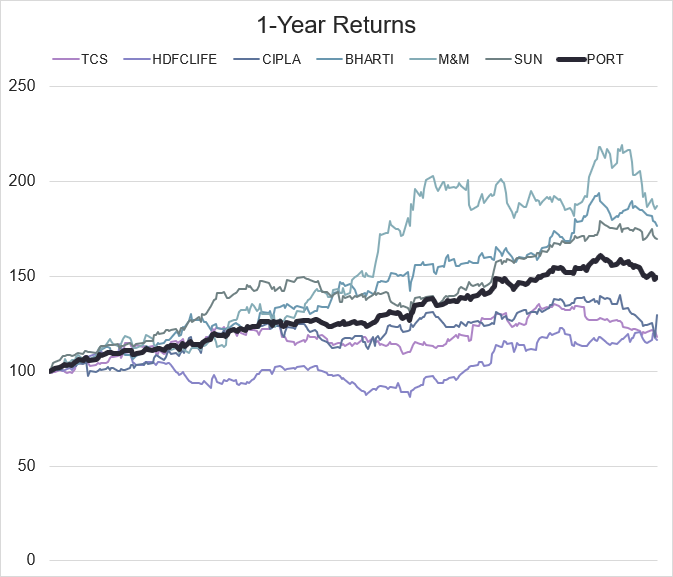
This is the problem. You can’t predict the future so there is no way to know that the one trade that you make will be the best possible one. The way around this is to spread your capital. What if instead of selecting between these six stocks, that you believe are high quality investments, you evenly invest in all of them? If you did that, you wouldn’t match the best return of M&M but you will beat the worst return of HDFC Life. By evenly investing in each of these stocks, you will create a blended portfolio where the returns are a weighted average of the individual stocks. In this case, the portfolio return is nearly 50%.
Illustration 5
 Source: Upstox
Illustration 6
| TCS | HDFCLIFE | CIPLA | BHARTI | M&M | SUN | PORTFOLIO | |
|---|---|---|---|---|---|---|---|
| Returns | 17.8% | 16.5% | 29.3% | 76.4% | 87.1% | 69.8% | 49.5% |
| Std Dev | 20.5% | 23.6% | 26.3% | 22.0% | 30.7% | 18.5% | 13.4% |
So, one of the benefits of diversification is that you reduce the risk associated with making an individual trade or investment in a single stock. By spreading your capital, you may not perform the best but you won’t have to worry about performing the worst by accidentally making the wrong trade.
A second benefit of diversification is reduced variance or standard deviation. Standard deviation is the fluctuation around an average. If we look at the annual return of TCS, you can see that it is 17.8%. However, the price doesn’t move up consistently every single day of the year. On some days, the price goes up, on others it goes down. The standard deviation of TCS for the year was +/-20.5%.
Illustration 7
| TCS | HDFCLIFE | CIPLA | BHARTI | M&M | SUN | |
|---|---|---|---|---|---|---|
| Returns | 17.8% | 16.5% | 29.3% | 76.4% | 87.1% | 69.8% |
| Std Dev | 20.5% |
Some stocks have higher standard deviation while others have lower standard deviation. One point to note is that stocks don’t necessarily move together. For instance, TCS has a standard deviation of 20.5% and M&M has a standard deviation of 30.7%. If TCS’s price goes up tomorrow, that doesn’t mean that M&M’s price will go up by a higher amount just because it has a higher standard deviation.
Illustration 8
| TCS | HDFCLIFE | CIPLA | BHARTI | M&M | SUN | |
|---|---|---|---|---|---|---|
| Returns | 17.8% | 16.5% | 29.3% | 76.4% | 87.1% | 69.8% |
| Std Dev | 20.5% | 23.6% | 26.3% | 22.0% | 30.7% | 18.5% |
Here is a selection of daily returns for these stocks. In example 1, TCS is down nearly 3% while CIPLA is up over 9% for the day. In example 2, all the stocks are up but Bharti Artel and M&M are up more than the others. Lastly, while Bharti Artel is flat for the day, all of the other stocks are down.
Illustration 9
| TCS | HDFCLIFE | CIPLA | BHARTI | M&M | SUN | |
|---|---|---|---|---|---|---|
| Example 1 | -2.8% | -0.9% | 9.4% | -1.3% | 0.8% | -0.2% |
| Example 2 | 0.9% | 2.1% | 1.8% | 4.4% | 3.3% | 1.1% |
| Example 3 | -1.6% | -2.4% | -0.9% | 0.0% | -3.7% | -0.5% |
By diversifying across multiple stocks or trades, you can smooth out these day-to-day fluctuations. As with before, you won’t get the best return of the day but you also won’t get the worst – your return will be somewhere in the middle. The result of this happening day after day is that the overall standard deviation of your portfolio will be lower. As you can see in this illustration, the portfolio, which is an equal weighting of the six stocks, has a standard deviation that is lower than any of the individual stock’s standard deviation.
Illustration 10
| TCS | HDFCLIFE | CIPLA | BHARTI | M&M | SUN | PORTFOLIO | |
|---|---|---|---|---|---|---|---|
| Returns | 17.8% | 16.5% | 29.3% | 76.4% | 87.1% | 69.8% | 49.5% |
| Std Dev | 20.5% | 23.6% | 26.3% | 22.0% | 30.7% | 18.5% | 13.4% |
Conclusion
While we have been discussing individual stocks, this concept works for across asset classes such as options, futures, or ETFs, as well as trading strategies. For instance, you can consider a technical analysis-based intraday option strategy as synonymous to a single stock from our examples. Another strategy could be a multi-day equity swing trade that focuses on earnings announcements. You would diversify your strategies by placing some of your capital in the technical analysis strategy and some in the earnings announcement strategy. The intent is that if your technical analysis strategy starts to underperform, the earnings strategy would smooth out your overall returns.
In summary, whether you are investing or trading, you should diversify across stocks, asset classes, and strategies. By doing so, you won’t have the best possible return but you also won’t have the worst possible return. Specifically, your return will be a weighted average of the individual assets or strategies that you use to construct your portfolio. Even better, the standard deviation, or return variability, of your portfolio will be superior to that of the individual assets or trading strategies.
Is this chapter helpful?
- Home/
- Diversification