Consider Uncorrelated Strategies
Imagine that you were using two different trading strategies. Maybe one is an equity-based technical analysis strategy and the other is a fundamental analysis futures strategy. What if every single trade, for both strategies, resulted in the same outcome? If one results in a daily return of +2%, the other also has a daily return of +2%. If one falls by -5%, the other also falls by -5%. This is known as perfect, positive correlation. Correlation is a statistical term and describes the co-movement between two assets or strategies.
Correlation ranges between -1.0 to +1.0. The correlation value cannot be outside of this range. Perfect positive correlation is represented by a value of +1.0. On the other hand, perfect negative correlation is represented by a value of -1.0. An example of this would be if your equity strategy goes up +3.5%, your futures strategy will have a -3.5% return. Something to keep in mind is that correlations are determined over a length of time; just because two stocks, funds, or strategies move up the same or similar amount for several days – or a single day – doesn’t mean that they are highly correlated. In this table, we should how you can describe the values for correlation.
Illustration 1
| Correlation Values | |
|---|---|
| Perfect Positive Correlation | +1.0 |
| Positive Correlation | +0.01 to +0.99 |
| Uncorrelated | +0.0 |
| Negative Correlation | -0.01 to -0.99 |
| Perfect Negative Correlation | -1.0 |
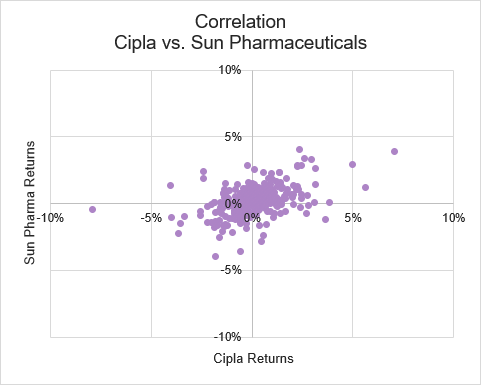
Here is a visualization of correlation. These are two stocks from the same sector: Cipla and Sun Pharmaceuticals. We have plotted the daily returns of these two stocks for a one-year period against each other. On the x-axis are the returns for Cipla and the y-axis has the returns for Sun Pharma.
Illustration 2
 Source: Upstox
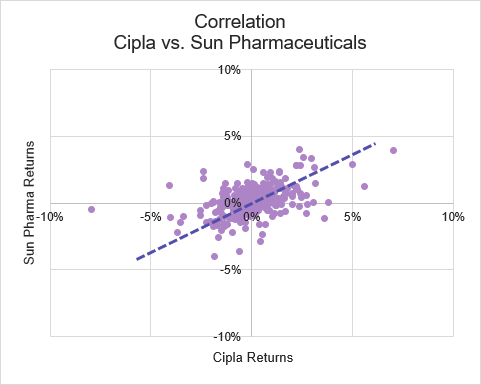
As you can see, there is a slight, but visible relationship between the returns of these two stocks. When one moves up, the other tends to move up as well. This should make sense because both of these companies are drug manufacturers.
Illustration 3
 Source: Upstox
Of course, because these are still two different companies, the stock prices aren’t perfectly in unison. You can calculate the correlation between two company’s returns by using an Excel function: “=correl()”. Using the Excel function, we determine that the correlation between these two companies, for this particular time period, was 0.42. So, not perfectly correlated but there is a definite positive correlation between them.
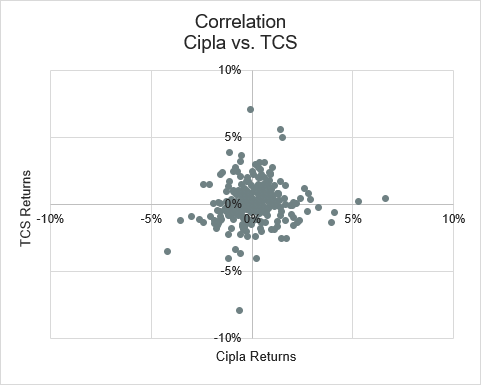
What about two companies that are more different: Cipla and TCS. As you can see in this chart, the relationship is far less obvious. In fact, the correlation between these two companies is close to 0; it is 0.07. So, we can say that for this time period, the daily returns for Cipla and TCS are uncorrelated.
Illustration 4
 Source: Upstox
Why is this important? As you start building a portfolio of trading strategies or portfolio of investments, you should understand how the relationship between the individual strategies or assets impacts the risk of your overall portfolio. Notice that we are looking to understand the ‘risk’ rather than focusing on the ‘return’. There is an interesting reason by that and it involves correlation. The correlation between strategies or assets can give an extra “boost” to risk reduction.
The expected return of a portfolio of stocks (or strategies) is simply the weighted average of the individual stocks (or strategies). For instance, you plan to hold Reliance and HDFC Bank for the next week. You believe that Reliance will return 2% and HDFC Bank will return 4%. If you evenly weight your allocation to each stock, 50% each, then your expected return is 3%. You calculate this by taking: (50% x 2%) + (50% x 4%). This is the technical formula for the expected return of a portfolio of 2-assets or strategies.

Before we get into the math behind portfolio standard deviation, let’s dive into an illustrative example. Assume you have one trading strategy that has an expected return of 10% with a standard deviation of 12%. For those unfamiliar with standard deviation, it is a statistical term that describes how much movement occurs around an average. In this case, the majority of the returns of your trading strategy should fall within +/-12% of your expected return of 10%; so, -2% to +22%.
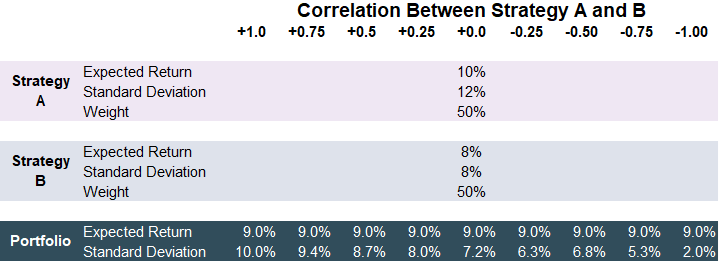
You come up with a new trading strategy that should have expected returns of 8% with a standard deviation of 8%. The question is: how will the correlation in the performance of these two strategies impact your portfolio standard deviation? Here is a table that shows these two strategies with potential ranges of correlation from +1.0 to -1.0. If you look at the first column where the correlation is +1.0. If you determine that your two strategies are perfectly positively correlated, you will have a portfolio standard deviation of 10.0%. This is the same as the weighted average of the standard deviation where strategy A has a standard deviation of 12% and strategy B has a standard deviation of 8%. Averaging 12% and 8% will get you this same result.
Illustration 5
 Source: Upstox
It gets interesting as your strategies move away from perfect positive correlation. If the two strategies are correlated at a value of +0.50, your portfolio’s standard deviation will drop to 8.7%. It gets even better if your two strategies are negatively correlated. Looking at a correlation of -0.75, you can see that your portfolio standard deviation is 5.3% - nearly half of what it would be if the strategies were perfectly correlated. This is all while your expected return is the same between the two strategies. The only difference is that your risk of potential losses due to return fluctuations is far lower.

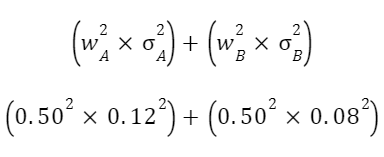
In the first part of the formula, we see two variables: w and σ. This is the weight and standard deviation of each asset, or strategy, respectively. Each of these values are squared. Filling them in will look like this.
The second part of the formula has the same variables of weight and standard deviation but also adds p. This is a Greek term known as rho which is used to represent correlation. For those familiar with options Greeks, this rho is not the same as the one shown in an option chain.
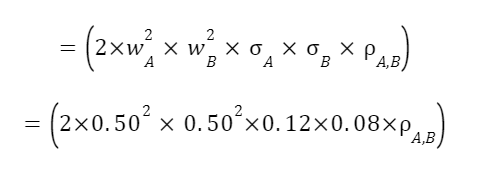
Lastly, you take the square root of this entire formula to calculate the standard deviation of a two-asset portfolio. Going forward with this example, if you input 0.25 as the correlation value, the filled-out equation would look like this. The result would be 8%.

Conclusion
While correlation can seem like a very analytical topic, intuitively, it should make sense. If you have invested in certain assets, or are using certain trading strategies, that outperform when your other investments or strategies are pulling back, the returns of your overall portfolio will be smoothed out. If you are just starting out, you don’t necessarily need to take the time to explicitly calculate the correlation across your strategies and use that to determine their optimal weighting based on what maximizes returns or minimizes risk. What you do need to understand is that your trades shouldn’t all be the same; there is substantial risk management benefits to developing trading strategies that are different from each other and have their own unique source of returns.
Is this chapter helpful?
- Home/
- Consider Uncorrelated Strategies