Introduction to the Option Greek – Theta
Introduction to the Option Greek – Theta
It is a dilemma we have all faced, at some point in time. You have a headache. You pull out a strip of tablets from the medicine cabinet, only to find the tablet has two days to expiry. You are now torn- have the tablet, cure the headache immediately or toss it out and buy a new one. This is because with medicines, the expiry date only tells you for how much longer the tablet is ‘safe’ to be consumed. What it doesn’t tell you is if the ‘potency’ of the medicine is still what it was when it was manufactured.
An options trader has to similarly contend with expiry and the time decay that occurs in options contracts nearing expiration. Fortunately, unlike with medicines, there is an indicator for Options traders that takes the guesswork out of trading near expiration dates.
Meet ‘Theta’. This Greek is important to understand if you plan to hold an option for more than a day.
What is Theta?
Options that are purchased lose value over time until the ‘time value’ decays to zero at expiration. At expiration, the option is either worth its intrinsic value or it is worthless depending on where the underlying price is in relation to the strike price. The time value, or extrinsic value, will always be 0 at expiration.
Theta provides the trader with insights into how much the option will lose in value if they continue to hold it for one more day. For example, if the price of an option right now is 1.00 and its theta is -0.05, then the option will be worth 0.95 the next day, if nothing else changes. As an option contract gets closer to expiry, the value of theta will become more negative. For instance, an option contract could have a theta of -0.15 when expiry is three weeks away but theta will have a larger value, perhaps -0.25, when the option contract is closer to expiry.
What is an example of using Theta?
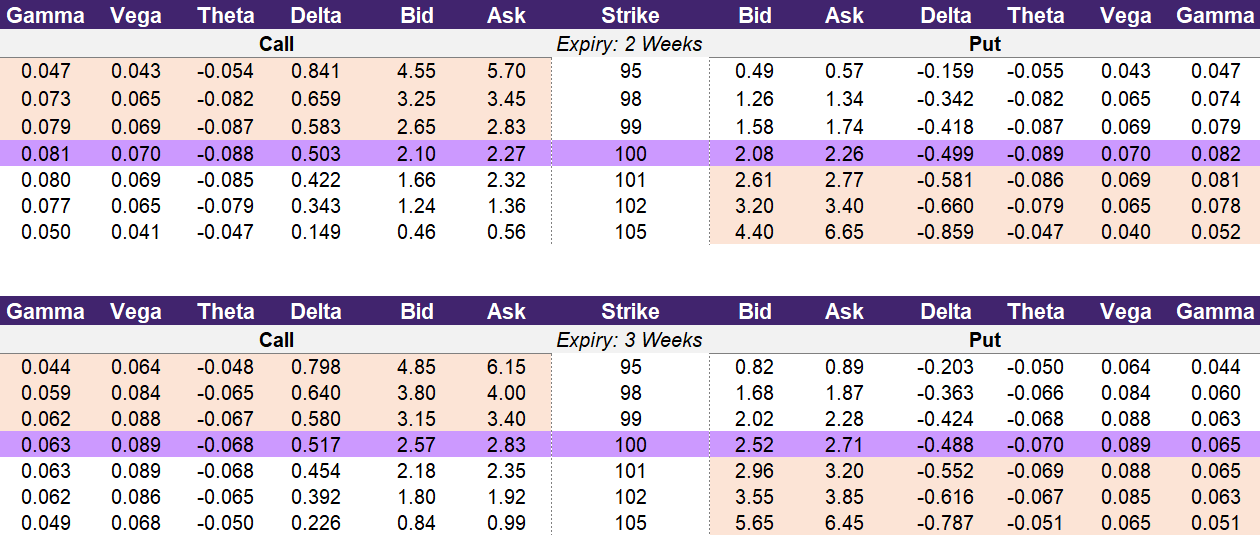
Illustration 1 below is an expanded option chain of a hypothetical stock that is trading at ₹100. It contains the prices for option contracts across two expiration dates. The top table has data for an expiration in 2 weeks and the bottom table is or an expiration in 3 weeks. The theta values for the call options are in the third column from the left and for put options is in the third column from the right.
Let’s look at the 100-strike price for a call option for the expiration that occurs in 2 weeks (top table in illustration 1). If you wanted to buy this contract, it would cost you 2.27. The theta for this contract is -0.088. The theta value tells you that this contract will be loss -0.088 in value overnight assuming nothing else changes such as the underlying price or implied volatility. As a trader, you can use this to understand the risks of holding for one more day.
Diving a little further into this example, this trade would require that the underlying move up to 102.27 by expiry in order to be breakeven. Since the strike price is 100 and the cost is 2.27, the underlying would need to rise to 102.27 (100+2.27) in order to cover the cost of entering the trade. If the underlying is completely flat throughout the trading day, you would need to decide if it is worth it to continue to hold the position. Tomorrow, the option will be worth approximately 2.18 which is -3.9% lower than the purchase price. Theta provides you the information to decide if you want to give your trade more time to be successful or if you would rather “cut your losses” and exit early.
You can compare this to the bottom table in illustration 1. The 100-strike price for a call option would cost 2.83 to purchase. The theta for this contract is -0.068. As we discussed previously, theta will have less of an impact to the option’s price the further out from expiry that it is. The contract with 2-weeks until expiration has a theta of -0.088 and the contract with 3-weeks until expiration has a theta of -0.068. In addition, the contract that has 3-weeks until expiration will lose -2.4% of the value of the contract (-0.068 / 2.83) overnight. This is less than the other contract that will lose -3.9% (-0.088 / 2.27) overnight.
So, contracts that are closer to expiration will lose more due to theta decay than those that are further out from expiration on both a price perspective as well as from a return perspective.
Illustration 1: Expanded Option Chain
 Source: Upstox
For example, a 100-strike call option with 2 weeks until expiration costs ₹2.27, and its Theta is -0.088. Overnight, this option will lose 0.088, meaning it will be worth ₹2.18 tomorrow. On the other hand, a 3-week 100-strike call option costs ₹2.83, and its Theta is -0.068, resulting in less daily decay.
How does theta vary between calls and puts?
Each option Greek has a sign – positive or negative – associated with it. Theta is always negative for long calls and long puts which means that it lowers the value of the option. Theta is the option Greek that provides the trader with information about the impact of the passage of time. The more time remaining until expiration, the more extrinsic value (or time value) that an option contract will have. If there is less time, there is less extrinsic (or time) value. Since time only moves in one direction, each day, an option will have less time value. Once an option expires, the time value will always be 0. Theta being negative for long call and put options should be intuitive if you think about the fact that an option has time value prior to expiry but on expiry, the time value must always be 0. Even though the extrinsic value of an option decays to 0 throughout its life, this decay isn’t linear. Far away from expiry, the impact of theta – always known as time (or theta) decay – will look fairly even each day. However, the closer to expiry that you get, the greater the time decay. On the days just prior to expiration, an option’s extrinsic value will have exponential amounts of time decay.
For short calls and short puts, theta will be positive. As each day passes closer to expiry, the value of the option contract will fall which is a ‘positive’ for the option seller. Remember: when you short an option contract, your intent is to sell high and buy low. Assume you sell an option contract for ₹100 that has a theta of -1 (theta of +1 for the seller). Tomorrow, if nothing else changed like the underlying’s price or implied volatility, then the new price of the option contract is ₹99. You can buy-to-close this contract for a gain of +₹1 which was your theta value of the short option.
Illustration 2 below summarizes this relationship between the option strategy, theta, the passage of time, and the impact of the position.
Illustration 2: Theta and Time Passage
| Strategy | Theta | Impact of Time |
|---|---|---|
| Long Call | Negative | Unfavorable |
| Long Put | Negative | Unfavorable |
| Short Call | Positive | Favorable |
| Short Put | Positive | Favorable |
How can traders use theta?
When you buy an option, theta provides you with information about the risks of holding that option for an extra day to wait for your trade to work in your favor. By looking at theta, you can make a determination if it is worth it to keep holding or to exit early. Generally, if the option has a week or more until expiry, it will likely be worth it to lose a little due to time decay if you still believe in your trade thesis. However, if you are within a few days from expiry, there could be significant financial risks due to theta decay if you decide to stay in the position. While theta can give a “long” trader insights into risks, theta can provide information on potential gains for “short” traders.
When you sell an option, you collect a premium upfront and hope that the option expires worthless. Instead of holding until expiry, you could take advantage of short-term time decay if you believe the underlying will be flat in the next day or two. Let’s compare two contracts for puts that you could possibly sell: the 100-strike price and the 95-strike price. You can collect more premium for the 100-strike price (₹2.08) as compared to the 95-strike price (₹0.49). In addition, the theta impact is -0.089 for the 100-strike versus -0.055 for the 95-strike price.
However, you should also consider the potential return of this trade! Assuming the underlying price and implied volatility doesn’t move, shorting the 100-strike put option will yield you a 4.3% overnight return (-0.089 / 2.08). On the other hand, the 95-strike short put option will yield a 11.2% overnight return (-0.055 / 0.49). Of course, this is just an illustrative example as you will also need to consider margin requirements, contract liquidity including the bid-ask spread, as well as fees.
Illustration 3: Option Chain Demo
 Source: Upstox
How does theta vary by moneyness for long call and long put options?
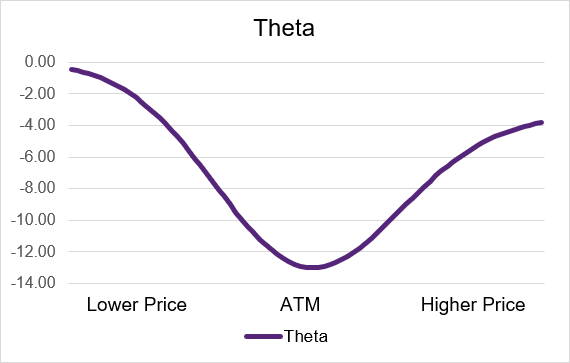
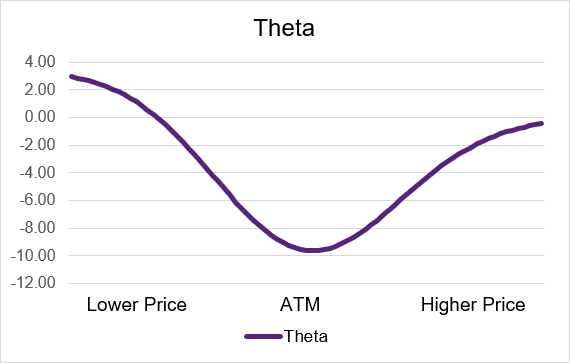
For both long call and long put options, theta is the most impactful when the option contract is at-the-money. As the underlying moves and the option either becomes in- or out-of-the-money, the level of theta lowers. Long call and long put options also always have negative theta. Illustration 4 provides an example theta curve for a call option and illustration 5 displays the curve for a put option. The y-axis for these illustrations is the level of theta. The x-axis is the underlying price where lower values are to the left and higher values are to the right.
Illustration 4: Long Call Theta by Moneyness
 Source: Upstox
Illustration 5: Long Put Theta by Moneyness
 Source: Upstox
Even though theta is the most negative when an option contract is at-the-money, that doesn’t necessarily mean that time decay will be the most impactful to the option’s price. Remember, an option that is deep in-the-money will have the majority of its option price be intrinsic value and will have only a little time value. Since theta only impacts time value, a small theta will still be a large proportion of the time value. Alternatively, an option that is deep out-of-the-money will have no intrinsic value and the price of the option will consist entirely of time value. However, this time value will also be small because the option is deep out-of-the-money. A small theta will be a significant amount of the time value.
In illustration 6, these are three examples of call option contracts over time. The underlying is trading at 20000 with an implied volatility of 12%. The ATM contract (left chart) has a strike price of 20000, the ITM contract (middle chart) has a strike price of 19800, and the OTM contract (right chart) has a strike price of 20200.
The y-axis is the amount of time value associated with the contracts and the x-axis is the number of days until expiration. As you can see, the time value decreases as you go from left to right – or move closer to expiry. As you can see the ATM contract has the most time value. So even the theta is higher for at-the-money contracts, there is more time value available to “decay”. What you can also see from the charts below is that the theta decay isn’t linear and is more rapid nearest expiration.
Illustration 6: Time Decay for Different Contracts
 Source: Upstox
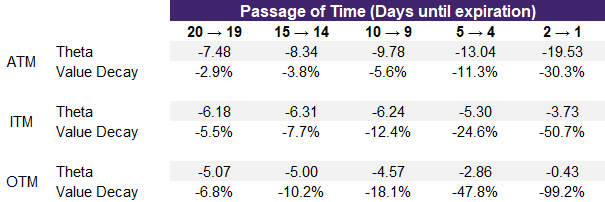
To make this clear, the table in illustration below shows the same data from the charts above. As you move from 20 to 19 days until expiration, the theta for the ATM contract is -7.48 which is a -2.9% reduction in time value. By comparison, the theta values for the ITM and OTM contract are lower but the percent impact to the time value is higher. Looking at the far-right side of the table, when you go from 2 days to 1 day until expiration, the percentage impact of theta decay to the remaining time value is significant. For the ATM option, it will lose 30% of its value overnight while the ITM and OTM contracts lose 51% of 99% of their time value respectively.
Illustration 7: Time Decay Data Table
 Source: Upstox
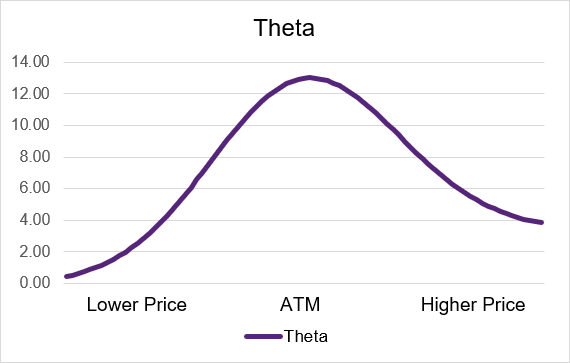
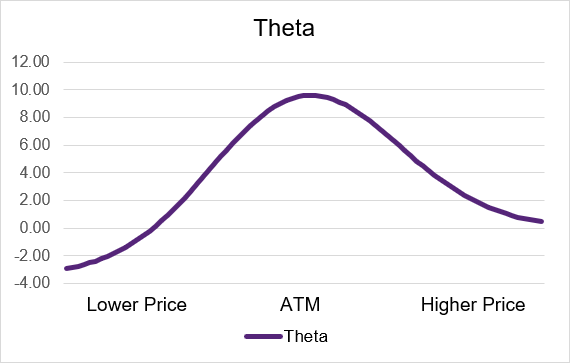
Short call and short put option strategies have positive theta which means that time works to the benefit of the trader. Each day, as long as the underlying price and implied volatility stay relatively constant, the option price will go down. If you are short an option, to close out the trade, you need to “buy to close”. If the option price is lower, then you can “buy low” leading to a profit. Similar to with long call and put options, the theta will be the highest for the at-the-money contract. Also similar are the in- and out-of-the-money contracts will have the greater proportion of impact to the option’s price. Illustration 8 and 9 below show how theta works for short calls and puts. The y-axis displays the theta value while the x-axis has the underlying price level. As you can see in the charts below, the values of theta for a short call and put option are aways greater than 0.
Illustration 8: Short Call Theta by Moneyness
 Source: Upstox
Illustration 9: Short Put Theta by Moneyness
 Source: Upstox
Summary
- Theta is a negative value: Theta is sometimes quoted as a positive value. This is merely a simplified convention. The concept to remember is that if you buy an option, the theta is a negative value (even if quoted as a positive one).
- Time decay increases closer to expiry: It is extremely difficult to fight the time decay associated with an option with limited time until expiration. If an option is losing 5%, 10%, or more in value due to time decay, the underlying will need to move even more to have a chance for the trade to be profitable.
- For sellers, it’s always Advantage Theta: When you are long either with a call or put option, you are exposed to theta decay. Selling calls and puts places theta as an advantage for you since your goal is for the option to expire worthless when shorting options.
Is this chapter helpful?
- Home/
- Introduction to the Option Greek – Theta