Personal Finance News
What the high SIP stoppage ratio tells us about the stock market's law of demand
 (1) (3).jpg)
5 min read | Updated on March 19, 2025, 15:23 IST


SUMMARY
Investors who are getting out of SIPs now are essentially ignoring the basic principle at the heart of investing regularly through SIPs, which is cost averaging.
As the stock market has strengthened, the amount of money coming into mutual funds through SIPs has also gone up. | Image source: Shutterstock
The idea of investing in mutual funds, particularly equity mutual funds, through systematic investment plans (SIPs), might be facing its first major challenge in recent years.
In February, the stoppage ratio for SIPs stood at 123%, implying that for every 100 new SIPs that were started during the month, 123 SIPs were discontinued or their tenures were completed.
The data that is used to calculate the stoppage ratio of SIPs is available from April 2021 onwards. As can be seen in the accompanying chart, the stoppage ratio in February 2025 was the highest it has ever been. It was 109% in January 2025 and 80% and 83% in November 2024 and December 2024, respectively.
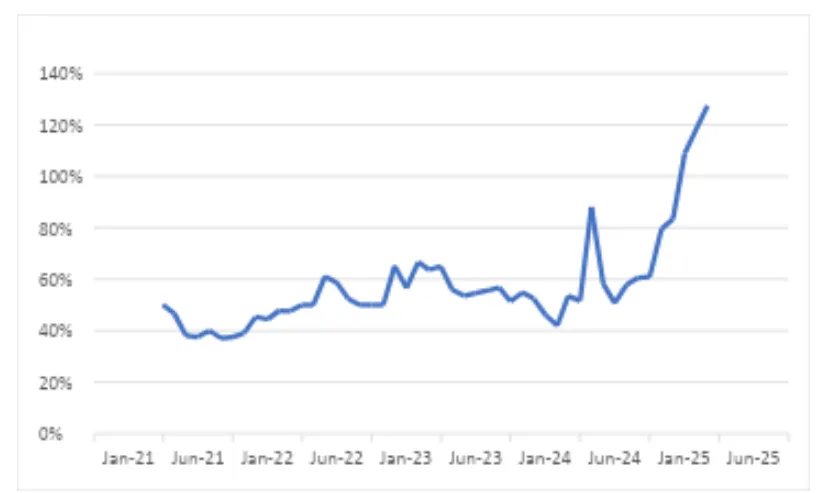 Source: Author calculations on data sourced from the Centre for Monitoring Indian Economy
Indeed, January 2025 and February 2025 are the only two months in which the stoppage ratio has been higher than 100%, implying that more SIPs have been discontinued or had their tenures completed in comparison to the new SIPs that were started.
If you look at the above chart, it clearly shows that the stoppage ratio has spiked since November 2024. This is no surprise given that the stock market peaked in late September 2024 and has fallen since.
What does this tell us? It tells us that the basic law of demand works in reverse in the case of the stock market. The law states that the demand for something is inversely proportional to its price, that is, at higher prices there is lower demand, and at lower prices, there is higher demand.
This is precisely what happened in the case of SIPs. Look at the following chart.
 Source: Centre for Monitoring Indian Economy
*April 2024 to February 2025.
Source: Centre for Monitoring Indian Economy
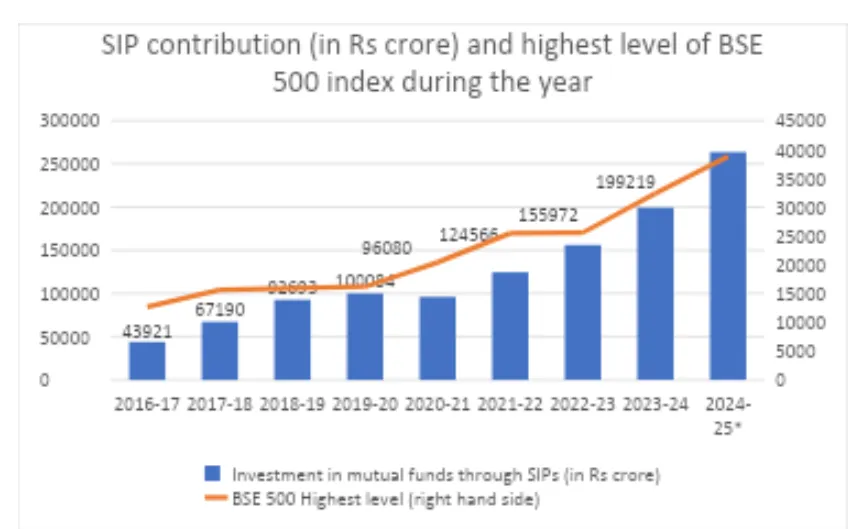
*April 2024 to February 2025.As the stock market has gone from strength to strength, the amount of money coming into mutual funds through SIPs has also gone up. Let’s try and understand the above chart in some detail. The blue bars represent the contribution made to mutual funds through the SIP route. The orange line (represented on the right-hand side) is the highest level achieved by the BSE 500 index, which is a good representation of the overall stock market, during the year.
As the stock market, represented by the BSE 500 index has gone from strength to strength, the money flowing through SIPs has also gone up, reaching ₹2.63 lakh crore during 2024-25 (April 2024 to February 2025). So, as the stock prices have gone up, their indirect demand through SIPs has also gone up.
Now, SIPs are a way of investing in mutual funds as a whole and not just equity mutual funds. Nonetheless, it is estimated that a bulk of the money coming in through the SIP route gets invested into equity mutual funds, which in turn buy stocks. Hence, increasing contribution to SIPs essentially highlights the increasing indirect demand for stocks, implying that the law of demand works in reverse in the case of the stock market.
In the last few months, as the stock prices have fallen, the SIP stoppage rate has gone up. However, a detailed breakup of SIP data isn’t publicly available. We don’t know how much money goes into different kinds of equity mutual funds through the SIP route.
But looking at other data, it’s clear that a lot of SIP money seems to have gone into smallcap funds, which invest in small-cap stocks, midcap funds, which invest in midcap stocks, and thematic and sectoral funds, which invest in certain themes and stocks representing certain sectors. This is especially true for the 2023-24 and 2024-25.
We also know that small-cap and midcap stocks and stocks representing favoured themes have fallen by far the most over the last few months. This means that investors who invested indirectly in such stocks through the SIP route are either sitting on losses or their profitable positions have gone down majorly. And it’s these investors who may be getting out of SIPs. I use the word maybe simply because to say this with absolute surety more detailed data is needed in the public domain.
To conclude, investors who are getting out of SIPs now are essentially ignoring the basic principle at the heart of investing regularly through SIPs, which is cost averaging. This means that when stock prices fall, SIP investors continue to buy stocks and in the process bring down the cost of their purchase. So, when the market rallies after the fall, the gains are bigger. Of course, there are no guarantees and no sure-shot time frame within which this will play out. Indeed, this uncertainty is difficult to handle and is perhaps leading to investors discontinuing their SIPs.
Related News

About The Author
Next Story


