Market News
Week ahead: US & India inflation data, FIIs activity, and global cues among key market triggers as NIFTY50 faces 25,000 resistance
.png)
6 min read | Updated on December 09, 2024, 07:48 IST
SUMMARY
After rebounding over 5% in the past three weeks, the NIFTY50 index extended its recovery to the 24,850 level, approaching the psychologically significant 25,000 mark. In the upcoming sessions, traders should watch the critical resistance at 24,850. A decisive close above this level on the daily chart could pave the way for a move toward the 25,000 level.

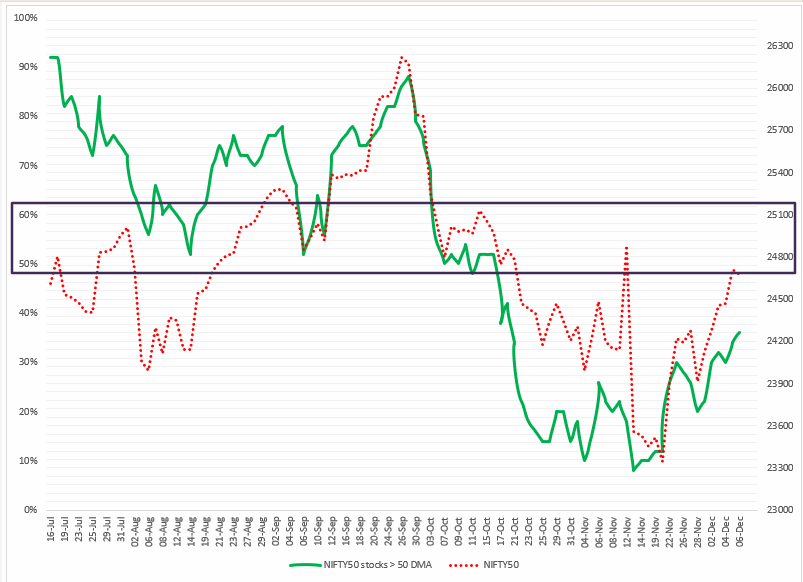
NIFTY50 index maintained positive breadth, with over 30% of its constituents trading above their respective 50 DMA
The bullish trend in the markets held firm, extending their rally into a second week. The sharp gains in the indices were led by broad-based gains across sectors after the RBI slashed the cash reserve ratio by 0.5% to 4% to improve liquidity. The NIFTY50 index rose over 2% and ended the week at 24,677.
Except for FMCG (-0.3%), all the other major sectoral indices ended the week in the green, with Real Estate (+5.2%), PSU Banks (+5.0%), and Consumer Durables (+5.0%) advancing the most.
Index breadth
The NIFTY50 index maintained positive breadth, with over 30% of its constituents trading above their respective 50-day moving averages (DMA). However, as indicated on the chart below, the broader index breadth remains below the critical 50% threshold. The trend may shift decisively to bullish if the index reclaims the 25,000 zone on a closing basis and sustains a breadth indicator reading above 50%. Until these conditions are met, the trend will likely remain sideways to mildly bullish.
FIIs positioning in the index
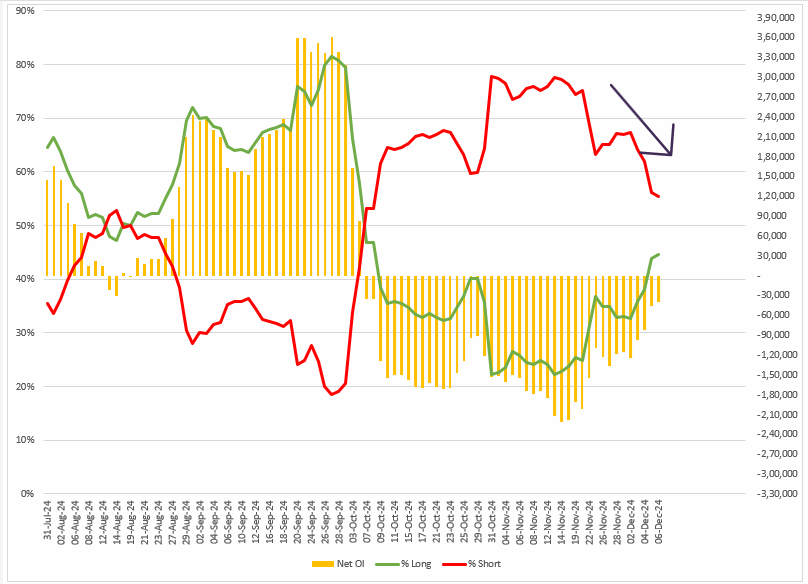
Foreign Institutional Investors (FIIs) reduced their net short open interest (OI) in the index futures by 68% in the previous week, taking the net OI to thirty-nine thousand. The FIIs started the December series with a long-to-short ratio of 33:67, and as of 6 December, the ratio stands at 45:55, pointing to the significant unwinding of the net short contracts.
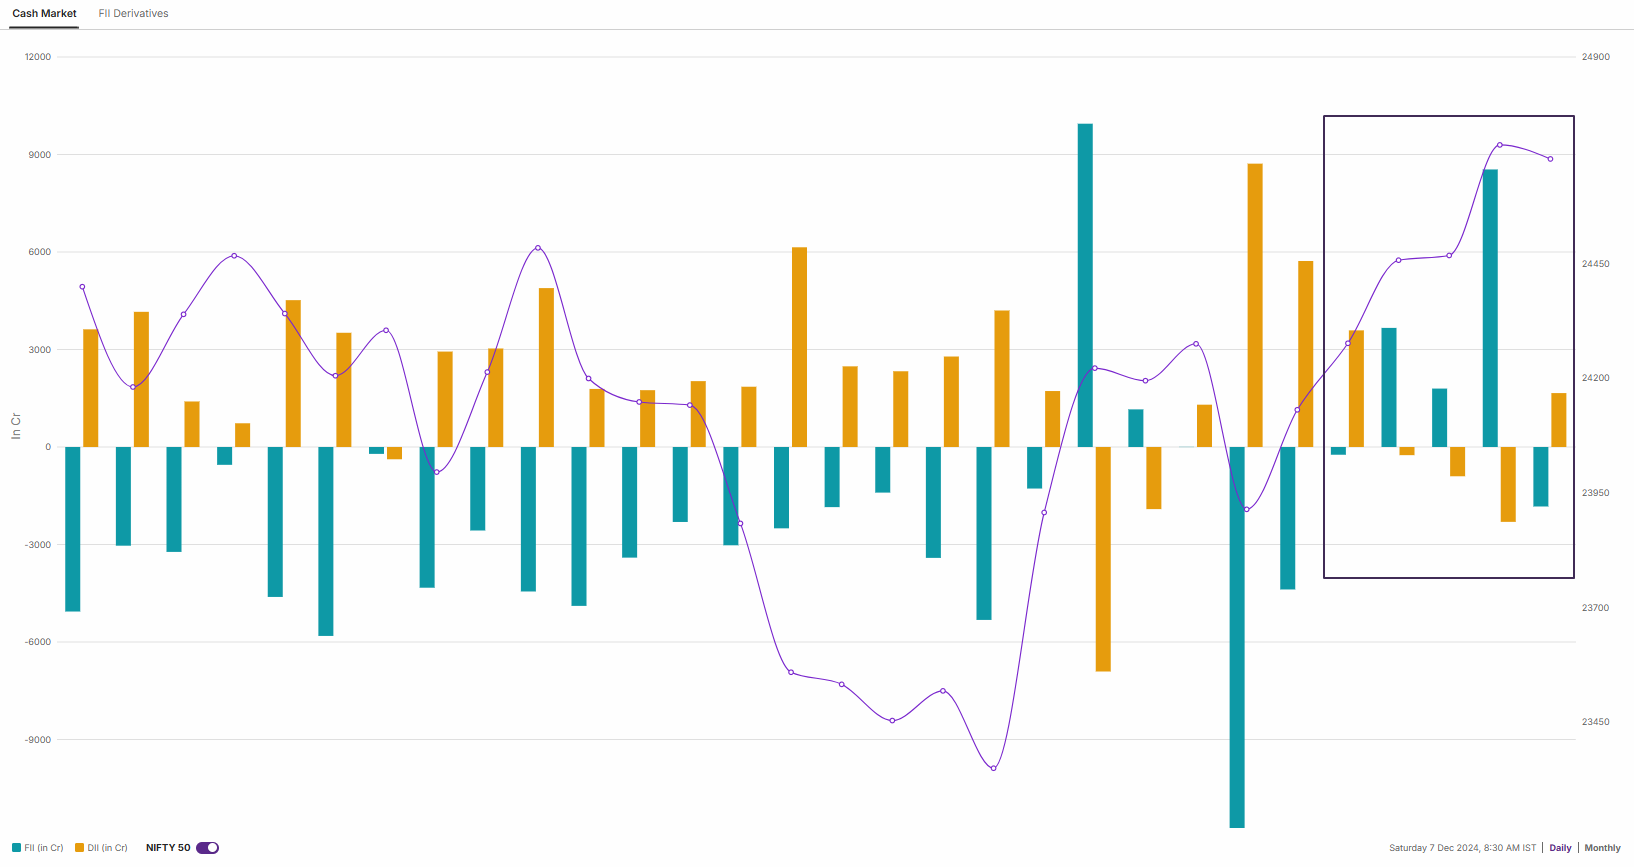
The trimming of the net short open interest of FIIs in the index futures was in line with their cash market. The FIIs turned net buyers during the first week of December and purchased shares worth ₹11,933 crore. Meanwhile, the Domestic Institutional Investors (DIIs) sustained the buying momentum and bought shares worth ₹1,792 crore, taking the net institutional activity to ₹13,726 crore.
NIFTY50 outlook
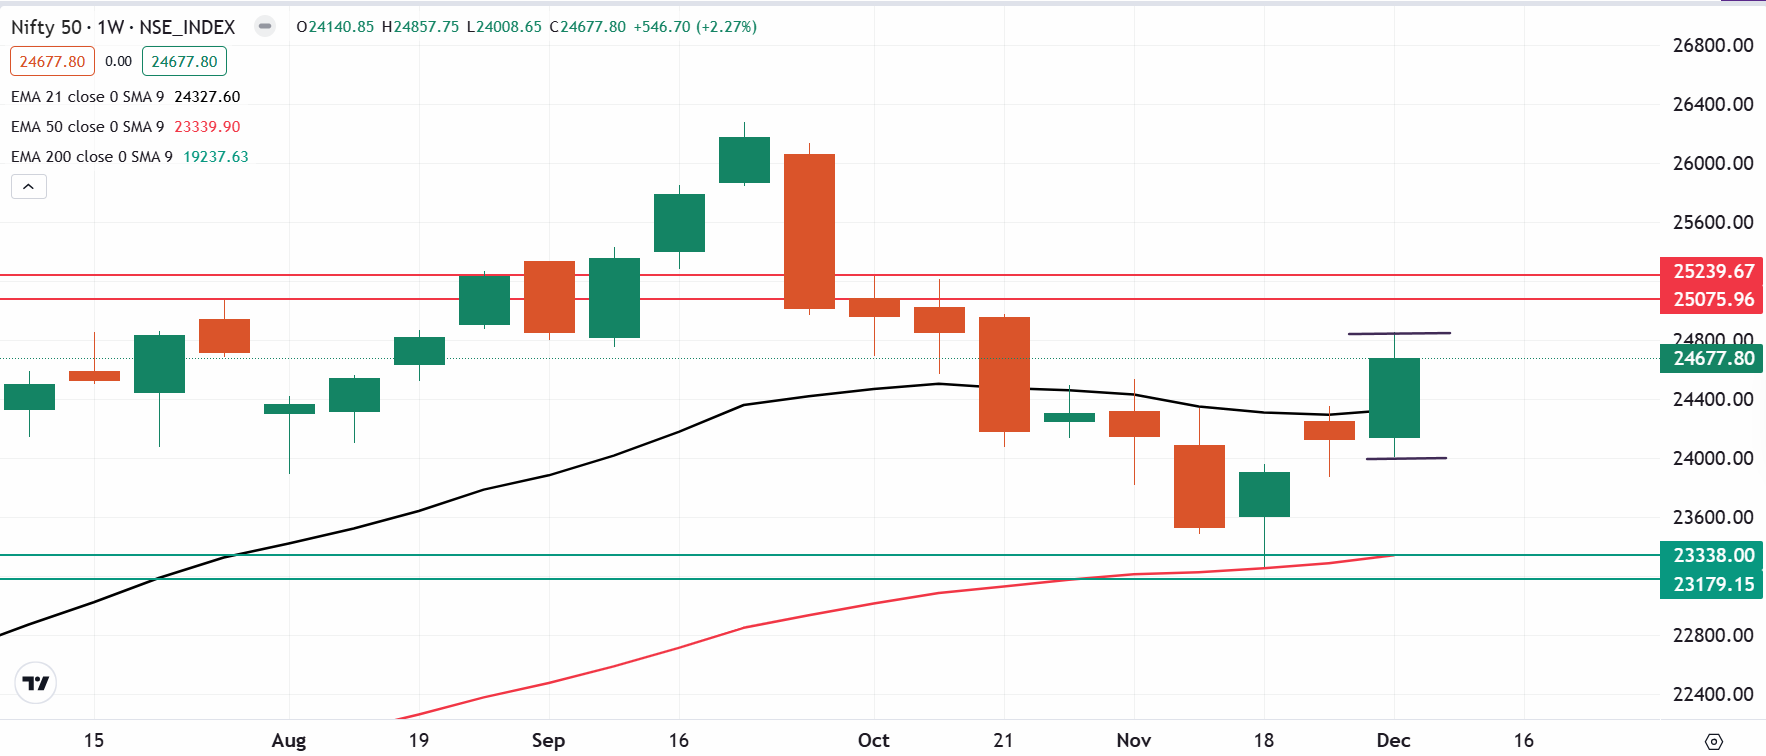
The NIFTY50 index extended its gains for the third week in a row after confirming the hammer candlestick pattern during the week ending 22 November. The index reclaimed its 20 weekly exponential moving average (EMA) and closed above the previous week’s high, indicating that the bulls remained in control throughout the week. However, due to sharp volatility, the trading range of the index expanded to 3.5%, which is above the average range of the index.
In the upcoming week, traders can monitor the previous week’s high and low. Unless the index breaks these levels on a closing basis, the trend may remain sideways. A break above or below these levels on the closing basis on the daily chart may provide further directional clues.
SENSEX outlook
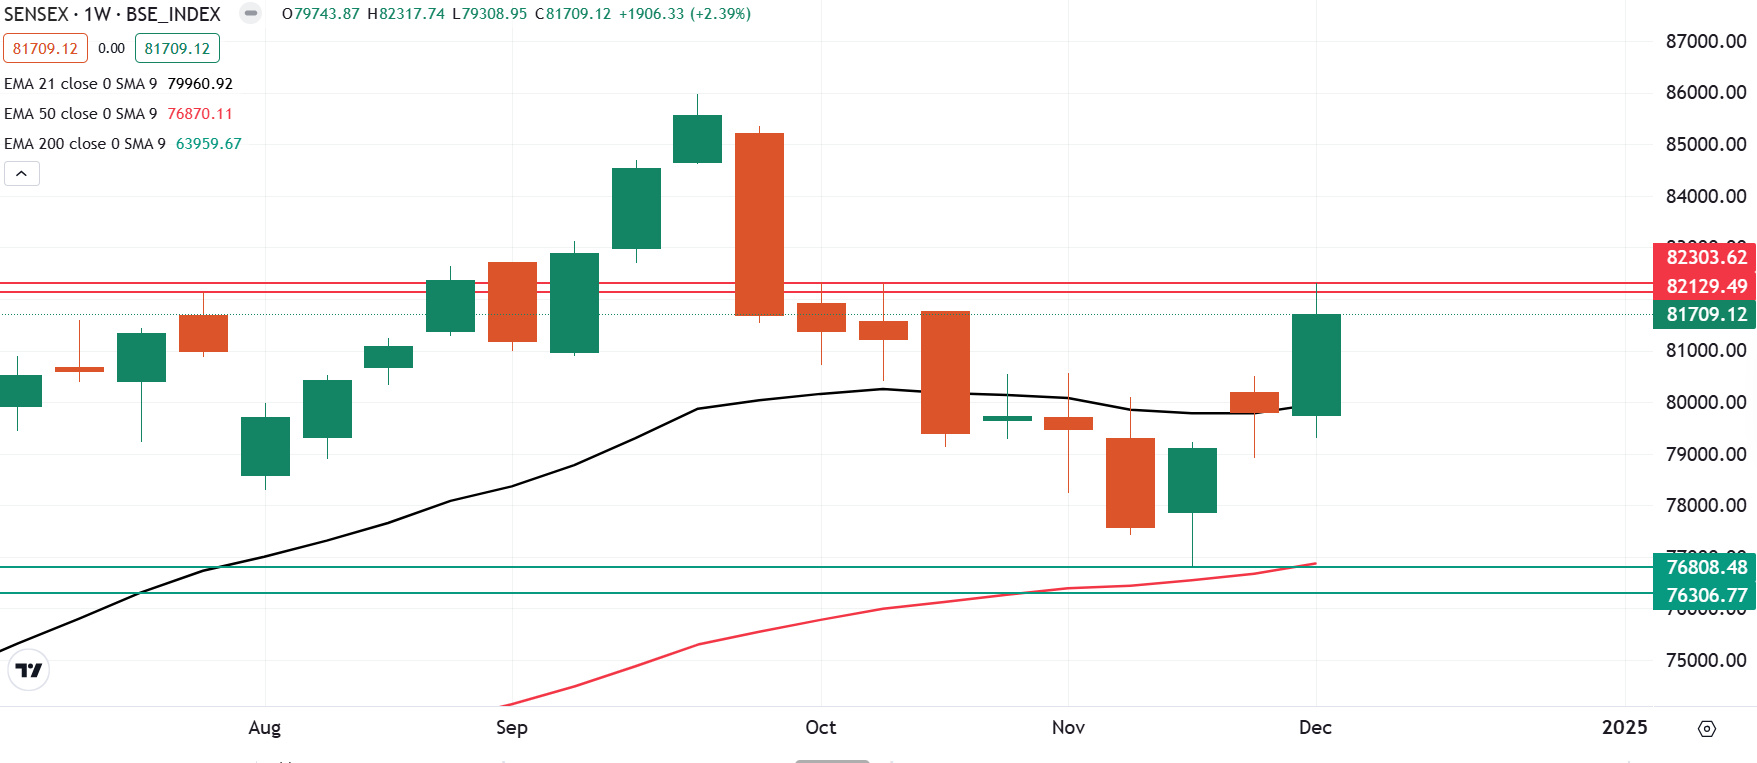
The SENSEX also extended its bullish momentum for the third consecutive week and reclaimed 20 weekly EMA on a closing basis. However, the index witnessed resistance around the highlighted zone of 82,300 and faced rejection from higher levels, indicating the presence of sellers around these levels.
For the upcoming week, the index may consolidate its gains within the previous week’s range, with immediate support around 79,300 and resistance around 82,300. Unless the index breaks this range on a closing basis, the trend may remain range-bound.
Domestically, the November inflation report is set to be released on December 12. Market estimates suggest that retail inflation may rise to 5.7% year over year, a decline from October's 6.2% reading.
Experts believe that the CRR cut will improve liquidity in the system and have a positive impact on banks. However, it is important to note that RBI decided to keep the repo rate at 6.5% for the 11th consecutive meeting since February 2023. This underscores the RBI's cautious stance amid persistent inflationary pressures and slowing growth. The central bank also raised its inflation forecast for FY25 to 4.8% from 4.5%.
The OPEC+, which accounts for roughly half of global oil output, announced it would delay its planned output hikes by three months to April 2024. However, weak global demand—especially from top importer China—and rising supply from the U.S. continue to weigh on prices. Against this backdrop, the Brent Crude settled at $71 a barrel, down 1.4% for the week, while U.S. West Texas Intermediate (WTI) ended the week at $67 a barrel, down 1.5%.
Meanwhile, the sharp swings in both directions and a rise in volatility pushed the index's trading range to over 3.5%, exceeding the average. Despite this, the index closed above the previous week’s high, reflecting buying interest at lower levels.
For the upcoming week, traders should focus on the previous week’s high and low as key levels. Unless the index closes beyond these levels on the daily chart, the trend is likely to remain range-bound.
For intraday range updates and any revisions to these levels, visit our daily morning trade setup blog, published at 8 AM before the market opens.
Derivatives trading must be done only by traders who fully understand the risks associated with them and strictly apply risk mechanisms like stop-losses. The information is only for consumption by the client, and such material should not be redistributed. We do not recommend any particular stock, securities, or trading strategies. The securities quoted are exemplary and not recommendatory. The stock names mentioned in this article are purely to show how to do analysis. Make your own decision before investing.
About The Author
Next Story


