Market News
Week ahead: Q3 GDP data, F&O monthly expiry, FII activity among key market triggers to watch out
.png)
6 min read | Updated on February 23, 2025, 13:45 IST


SUMMARY
In the holiday-shortened week, key global and domestic factors will shape market trends, including Nvidia’s earnings, U.S. PCE inflation data, and India’s Q3 GDP release. Additionally, Trump’s tariffs and persistent foreign fund outflows could impact sentiment.

FIIs continue to hold a heavily skewed net short position in index futures. | Image source: Shutterstock.
Markets traded in a narrow range last week and remained under pressure, amid a mix of local and global factors. Volatility was driven by the U.S. President Donald Trump’s persistent threats of reciprocal tariffs, subdued third-quarter corporate earnings and relentless foreign fund outflows.
The broader markets took a breather after experiencing a sharp sell-off in the second week of February. Both Midcap 100 and Smallcap 100 index rebounded over 1% and formed a doji candlestick pattern on the weekly chart, reflecting indecision among investors.
Among sectors, Metals (+5.1%) and Energy (+3.3%) saw the strongest gains, while Automobiles (-2.5%) and Pharmaceuticals (-2.0%) recorded the steepest declines last week.
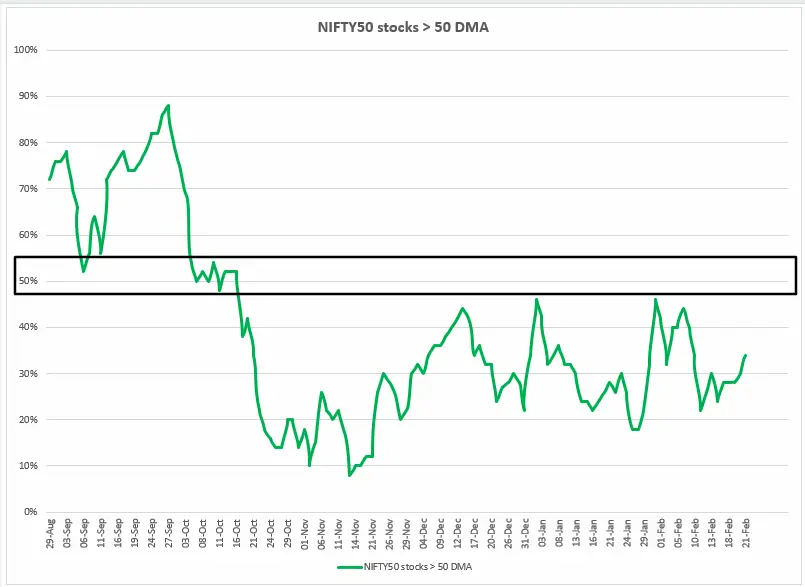
Index breadth
The Breadth Indicator, which measures the percentage of NIFTY50 stocks trading above their 50-day moving average (DMA), remained largely unchanged over the past week, fluctuating between 28% and 34%.
With no meaningful recovery in breadth, the indicator has remained below the critical 50% level for over four months. Until there is a decisive improvement, sentiment is likely to remain volatile, limiting upside potential.
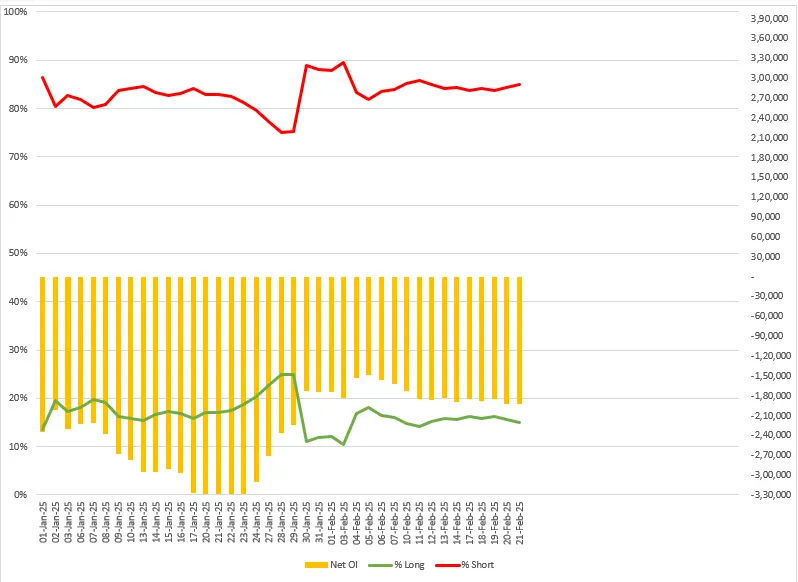
FIIs positioning in the index
Foreign Institutional Investors (FIIs) maintained their bearish stance last week, keeping the long-to-short ratio stagnant at 16:84 throughout. Despite the ratio remaining unchanged, the net open interest (OI) of FIIs in index futures reached its highest level of -1.92 lakh contracts by the end of the week, reflecting sustained bearish stance
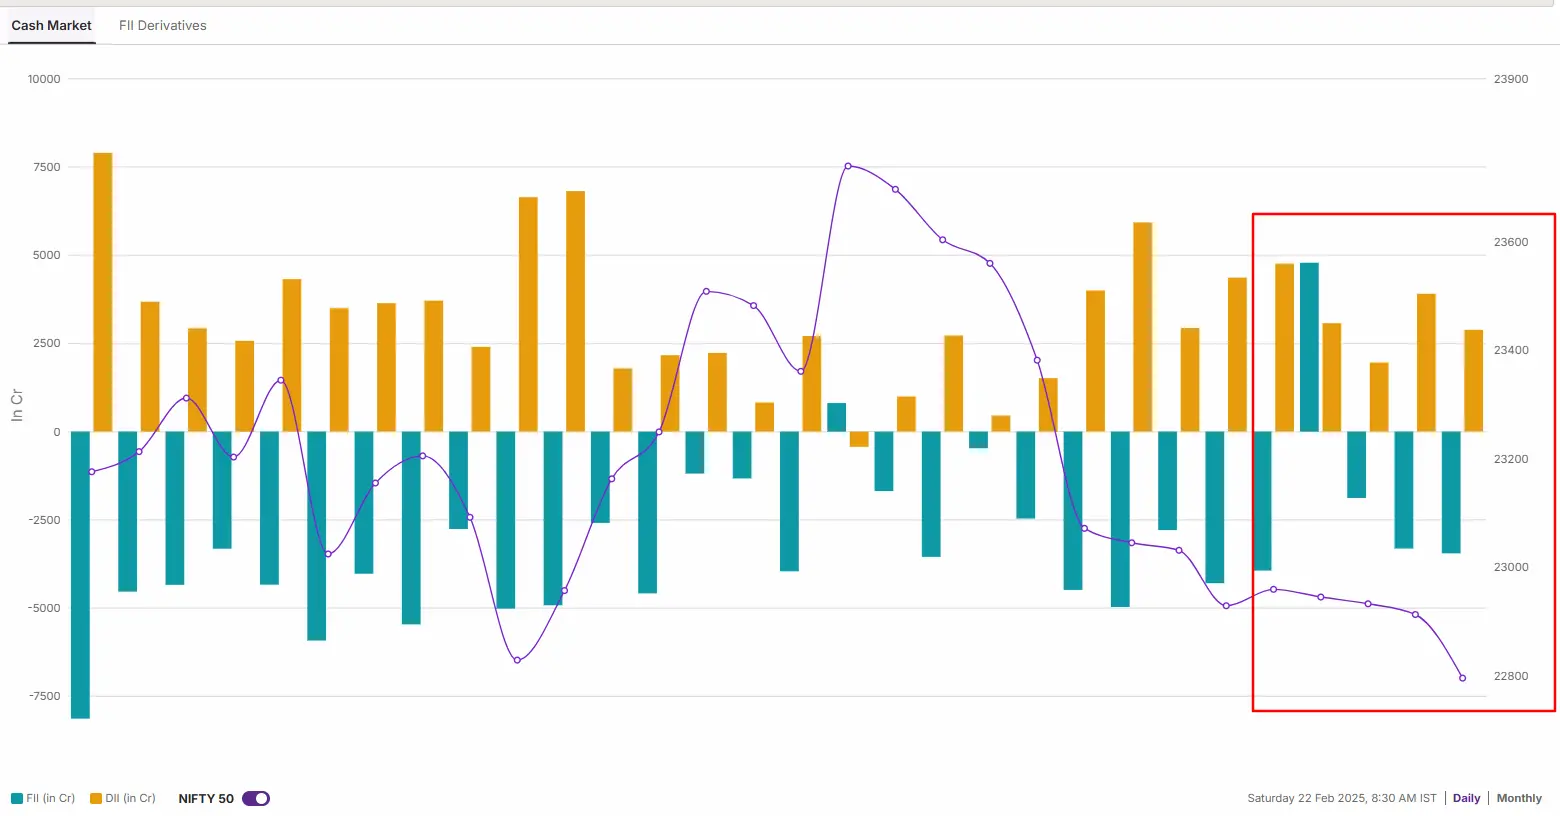
Meanwhile, the FIIs remained net sellers in the cash market and offloaded shares worth ₹7,793 crore. On the flip side, the Domestic Institutional Investors (DIIs) remained the net buyers and purchased shares worth ₹16,582 crore.
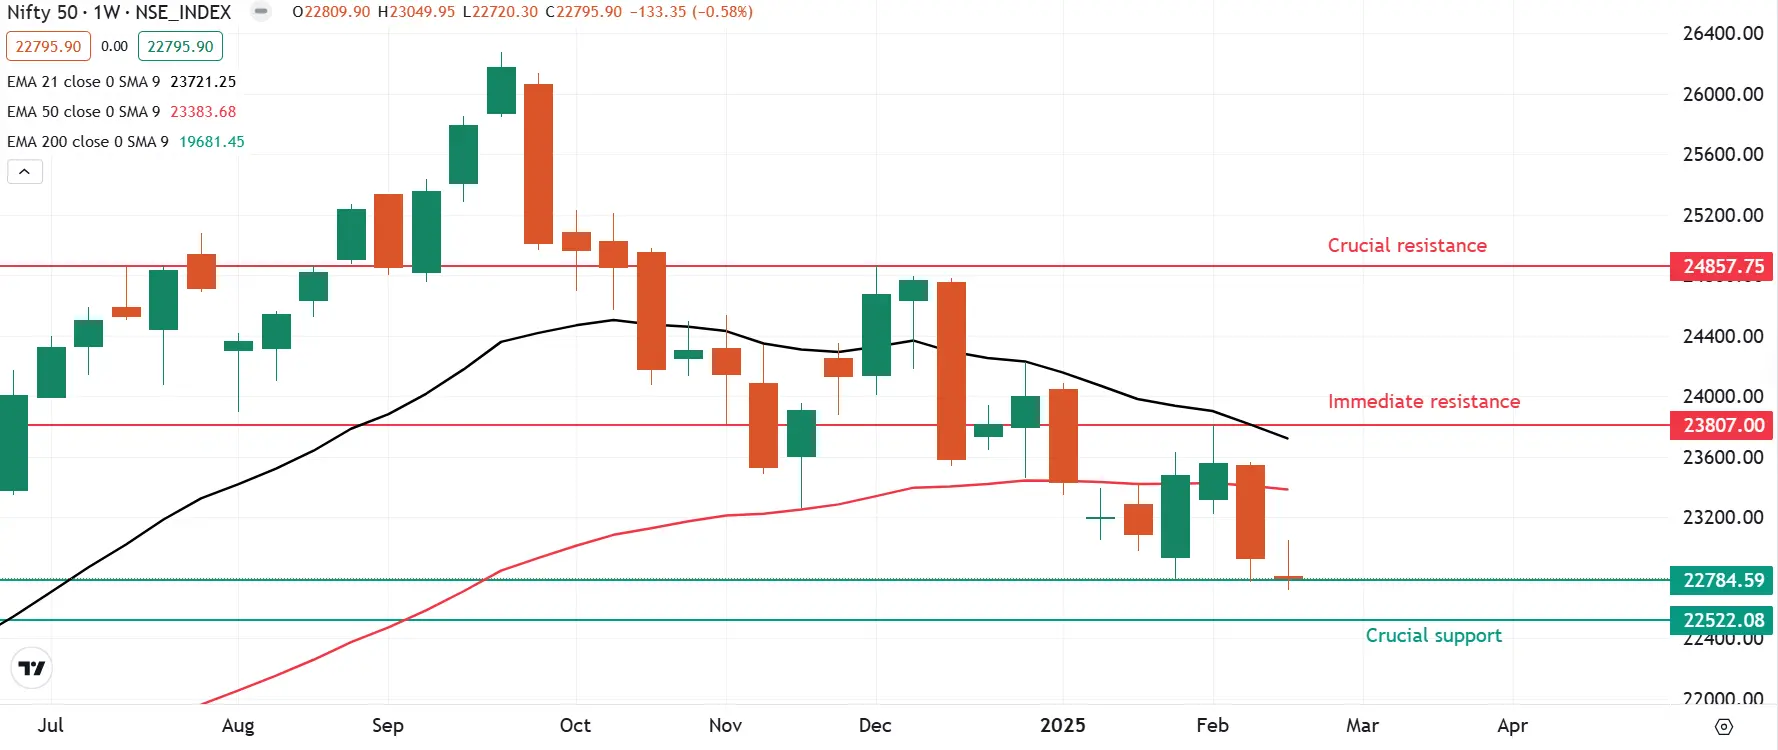
NIFTY50 outlook
The technical outlook of the NIFTY50 index remains bearish on the weekly chart, as it ended the week near the previous week’s low. Additionally, the index formed a pause candle resembling a gravestone doji, a bearish candlestick pattern.
However, this pattern has emerged at the crucial support zone of 22,500. A breakdown below this level in the upcoming week could signal further weakness. Conversely, a rebound and a close above the previous week’s high of 23,049 would invalidate the bearish setup, suggesting a potential recovery.
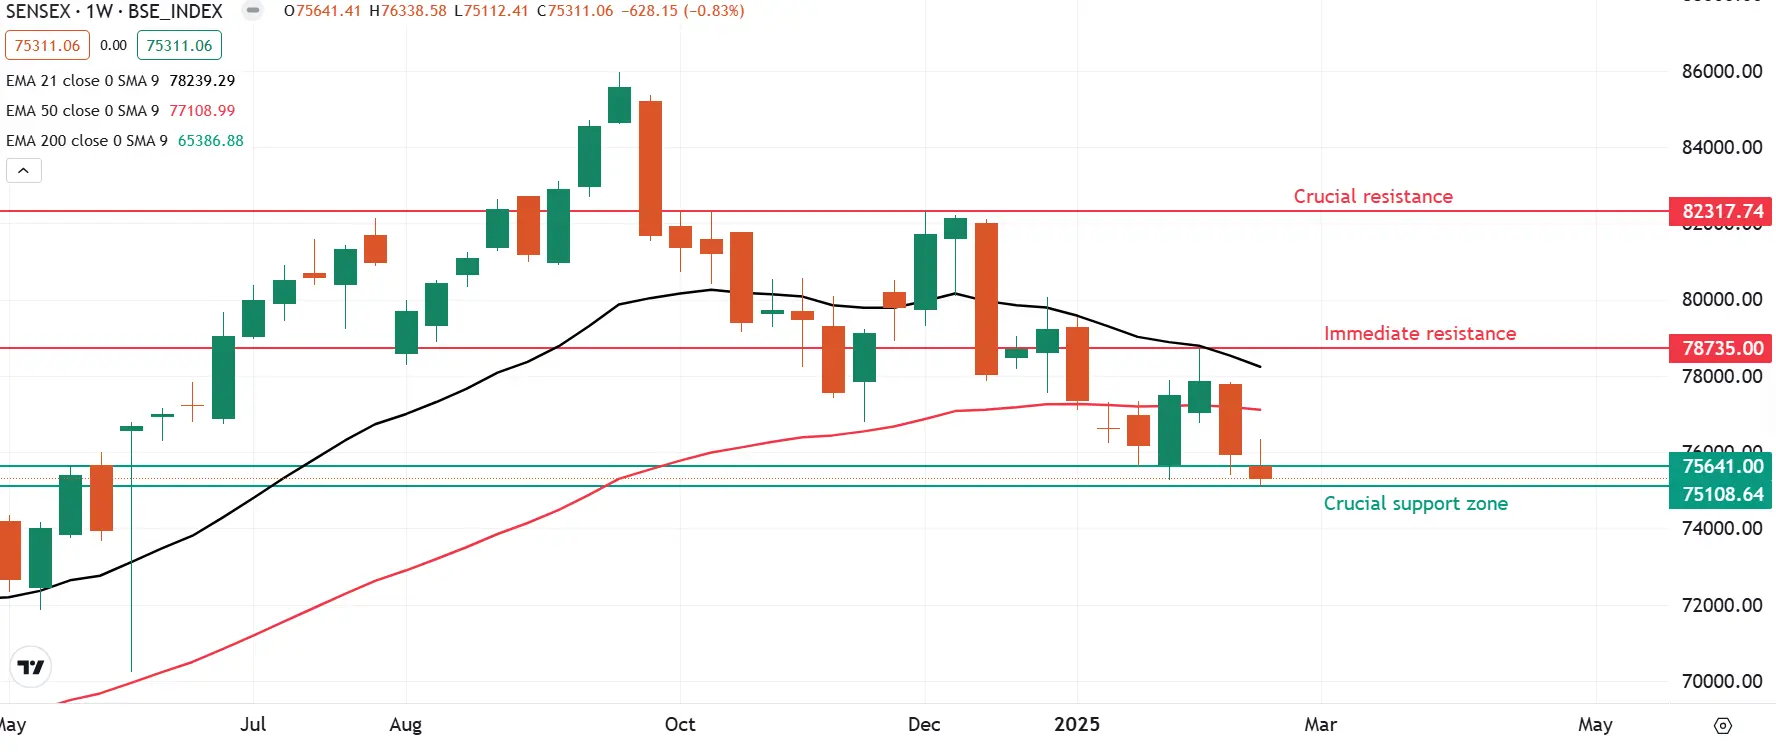
SENSEX outlook
The SENSEX ended the week below the previous week's low, forming an inverted hammer candlestick pattern on the weekly chart—a bullish reversal signal appearing at a key support zone. However, the broader structure of the index still remains weak.
Traders should closely watch the upcoming weekly close, as a close below the pattern's low and the crucial 75,100 support level could indicate further downside potential. Conversely, a rebound from lower levels and a close above the pattern’s high of 76,338 would confirm the reversal, suggesting a possible recovery.
On the domestic front, market experts expect India's GDP growth to slow to a four-year low of 6.4% this fiscal year. Estimates for Q3 GDP growth range from 6.2% to 6.4%. The official FY25 Q3 GDP data will be released on Friday 28th February after market hours, along with the government's second advance estimate of full year GDP.
This comes after the U.S. President Donald Trump, less than two weeks ago, imposed a 25% tariff on steel and aluminum imports. Narendran noted that these tariffs could strengthen the case for domestic ferrous companies seeking protective measures.
However, it is important to note that the gravestone doji is a bearish reversal pattern that is only confirmed if the subsequent candle closes below the low of the pattern.
In the upcoming week, traders should closely monitor the index’s price action and weekly close. A decisive close below the previous week’s low and the key 22,500 support level would reinforce bearish sentiment. Conversely, if the index rebounds and closes above the reversal pattern’s high of 23,049, it could signal a continuation of the recovery.
For intraday range updates and revisions to these levels, visit our daily morning trade setup blog, published at 8 AM before the market opens.
Disclaimer: Derivatives trading must be done only by traders who fully understand the risks associated with them and strictly apply risk mechanisms like stop-losses. The information is only for consumption by the client, and such material should not be redistributed. We do not recommend any particular stock, securities, or trading strategies. The securities quoted are exemplary and not recommendatory. The stock names mentioned in this article are purely to show how to do analysis. Make your own decision before investing.

About The Author
Next Story


