Market News
Week Ahead: Q2 earnings, Inflation data, Swiggy IPO listing and FIIs trading activity to drive market sentiment
.png)
5 min read | Updated on November 11, 2024, 08:32 IST
SUMMARY
In a holiday-shortened week, the NIFTY50 index may remain range-bound and trade within the previous week's range. However, a close above or below the previous week's high or low on the daily chart will lead to a change in momentum.

Key things to know that could markets in the week ahead
Markets resumed the negative trend after a week-long pause and ended the post-Diwali week in the red. NIFTY50 index was down 0.6% on a weekly basis, largely consolidating around its August monthly low.
Despite the positive global cues, the weakness in the index was due to a broad-based sell-off across sectors and continued selling by foreign investors. Meanwhile, the news of Donald Trump's victory in the U.S. presidential election and the U.S. Federal Reserve's quarter-point rate cut led to a short-term rebound in the indices.
Sectorally, Energy (-3.1%), FMCG (-1.8%) and Oil & Gas (-1.8%) witnessed selling pressure, while IT (+4.0%) and PSU Banks (+0.9%) saw buying momentum.
Index breadth- NIFTY50
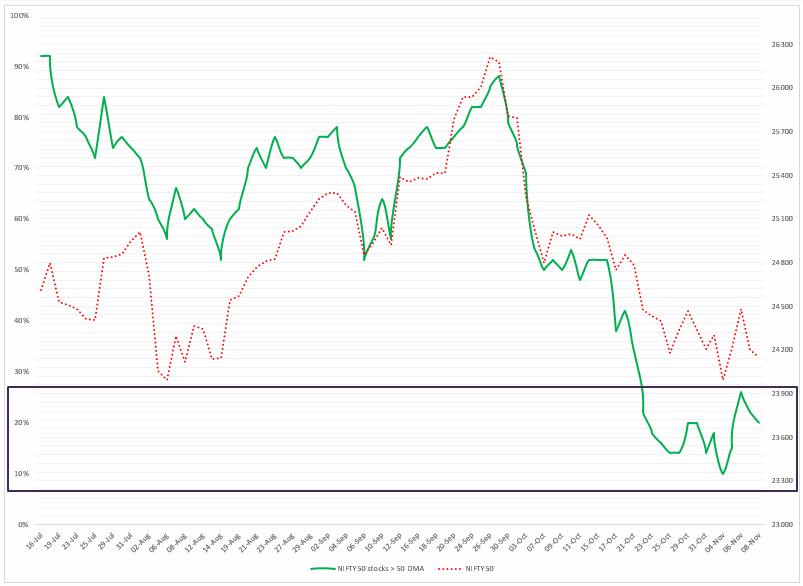
The NIFTY50 index showed continued weakness last week, with 80% of its stocks trading below their 50-day moving average (DMA) throughout the period. As it stands, only 20% of the index's stocks are trading above this key technical level. The index has remained in oversold territory for the past three weeks, suggesting that any upward movement could lead to a short-term rebound.
FIIs positioning in the index
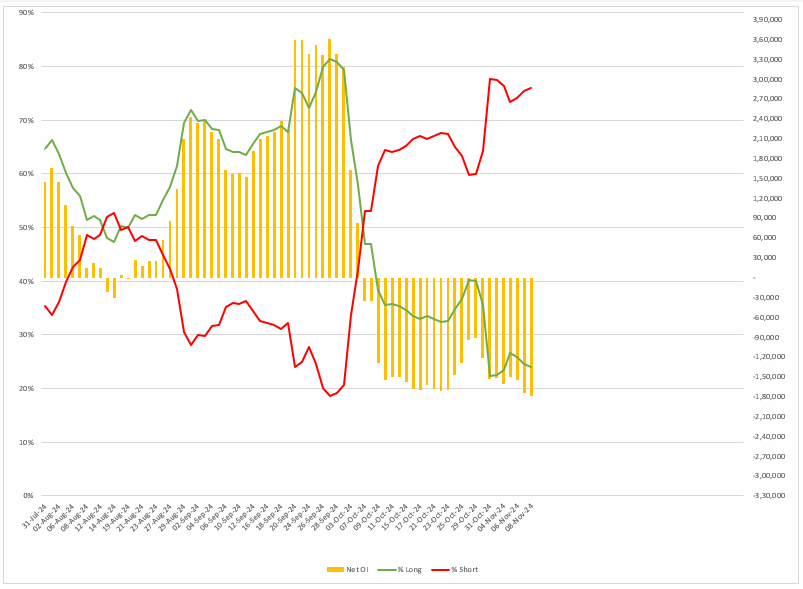
Despite the short-term rebound, the foreign investors (FIIs) remained net short on the index futures last week. As shown in the chart below, the FIIs sustained the net short contracts above 1.5 lac contracts throughout the week and ended the week with the long-to-short ratio of 24:76. Given this skew towards net short contracts, traders should closely monitor the addition and unwinding of long positions to assess potential shifts in index momentum.
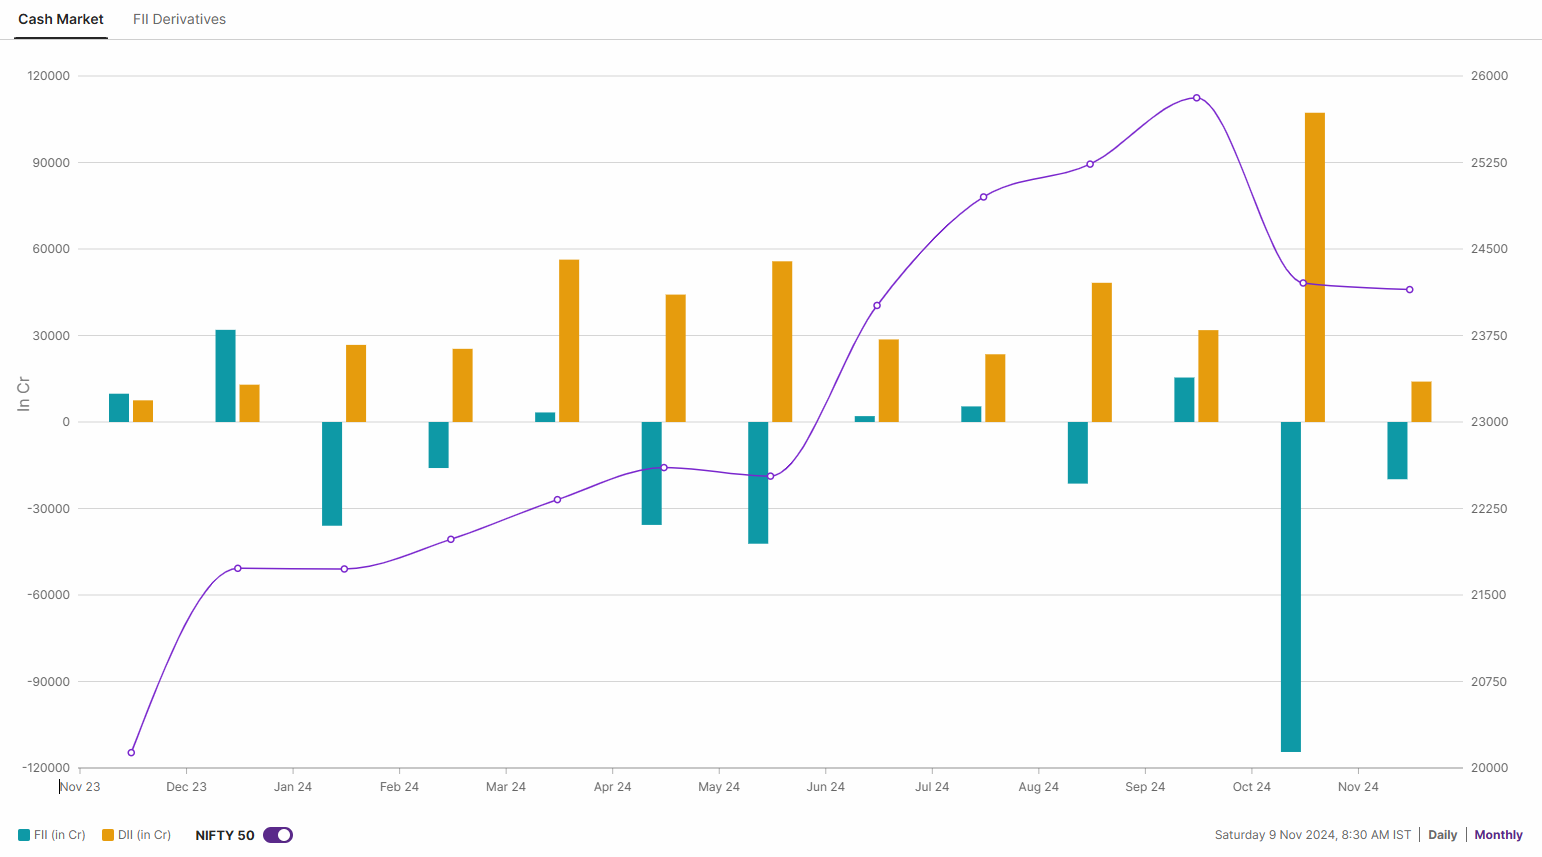
The cash market activity of the FIIs remained in line with index derivatives. After remaining net sellers for the entire October, the FIIs started the November series with the negative momentum and sold shares worth ₹19,637 crore previous week. Conversely, the Domestic Institutional Investors remained net buyers and bought shares worth ₹14,391 crore, resulting in the net outflow of ₹5,246 crore.
NIFTY50 outlook
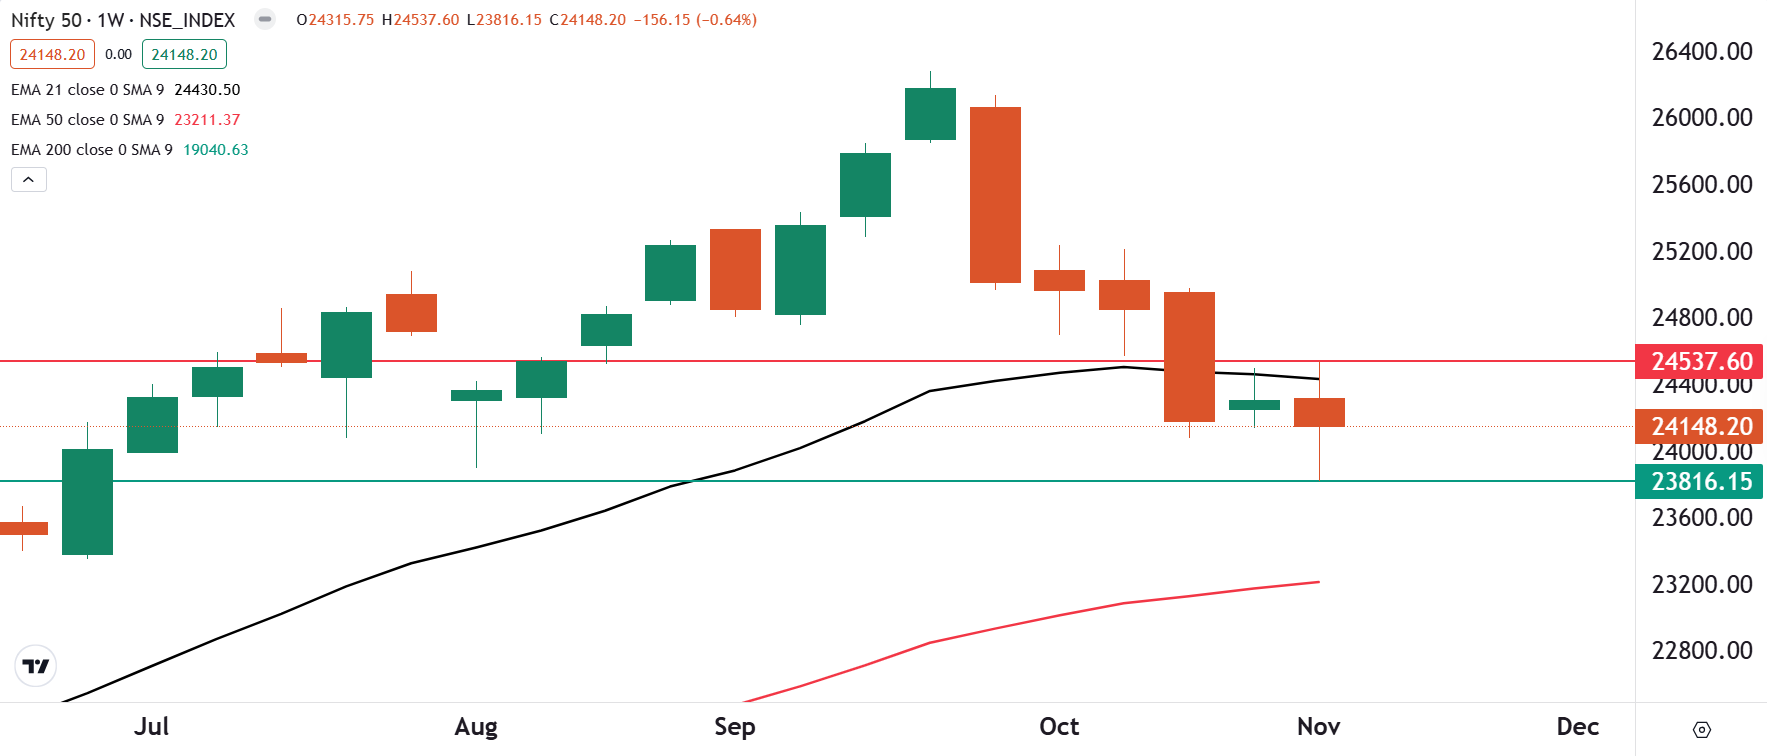
The technical structure of the NIFTY50 index remains range-bound, as evidenced by a doji candlestick pattern on the weekly chart. This neutral pattern is indicative of investor indecision and signals a potential pause in trend direction.
From a positional point of view, traders should watch the high and low points of this doji pattern. A daily close above or below these levels could provide a clear directional signal. However, until the index breaks decisively out of this range on a closing basis, the trend may remain within last week's trading range.
BANK NIFTY outlook
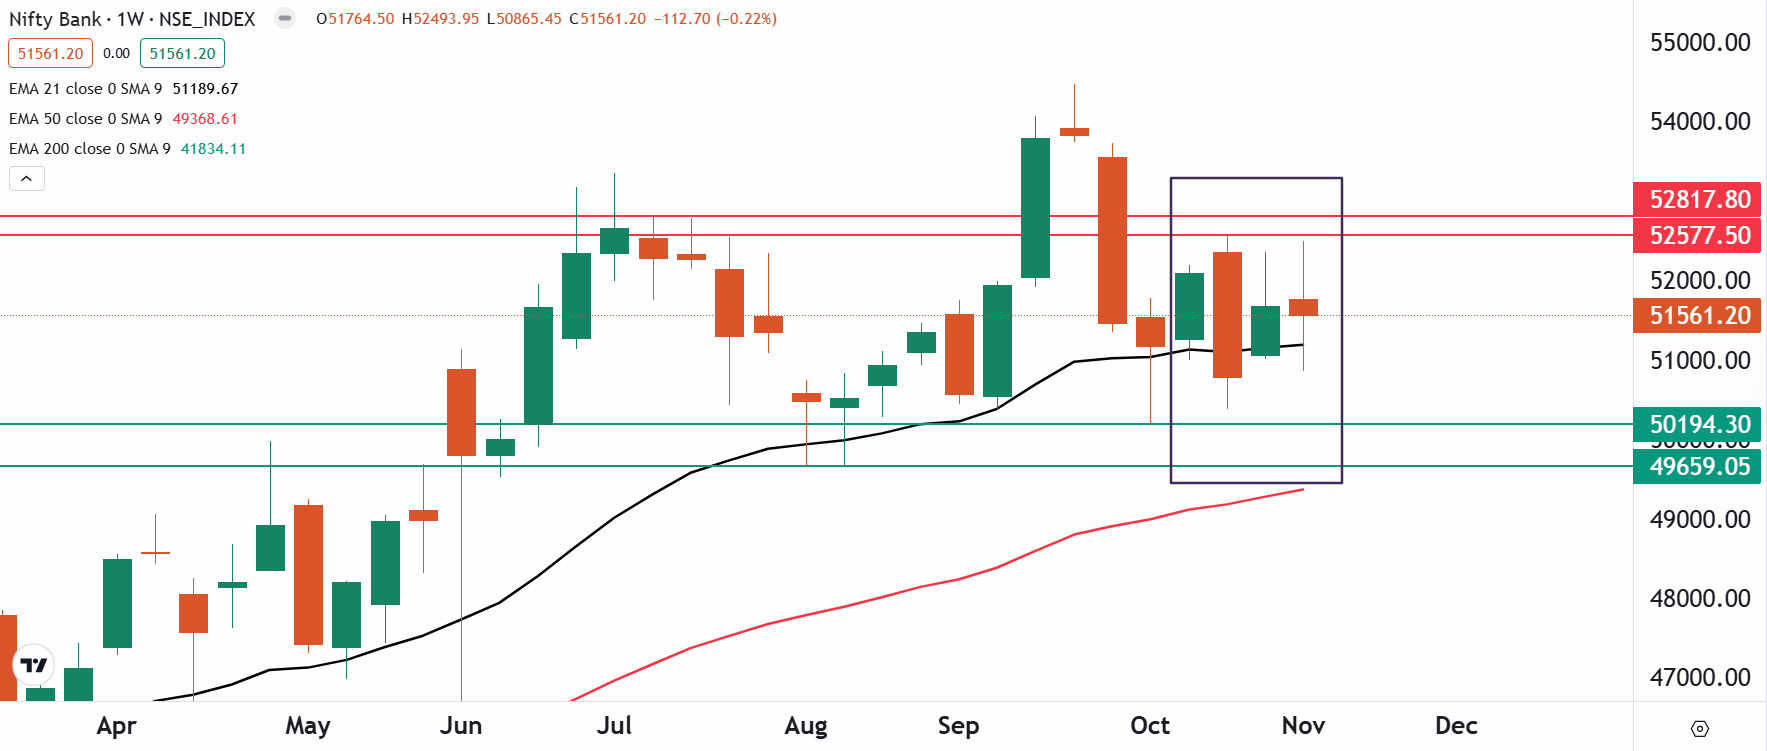
The banking index extended the consolidation for the fourth week in a row and also formed a doji candlestick pattern on the weekly chart, reflecting ongoing range-bound movement. Positionally, unless the index closes above 52,800 or below 49,700, the trend may remain sideways. However, a close above this level on daily chart may provide strong directional clues.
The Fed Chair Jerome Powell will speak at the Federal Reserve Bank of Dallas on Thursday. His remarks will come a week after the central bank cut its interest rate by a quarter of a percentage point.
To stay updated on any changes in these levels and all intraday developments, be sure to check out our daily morning trade setup blog, available before the market opens at 8 am.
Related News
About The Author
Next Story


